ESTIMATES OF GENETIC PARAMETERS AND SELECTION
GAINS TO SCAB RESISTANCE IN SOUR PASSION FRUIT
1MARIANA BATISTTI2, DEJÂNIA VIEIRA DE ARAÚJO3, WILLIAM KRAUSE3, INÊS ROEDER NOGUEIRA MENDES4, JURANDIR AMBRÓSIO5
ABSTRACT – Passion fruit stands out as one of the most cultivated fruits in Brazil. As the culture expanded, an increase in phytosanitary problems was observed. Fungal diseases like scab are among phytosanitary problems. The aim of this study was to quantify scab intensity on leaves, and to estimate genetic parameters and selection gains to scab resistance in sour passion fruit full related families (FRF). Two experiments were
conducted to evaluate the reaction of FRF, the first period from January to April (environment 1) and the
second from May to August 2014 (environment 2). Experiments were conducted in greenhouse. Randomized block design for both experiments with FRF in two seasons was used, with three plants per plot and three repetitions. The evaluated characteristics were: score within 42 days after inoculation (DAI), area under the disease progress curve of severity (AUDPCS) and incidence (AUDPCI). Individual and joint variance trait analyses were carried out, estimating genetic parameters and gains per direct and indirect selection. Heritability estimates in a broad sense were higher than 89.9% for all traits in the individual and joint analysis. Selection gains were high for the evaluated traits in both environments and the greatest genetic progress was
obtained by the direct selection in each feature. Of FRF selected, 92% and 36% were classified as moderate
for environments 1 and 2, respectively. The highest gains in direct and indirect selection were obtained for AUDPCS in the individual analyses of environments and in the joint analysis. FRF 68, 46, 66, 75, 47, 51, 52, 54 and 77 were moderately resistant, which allows their use in a scab resistance breeding program. Index terms: Passiflora edulis, Cladosporium herbarum, breeding.
ESTIMATIVAS DE PARÂMETROS GENÉTICOS E GANHOS DE SELEÇÃO
DA RESISTÊNCIA DO MARACUJAZEIRO-AZEDO À VERRUGOSE
RESUMO - O maracujá destaca-se como uma das frutíferas mais cultivadas no Brasil. Com a expansão
da cultura, houve aumento dos problemas fitossanitários. Dentre os problemas fitossanitários, estão as doenças fúngicas, como a verrugose. Objetivou-se, neste trabalho, quantificar a intensidade da verrugose
nas folhas, estimar parâmetros genéticos e o ganho de seleção da resistência à verrugose em famílias de irmãos completos (FICs) de maracujazeiro-azedo. Foram realizados dois experimentos para avaliar a reação das FIC, sendo o primeiro no período de janeiro a abril (ambiente 1) e o segundo de maio a agosto de 2014 (ambiente 2). Os experimentos foram conduzidos em ambiente protegido. Utilizou-se o delineamento de blocos casualizados para os dois experimentos, com as FICs em duas épocas, contendo três plantas por parcela e três repetições. As características avaliadas foram: nota aos 42 dias após a inoculação (DAI), área abaixo da curva de progresso da severidade (AACPS) e da incidência (AACPI) da verrugose. Foram realizadas análises de variância individual e conjunta das características, estimados os parâmetros genéticos e os ganhos por seleção direta e indireta. As estimativas de herdabilidade no sentido amplo foram maiores que 89,9% para todas as características, nas análises individuais e conjunta. Os ganhos de seleção foram altos para as características avaliadas nos dois ambientes, e o maior progresso genético foi obtido pela seleção direta
em cada característica. Das FICs selecionadas, 92% e 36% foram classificadas como moderadamente para
os ambientes 1 e 2, respectivamente. Os maiores ganhos na seleção direta e indireta foram obtidos para a característica AACPS, nas análises individuais dos ambientes e na análise conjunta. As FICs 68; 46; 66; 75; 47; 51; 52; 54 e 77 foram moderadamente resistentes, o que possibilita o uso das mesmas em um programa de melhoramento, visando à resistência à verrugose.
Termos para indexação: Passiflora edulis, Cladosporium herbarum, melhoramento.
1(Paper 047-16). Received March 21, 2016. Accepted August 01, 2016. 2
Professora do Curso de Técnico em Agropecuária no Instituto Federal de Mato Grosso (IFMT). E‑mail: marianabatistti-agro@ hotmail.com
3Professor do Curso de Agronomia e do Centro de Pesquisa, Estudos e Desenvolvimento Agro-Ambientais (CPEDA) da Universidade do Estado de Mato Grosso (UNEMAT). E‑mail: [email protected] ; [email protected].
4
INTRODUCTION
World production of passion fruit (Passiflora edulis Sims) is mainly concentrated in the southern hemisphere. Brazil is the world’s largest producer, with an estimated area of 50,000 ha-1 and production of more than 700 thousand tons (IBGE, 2014). The cultivation of passion fruit has evolved rapidly in Brazil, being cultivated in almost all the national territory. However, low average productivity has been observed, mainly due to the occurrence of diseases, which also decreases fruit quality, and consequently its commercial value (FALEIRO et al., 2004; MELETTI, 2011).
Among the fungal diseases of aerial part of national importance that has caused great damages in passion fruit production, scab or cladosporium stands out (Cladosporium herbarum L.). This disease causes quantitative and qualitative damages; affects the development of plant and fruits, and consequently reduces the life span of passion fruit orchards (JUNQUEIRA et al., 2005; BUENO et al., 2007).
Losses caused by diseases can be minimized with the use of resistant cultivars. According to Viana and Gonçalves (2005), genetic improvement related to passion fruit culture aims to meet the market demands for quality, increase in productivity and resistance to diseases. In this sense, the development of resistant cultivars aims at the reduction of production cost, agribusiness sustainability and reduction of environment impacts (JUNQUEIRA et al., 2003)
As it is cross-pollinated plant, several breeding methods are applicable to passion fruit, which are based on the increase in the frequency of favorable alleles or on the exploitation of hybrid vigor or heterosis. Among the breeding methods, mass selection, mass selection with progeny testing,
selection of clones, interspecific and intervarietal
hybridizations and recurrent selection as the main methods applied in passion fruit breeding programs (BRUCKNER et al., 2002).
Considering the methods used in passion fruit breeding programs, obtaining estimates of genetic parameters is of fundamental importance. These estimates allow identifying the nature of the action of genes involved in the control of quantitative traits
in order to evaluate the efficiency of the different
breeding strategies by obtaining predicted genetic gains and maintaining an adequate genetic base.
Thus, the aim of this study was to quantify the scab intensity in passion fruit leaves and to estimate genetic parameters and selection gains of scab resistance in passion fruit full related families.
MATERIAL AND METHODS
Experiments were conducted in a protected environment, at the experimental area of the State University of Mato Grosso (UNEMAT), located in the municipality of Tangará da Serra, MT, located at 14º30’S, 57º25’W, with average altitude of 321,5 m a.s.l.
Eighty-three sour passion fruit full related families (FRF) from crosses performed in the UNEMAT-01 population of the UNEMAT sour passion fruit breeding program were evaluated. These
families were evaluated in two experiments, the first
in the period from January to April (Environment 1) and the second from May to August 2014 (Environment 2).
A randomized block design was used for both experiments, where treatments were composed of 83 FRF, with three plants per plot and three replicates.
FRF sowing was performed in 288-cell trays containing commercial vermiculite substrate (Plantmax®). After 30 days, seedlings were transplanted to polyethylene bags of 15 cm in diameter and 25 cm in height, with substrate containing sand, subsoil soil, organic fertilizer (chicken manure), limestone and monoammonium phosphate. Plants were kept in protected environment, with irrigation system of 2 min hour-1. Leaf fertilizations (Platon-25®) were carried out weekly, and insecticide applications recommended for the crop were applied whenever necessary.
C. herbarum isolate was obtained from symptomatic plants, whose isolation was carried out at the Laboratory of Phytopathology of the UNEMAT Center for Research, Studies and Agro-Environmental Development (CPEDA), where it
was morphologically identified and multiplied in
Petri dishes containing approximately 20 mL PDA (potato-dextrose-agar) medium. After this procedure, plates with pure fungus colonies were stored in a BOD-type growth chamber with temperature of 25 ± 2ºC.
The inoculation of plants was performed 60 days after sowing, when plants had 4 to 6 leaves. For the inoculation of C. herbarum, Petri dishes were washed, where the conidial suspension of the pathogen was adjusted to the concentration of 5x10⁶ conidia mL-1, with the aid of a Neubauer camera.
Tween 20 was added to the final suspension (0.01%).
After spraying, plants were placed in a moist chamber made of transparent plastic bags for 24 hours.
The disease was evaluated in both environments, with interval of seven days, beginning on the seventh day after inoculation, totaling six evaluations per environment.
To determine the scab severity in leaves, the score scale adapted from the proposal of Abreu et al. (2009) was used, where score 1 corresponded to plants that did not present symptoms of the disease; 2 for plants with up to 10% of the leaf surface covered by lesions; 3 for plants with 11% to 30% of the area covered by lesions; and 4 for plants with more than 30% of the leaf surface covered by lesions.
In addition to severity, incidence, which is the percentage of diseased plants or their parts, was also evaluated in a population sample. Thus, in each evaluation, the incidence given in percentage of plants infected by C. herbarum was determined.
From these data, the area under the disease progress curve of severity (AUDPCS) and incidence (AUDPCI) were calculated. To determine the severity in the plot, the Mckinney index (1923) was applied, e01:
where ID = Disease index; F = Number of plants with a given score; V = Score observed; N = Total number of plants evaluated; X = Maximum degree of infection.
For resistance classification, plants with score
up to 1.00 were considered as resistant (R); plants with score between 1.01 and 2.00 as moderately resistant (MR); plants with score between 2.01 and 3.00 as susceptible (S) and plants with score between 3.01 and 4.00 as highly susceptible (AS), according to methodology used by Bueno et al. (2007). In order to classify FRF for resistance, the average of scores of the last evaluation of each experiment was used.
Analysis of variance was performed for each environment. Then, a joint analysis of variance was performed, in which experiments (environments)
were considered fixed and genotypes were considered
as random effects under conditions of homogeneity of residual variances using the Genes software (CRUZ, 2013).
From the average squares obtained by the analysis of variance, the components of variance associated to the genetic and environmental effects of the statistical models and the selection gains were estimated using the direct and indirect selection method, according to Cruz et al. (2012). The
phenotypic and genotypic correlation coefficients
among all evaluated traits were also estimated.
Subsequently, 25 FRF with the lowest averages for the 42 DAI characteristic in environments 1, 2 and by the joint analysis were selected. These procedures were performed using the Genes software (CRUZ, 2013).
The level of coincidence of the 25 selected FRFs was evaluated to compare FRFs selected in environment 1, with those selected in environment 2 and by the joint analysis in all traits. To estimate the coincidence index, the Hamblin and Zimmermann (1986) method was used, which is given by the expression, e02:
where: A is the number of FRFs that coincide in both selection periods; B is the number of selected plants, in this case 25, and C is the number of coincidences attributed by chance, being adopted, in this case, 10% of B.
RESULTS AND DISCUSSION
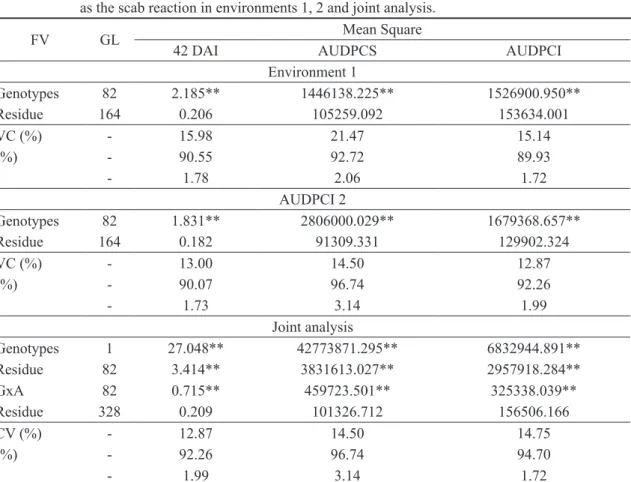
From the analyses of individual variances, significant differences were observed at 1% probability by the F test in all traits evaluated in both environment 1 and environment 2 (Table 1). This indicates the existence of genetic variability among passion fruit families and positive perspectives in obtaining genetic gains through selection.
The experimental precision, evaluated by the
variation coefficient (VC), presented values from
15.14% to 21.47% in environment 1 (Table 1). The lowest VC found is assigned to the area below the incidence curve (AUDPCI) and the highest is relative to the area below the severity curve (AUDPCS).
For environment 2, lower experimental
variation coefficients were observed, varying from 12.87% to 14.50%. The lowest coefficient 12.87%
was obtained by AUDPCI and the highest 14.50% by AUDPCS. These values are considered adequate in evaluating plant disease (Table 1).
Heritability estimates in the broad sense were higher than 89.9% for all traits evaluated in environment 1 and environment 2, being considered of high magnitude (Table 1). As heritability measures the degree of correspondence between phenotypic value and genetic value, high values of this parameter indicate that simple selection methods can lead to considerable gains, considering that the
environment had little influence (MORAES et al.,
2005; GONÇALVES et al., 2007).
63.27% for scab severity in branches and fruits, respectively. Negreiros et al. (2004) found heritability results for scab incidence of 44.68%. However, Santos et al. (2008) observed the lowest heritability value of 20.77% for scab incidence among half-brother passion fruit families. However, heritability values are intrinsic to each population.
It was possible to verify that the variation index (Iv) was greater than 1 for all traits evaluated in both environments (Table 1). These values indicate a favorable selection condition, since the genetic variance surpassed the environmental one.
In the joint analysis of variance, significant differences were observed by the F test (p≤0.01) for
all sources of variation and for all traits evaluated
(Table 1). The variation coefficients found for the
traits evaluated were 12.87% for score at 42 DAI, 14.50% for AUDPCS and 14.75% for AUDPCI, being considered low.
The heritability coefficient estimates were
high for all traits, where the highest heritability was found for AUDPCS with 96.74%, followed by AUDPCI with 94.7% and the lowest for 42 DAI with 92.26%. It was observed that the variation index was greater than 1 for all variables evaluated (Table 1), indicating a favorable selection condition, since the genetic variance surpassed the environmental one.
Selection gains were high for the traits evaluated in both environments. It was observed in both environments that the greatest genetic progress was obtained for the direct selection in each trait (Tables 2 and 3).
In environment 1, when selection was performed for 42 DAI, the response was lower in AUDPCS and AUDPCI. This was due to the lower correlation among these traits. On the other hand, in environment 2, the response of AUDPCS and AUDPCI was higher due to the higher correlation.
In relation to FRF selected by the direct selection in each trait in environment 1, 12 (48%) FRFs (81, 76, 79, 50, 74, 78, 83, 80, 82, 55, 51 and 58) were common to all traits studied. When comparing high-correlation traits such as AUDPCS and AUDPCI, 23 (92%) of FRFs were common to these two traits (Table 2).
In environment 2, 84% (21) of FRFs (68, 66, 63, 79, 67, 82, 50, 64, 78, 77, 49, 75, 47, 60, 70, 72, 73, 81, 61, and 71) were common for 42 DAI, AUDPCS and AUDPCI (Table 3). In the case of AUDPCS and AUDPCI, 23 (92%) of FRFs were common to these two traits. The direct selection in environment 2, only for AUDPCS, was the greater for the genetic progress when the selection was performed on it. According to Missio et al. (2004),
the easiest and fastest way to obtain genetic gains over a given trait is by direct selection on it.
The indirect selection, both on 42 DAI and on AUDPCI, promoted satisfactory indirect gains in AUDPCS, being superior compared to direct gains, which could be observed in both environments (Tables 2 and 3).
The families defined by direct selection in
each trait common to all traits by the joint analysis are FRF 50, 79, 66, 75, 77, 78, 82, 73, 76, 80, 74, 51, 67, 68, 64, 81 and 72, representing 68% of the selected FRFs. When comparing AUDPCS and AUDPCI, 23 (92%) of the RFRs were common to these two traits (Table 4).
When the selection was performed directly on the same trait, only AUDPCS achieved the greatest genetic progress. However, for the indirect selection, this trait obtained higher gains when the selection was applied on 42 DAI and on AUDPCI, being - 48.21% and -52.01%, respectively.
As for the coincidence index, it was observed that among the 25 FRFs that were selected in environment 1, 75% (16) of them were also selected in environment 2. In the joint analysis, the coincidence index for environment 1 was high (83, 83%), while for environment 2, lower coincidence index (63.63%) was observed (Table 5).
In a study by Peternelli et al. (2009) with
sugarcane, it was verified that the coincidence index
in the selection of genotypes was around 50%, in a scenario with 70% heritability and 10% selection intensity. With heritability reduced to 30% and selection intensity of 5%, the coincidence index decreased to close to 30%.
Table 6 shows the 25 selected FRFs that presented the lowest averages for trait 42 DAI in environments 1, 2 and by the joint analysis.
Considering the degree of resistance described by Bueno et al. (2007), of selected FRFs, most of
them 92% were classified as moderately resistant, while two (8%) were classified as susceptible in
environment 1. Regarding the degree of resistance in environment 2, it was possible to verify that of 25 FRFs, 16 (64%) were considered as susceptible and 9 (36%) were considered as moderately resistant (Table 6).
By the joint analysis of both environments, taking into account the degree of resistance, all were
classified as moderately resistant, being FRF 68, 46,
66, 75, 47, 51, 52, 54, 77, 81, 79, 76, 78, 83, 44, 79, 63, 45, 72, 73, 74, 67, 82, 58 and 64 (Table 6).
Camargo (2005), this behavior can be attributed to the number of genes involved in plant genetic resistance to diseases. So, resistance can be monogenic (qualitative resistance) or polygenic (quantitative resistance). Therefore, it is necessary to quantify the disease, which was performed in the present study.
Similar results were found by Colatto (2010), where 12 progenies were evaluated in two environments in greenhouse, and it was observed that in environment 1, all progenies were susceptible
to scab. In environment 2, it was verified that 8 progenies were classified as highly susceptible and
two as moderately resistant to scab.
According to Gonçalves (2011), the divergence of experimental results of scab resistance
in field or greenhouse is due to different factors,
among them: the existence of climatic and edaphic differences in the culture environment of materials; the origin of progenies; the origin and variability of the inoculum used in the different experimental trials; the stage of development of plants; the structures evaluated in plants as to the degree of disease severity (fruits or leaves) and also to irrigation system (drip or mist).
Passion fruit is a cross-pollinated plant and due to the use of segregating material, the genotypes of the present study that have been shown to be moderately resistant should be used in new selection cycles.
TABLE 1- Summary of analysis of variance and heritability estimates in the broad sense (%) and variation index for score at 42 days after inoculation (DAI), area below the severity curve (AUDPCS) and area below the incidence curve (AUDPCI) in 83 passion fruit full related families, as well as the scab reaction in environments 1, 2 and joint analysis.
FV GL Mean Square
42 DAI AUDPCS AUDPCI
Environment 1
Genotypes 82 2.185** 1446138.225** 1526900.950**
Residue 164 0.206 105259.092 153634.001
VC (%) - 15.98 21.47 15.14
(%) - 90.55 92.72 89.93
- 1.78 2.06 1.72
AUDPCI 2
Genotypes 82 1.831** 2806000.029** 1679368.657**
Residue 164 0.182 91309.331 129902.324
VC (%) - 13.00 14.50 12.87
(%) - 90.07 96.74 92.26
- 1.73 3.14 1.99
Joint analysis
Genotypes 1 27.048** 42773871.295** 6832944.891**
Residue 82 3.414** 3831613.027** 2957918.284**
GxA 82 0.715** 459723.501** 325338.039**
Residue 328 0.209 101326.712 156506.166
CV (%) - 12.87 14.50 14.75
(%) - 92.26 96.74 94.70
- 1.99 3.14 1.72
TABLE 2- Original mean (MO), mean of selected families (MS) and predicted genetic gains (GS), by direct and indirect selection of 42 DAI, AUDPCS and AUDPCI traits in 83 passion fruit full related families regarding reaction to scab in environment 1, Tangará da Serra-MT, 2014.
Trait 1 Selected Families Response
42 DAI AUDPCS AUDPCI
42 DAI 44,45,46,47,51,52,53,54,55,58,60,63,67,72,73, 74,75,76,77,78,79,80,81,82,83
MO 2.84 1.510.57 2.588.68
MS 1.78 954.06 1.995.77
GS -0.95 -515.99 -533.25
GS(%) -33.58 - 34.16 -20.60
AUDPCS48,49,50,51,55,56,57,58,59,81,79,62,64,65,66, 68,73,74,75,76,77,78,80,82,83
MO 2.84 1.510.57 2.588.68
MS 2.16 650.73 1.662.88
GS -0.61 -797.25 -832.64
GS(%) -21.53 -52.78 -32.16
AUDPCI48,49,50,51,55,56,58,76,79,74,62,64,65,66,67, 68,72,73,75,77,78,80,81,82,83
MO 2.84 1.510.57 2.588.68
MS 2.13 657.47 1.650.44
GS -0.64 -791.00 -843.83
GS(%) -22.52 -52.36 -32.60 1Note at 42 days after inoculation (DAI), area below the severity curve (AUDPCS) and area below the incidence curve (AUDPCI).
TABLE 3- Original mean (MO), mean of selected families (MS) and predicted genetic gains (GS), by direct and indirect selection of 42 DAI, AUDPCS and AUDPCI traits in 83 passion fruit full related families regarding reaction to scab in environment 2, Tangará da Serra-MT, 2014.
Trait 1 Selected Families
Response
42 DAI AUDPCS AUDPCI
42 DAI 46,47,49,50,53,59,60,61,63,64,66,67,68,70,71, 72,73,75,76,77,78,79,80,81,82
MO 3.27 2.083.28 2.799.06
MS 2.23 935.92 1.897.77
GS -0.93 -1.110.02 -831.56
GS(%) -28.64 -53.28 -29.71
AUDPCS46,47,49,50,52,59,60,61,63,64,65,66,67,68,70, 71,72,73,75,77,78,79,80,81,82
MO 3.27 2.083.28 2.799.06
MS 2.23 905.32 1.837.10
GS -0.89 -1.139.62 -887.54
GS(%) -27.30 -54.70 -31.71
AUDPCI 47,49,50,52,59,60,61,63,64,65,66,67,68,69,70, 71,72,73,74,75,77,78,79,81,82
MO 3.27 2.083.28 2.799.06
MS 2.32 921.92 1.821.55
GS -0.85 -1.123.57 -901.89
GS(%) -26.19 -53.93 -32.22
TABLE 4-Original mean (MO), mean of selected families (MS) and predicted genetic gains (GS), by direct and indirect selection of 42 DAI, AUDPCS and AUDPCI traits in 83 passion fruit full related families regarding reaction to scab in environment 1 and 2, Tangará da Serra-MT, 2014.
Trait 1 Selected Families Response
42 DAI AUDPCS AUDPCI
42 DAI 46,50,51,52,53,79,60,61,62,63,64,66,67,68,71, 72,73,74,75,76,77,78,80,81,82
MO 3.04 1.790.21 2.681.92 MS 2.09 903.77 1.889.21 GS -0.89 -862.99 -750.76 GS(%) -29.24 -48.21 -27.99
AUDPCS47,48,49,50,51,58,59,61,64,65,66,67,68,70,72,7 3,74,75,76,77,78,79,80,81,82
MO 3.04 1790.21 2.681.92 MS 2.25 827.55 1.788.88 GS -0.74 -937.20 -845.78 GS(%) -24.44 -52.35 -31.54
AUDPCI 47,48,49,50,51,56,59,64,65,66,67,68,70,71,72,7 3,74,75,76,77,78,79,80,81,82
MO 3.04 1.790.21 2.681.92 MS 2.25 833.77 1.769.44 GS -0.74 -931.14 -864.20 GS(%) -24.37 -52.01 -32.22 1Note at 42 days after inoculation (DAI), area below the severity curve (AUDPCS) and area below the incidence curve (AUDPCI).
TABLE 5- Hamblin and Zimmermann (1986) coincidence index of 25 passion fruit full related families selected for environments 1, 2 and by the joint analysis, Tangará da Serra-MT, 2014.
Environment 1 Environment 2
Environment 2 75,00%
-Joint analysis 83,83% 63,63%
TABLE 6- Means of the 25 fruit full related families (FIC) selected for trait score at 42 days after inocula-tion (DAI) and resistance class *, as for the scab reacinocula-tion in environments 1, 2 and by the joint analysis, Tangará Of Serra-MT, 2014.
Environment 1 Environment 2 Joint analysis
FRF 42 DAI Class FRF 42 DAI Class FRF 42 DAI Class
46 1.22 MR 68 1.11 MR 68 1.11 MR
75 1.44 MR 66 1.44 MR 46 1.22 MR
47 1.55 MR 79 1.78 MR 66 1.44 MR
51 1.55 MR 63 1.78 MR 75 1.44 MR
52 1.66 MR 67 1.89 MR 47 1.55 MR
54 1.66 MR 82 1.99 MR 51 1.55 MR
77 1.66 MR 50 2.00 MR 52 1.66 MR
81 1.66 MR 64 2.00 MR 54 1.66 MR
79 1.67 MR 78 2.00 MR 77 1.66 MR
76 1.77 MR 77 2.11 S 81 1.66 MR
78 1.77 MR 49 2.22 S 79 1.67 MR
83 1.77 MR 75 2.22 S 76 1.77 MR
44 1.78 MR 46 2.44 S 78 1.77 MR
63 1.88 MR 47 2.44 S 83 1.77 MR
45 1.89 MR 60 2.44 S 44 1.78 MR
72 1.89 MR 70 2.44 S 79 1.78 MR
73 1.89 MR 80 2.44 S 63 1.78 MR
74 1.89 MR 72 2.55 S 45 1.89 MR
82 1.89 MR 73 2.55 S 72 1.89 MR
58 2.00 MR 53 2.55 S 73 1.89 MR
60 2.00 MR 81 2.55 S 74 1.89 MR
53 2.00 MR 76 2.66 S 67 1.89 MR
67 2.00 MR 59 2.77 S 82 1.89 MR
55 2.11 S 61 2.77 S 58 2.00 MR
80 2.11 S 71 2.77 S 64 2.00 MR
CONCLUSIONS
Heritability values were high for all traits in both environments and in the joint analysis.
The greatest gains in direct and indirect selection were obtained for the AUDPCS trait, in the individual and joint analysis of both environments.
FRF 68, 46, 66, 75, 47, 51, 52, 54 and 77 were moderately resistant, which allows their use in a breeding program aimed at scab resistance.
REFERENCES
ABREU, S. de P.M.; PEIXOTO, J.R.; JUNQUEIRA, N.T.V.; SOUZA, M.A. de F. Características físico químicas de cinco de maracujazeiro azedo cultivados no Distrito Federal. Revista Brasileira de Fruticultura, Jaboticabal, v.31, n.2, p.487-491, 2009. (1)
BATISTTI, M.; KRAUSE, W.; BARÉA, M.; ARAÚJO, D.V.; PALÚ, E.G. Resistência à verrugose de cultivares de maracujazeiro amarelo sob diferentes métodos de inoculação. Enciclopédia Biosfera, Goiânia v.9, n.16, p.2710-2720, 2013. (1)
BRUCKNER, C.H.; MELETTI, L.M.M.; OTONI, W.C.; ZERBINI JÚNIOR, F.M. Maracujazeiro. In: BRUCKNER, C.H. Melhoramento de fruteiras tropicais. (Ed.). Viçosa: UFV, 2002. p.373-410. (2)
BUENO, P.A.O.; PEIXOTO, J.R.; JUNQUEIRA, N.T.V.; MATTOS, J.K.A. Incidência e severidade de Septoriose (Septoria passiflorae SYDOW) em mudas de 48 genótipos de maracujazeiro azedo, sob casa de vegetação no Distrito Federal. Journal Bioscience, Uberlândia,v.23, n.2, p.88-95, 2007. (1)
CAMARGO, L.E.A. Manual de fitopatologia. São Paulo: Agronômica Ceres, 2005. p 663. (2)
COLATTO, U.L.D. Reação de progênies de maracujazeiro azedo à antracnose (Colletotrichum
gloeosporioides), à verrugose (Cladosporium
herbarum) e à bacteriose (Xanthomonas
axonopodispv. passiflorae). 2010. 110 f. Dissertação (Mestrado em Agronomia) - Universidade de Brasília, Brasília, 2010. (4)
CRUZ, C.D. GENES - A software package for analysis in experimental statistics and quantitative genetics. Acta Scientiarum, Maringá, v.35, n.3, p. 271-276, 2013. (1)
CRUZ, C.D.; REGAZZI, A.J.; CARNEIRO, P.C.S. Modelos biométricos aplicados ao melhoramento
genético. 4.ed. Viçosa: Editora UFV, 2012. 514p. (2)
FALEIRO, F.G.; JUNQUEIRA, N.T.V.; BELLON, G.; BORGES, T.A.; ANJOS, J.R.N.; PEIXOTO, J.R.; BRAGA, M.F.; SANTOS, D.G. Diversidade genética de espécies silvestres de maracujazeiro com resistência múltipla a doenças com base em marcadores RAPD. Fitopatologia Brasileira, Brasília, DF, v.29, p.325, 2004. (1)
FREITAS, J.P.X.; OLIVEIRA, E.J.; JESUS, O.N.; CRUZ NETO, A.J.; SANTOS, L.R. dos. Formação de população base para seleção recorrente em maracujazeiro-azedo com uso de índices de seleção.
Pesquisa Agropecuária Brasileira, Brasília, DF,
v.47, n.3, p.393-401, 2012. (1)
GONÇALVES, G.M.; VIANA, A.P.; BEZERRA NETO, F.V.; PEREIRA, M.G.; PEREIRA, T.N.S. Seleção e herdabilidade na predição de ganhos genéticos em maracujá-amarelo. Pesquisa
Agropecuária Brasileira, Brasília, DF, v.42, n.2,
p.193-198, 2007. (1)
GONÇALVES, I.M.P. Produtividade e reação de
progênies de maracujazeiro azedo a doenças em
campo e casa de vegetação. 2011. 121 f. (Dissertação
– Mestrado em Agronomia) - Universidade de Brasília, Brasília, 2011. (4)
HAMBLIN, J.; ZIMMERMAN, M. J. O. Breeding common bean for yield mixtures. Plant Breeding Reviews, New York, v.4, p.245-272, 1986. (1)
IBGE. Indicadores da produção agrícola municipal. Disponível em: <http://www.ibge.gov. br >. Acesso em: 12 set. 2014. (5)
JUNQUEIRA, N.T.V.; ANJOS, J.R.N.; SILVA. A.P.O.; CHAVES, R.C.; GOMES, A.C. Reação às doenças e produtividade de onze cultivares de maracujá-azedo cultivadas sem agrotóxico. Pesquisa
Agropecuária Brasileira, Brasília, DF, v.38, n.8,
JUNQUEIRA, N.T.V.; BRAGA, M.F. Maracujá: germoplasma e melhoramento genético. Brasília, DF: Embrapa Cerrados, 2005. p 187. (2)
MCKINNEY, R.H. Influence of soi ltemperature
and moisture on infection of wheat seed lings by Helminthosporium sativum. Journal of Agricultural
Research, Washington, v.6, n.3, p.195-218, 1923. (1)
MELETTI, L.M. Avanços na fruticultura tropical no Brasil. Revista Brasileira de Fruticultura, Jaboticabal, v.33, n.1, p.73-91, 2011. (1)
MISSIO, R.F.; DIAS, L.A.S.; MORAES, M.L.T.; RESENDE, M.D.V. Selectionof Pinus caribaea var. bahamensis progenies based on the predicted genetic value. Crop Breeding and Applied Biotechnology, Viçosa, MG, v.4, n.4, p.399-407, 2004. (1)
MORAES, M.C.; GERALDI, I.O.; MATTA, F.P.; VIEIRA, M.L.C. Genetic and phenotypic parameter estimates for yield and fruit quality traits from a single wide cross in yellow passion fruit. HortScience, Dordrecht, v.40, n.7, p.1978-1981, 2005. (1)
NEGREIROS, J.R. S.; BRUCKNER, C.H.; CRUZ, C.D.; SIQUEIRA, D.L.; PIMENTEL, L.D. Seleção de progênies de maracujazeiro-azedo vigorosas e resistentes à verrugose (Cladosporium cladosporioides). Revista Brasileira Fruticultura, Jaboticabal, v.26, n.2, p.272-275, 2004. (1)
PETERNELLI, L.A.; SOUZA, E.F.M. de; BARBOSA, PEREIRA, M.H. Delineamentos aumentados no melhoramento de plantas em condições de restrições de recursos. Ciência Rural, Santa Maria, v.39, n.9, p.2425-2430, 2009. (1)
SANTOS, C.E.M.; PISSIONI, L.L.M.; MORGADO, M.A.D.; CRUZ, C.D.; BRUCKNER, C.H. Estratégias de seleção em progênies de maracujazeiro azedo quanto ao vigor e incidência de verrugose. Revista Brasileira de Fruticultura, Jaboticabal, v.30, n.2, p.444-449, 2008.(1)
VIANA, A.; GONÇALVES, G. M. Genética quantitativa aplicada ao melhoramento genético do maracujazeiro. In: FALEIRO, F. G.; JUNQUEIRA, N. T. V.; BRAGA, M. F. Maracujá germoplasma
e melhoramento genético. Brasília: Embrapa