CPD
5, 879–910, 2009Climate over Greenland and Baffin
Island
B. Fr ´echette and A. de Vernal
Title Page
Abstract Introduction
Conclusions References
Tables Figures
◭ ◮
◭ ◮
Back Close
Full Screen / Esc
Printer-friendly Version
Interactive Discussion Clim. Past Discuss., 5, 879–910, 2009
www.clim-past-discuss.net/5/879/2009/
© Author(s) 2009. This work is distributed under the Creative Commons Attribution 3.0 License.
Climate of the Past Discussions
Climate of the Past Discussionsis the access reviewed discussion forum ofClimate of the Past
Relationship between Holocene climate
variations over southern Greenland and
eastern Ba
ffi
n Island and synoptic
circulation pattern
B. Fr ´echette and A. de Vernal
GEOTOP, Universit ´e du Qu ´ebec `a Montr ´eal, C.P. 8888, Succursale centre-ville, Montr ´eal, Qu ´ebec, H3C 3P8, Canada
Received: 20 February 2009 – Accepted: 23 February 2009 – Published: 10 March 2009
Correspondence to: B. Fr ´echette ([email protected])
CPD
5, 879–910, 2009Climate over Greenland and Baffin
Island
B. Fr ´echette and A. de Vernal
Title Page
Abstract Introduction
Conclusions References
Tables Figures
◭ ◮
◭ ◮
Back Close
Full Screen / Esc
Printer-friendly Version
Interactive Discussion
Abstract
Lake pollen records from southwest Greenland and eastern Baffin Island show strong
regionalism in climate trends of the last 7000 years. Air temperature reconstructions from pollen indicate larger amplitude cooling in southwest Greenland (>3.0◦C) than in eastern Baffin Island (<1.0◦C). Such west-east gradient in climate change is consistent
5
with paleoceanographical data that indicate decreasing temperature and/or strength of the North Atlantic Current to the east during the Holocene while the eastern Canadian margins under the Labrador Current influence display slight warming. Complementary to air and sea temperature records, the lake pollen data led to reconstruct increased cloudiness in southern Greenland, which points to increasing cyclonic activity since
10
7000 years west of Greenland. Together, the terrestrial and marine records of the
northwest North Atlantic therefore suggest a shift from a dominant NAO+during the
early-mid Holocene to dominant NAO- in the late Holocene.
1 Introduction
Present-day climate conditions across the subpolar North Atlantic are by no means
15
uniform or zonal, and regional scale differences need to be taken into account in
pa-leoclimate studies and for climate modelling (e.g., Wohlfahrt et al., 2004; Renssen et al., 2005). Over the past few years, paleoecological studies at high latitudes of the Northern Hemisphere have reported a strong regionalism in both terrestrial climate and sea-surface conditions of the oceans (Marchal et al., 2002; Kaufman et al., 2004;
20
Moros et al., 2004; de Vernal and Hillaire-Marcel, 2006). In particular, the northern North Atlantic has been marked by much larger cooling in surface water to the east than to the west from the early to late Holocene (Marchal et al., 2002; Moros et al., 2004; Andersen et al., 2004). In addition, variations in sea-surface salinity and sea-ice
cover along the continental margin offCanada and strengthening of deep water
forma-25
CPD
5, 879–910, 2009Climate over Greenland and Baffin
Island
B. Fr ´echette and A. de Vernal
Title Page
Abstract Introduction
Conclusions References
Tables Figures
◭ ◮
◭ ◮
Back Close
Full Screen / Esc
Printer-friendly Version
Interactive Discussion thermohaline conditions and circulation pattern (de Vernal and Hillaire-Marcel, 2006).
However, our understanding of the climate dynamics at high latitudes remains fragmen-tary because most paleoclimate studies report on surface ocean or air temperatures with little indication on seasonality or other climate parameters such as precipitation, wind patterns, moisture and cloud cover. The present study addresses the question of
5
linkages between terrestrial climate and ocean records in the subpolar North Atlantic during the Holocene, with special attention paid to the climate parameters such as cloudiness in addition to surface air and ocean temperature, allowing interpretations in terms of large-scale circulation pattern involving the North Atlantic Oscillation (NAO) (Hurrell, 1995).
10
We use palynological data from marine and lacustrine cores collected in the
north-west North Atlantic and adjacent lands (east Baffin Island and southwest Greenland)
to derive climate records spanning about 8000 years (Fig. 1). The coring sites are lo-cated in the trajectory of surface ocean currents that play a major role in northward heat fluxes, the North Atlantic Current (NAC) and its westward branch making the west
15
Greenland Current (WGC) and southward Arctic water flow through the Baffin Land
Current (BLC) and the Labrador Current (LC). The core sites are well located to doc-ument synoptic scale changes, notably with regard to the trajectory of North Atlantic storm tracks in the Labrador Sea, which ends in south Greenland (Chen et al., 1997; Tsukernik et al., 2007). They are also suitably located to document NAO. Positive NAO
20
is characterized by reduced strength and frequency of cyclonic activity in the Labrador Sea (Serreze et al., 1997), which results in overall cloudiness decrease over much of the North Atlantic, west of Greenland, whereas negative NAO rather results in cloudi-ness increase (Previdi and Veron, 2007).
2 Study area
25
The studied lakes are located on eastern Baffin Island (Akvaqiak Lake [AKV]; 66◦47′N,
CPD
5, 879–910, 2009Climate over Greenland and Baffin
Island
B. Fr ´echette and A. de Vernal
Title Page
Abstract Introduction
Conclusions References
Tables Figures
◭ ◮
◭ ◮
Back Close
Full Screen / Esc
Printer-friendly Version
Interactive Discussion 47◦45′W; 7 m a.s.l.) (Fig. 1). The climate conditions at the two sites are contrasted,
es-pecially in winter. The present-day July and January air temperatures average respec-tively 4.9◦C and
−24.1◦C on eastern Baffin Island and 8.4◦C and−6.2◦C in southwest Greenland (Cappelen et al., 2001; Environment Canada, 2004). The milder climate of southern Greenland is related to the influence of the WGC, whereas the outflow
5
of Arctic waters through the BLC results in cold winter conditions on eastern Baffin
Island. Sunshine (inversely proportional to cloud cover) during the growing season of the vegetation (June–September) averages 37% and 32% respectively on eastern
Baffin Island and in southwest Greenland (New et al., 2002; Whitmore et al., 2005).
Sunshine is lower in southwest Greenland than eastern Baffin Island notably because
10
south Greenland is located along a primary North Atlantic cyclone track, which is en-hanced by the proximity of relatively warm ocean surface current (WGC) to the Green-land ice sheet (Chen et al., 1997; Tsukernik et al., 2007). Despite contrasting climate, the local vegetation of these sites is comparable. Vegetation is moderately lush shrub tundra dominated by shrub birch (Betula) and heaths (Ericales). Shrub alder (Alnus) is
15
absent from the Baffin Island vegetation but is regionally common in southwest
Green-land (61◦–66◦N) (e.g., Fredskild, 1996). The modern pollen flux is of the order of
500 grains/cm2/yr at Qipisarqo and of the order of 90 grains/cm2/yr at Akvaqiak. Pollen
assemblages are dominated byBetulabutAlnusand herb pollen grains record higher
percentages at Qipisarqo.
20
The studied marine cores were collected on the continental slope of the Canadian margin, at the vicinity of the center of Labrador Sea Water (LSW) formation (Core
HU-84-030-021TWC [HU021]; 58◦22.06′N, 57◦30.42′W; water depth=2853 m), and in
the area of the Charlie Gibbs Fracture Zone in the central part of the North Atlantic
(Core HU-91-045-085TWC [HU085]; 53◦58.51′N, 38◦38.25′W; water depth=3603 m)
25
(Fig. 1). The core HU021 is located close to a front between the LC and the WGC.
Modern mean sea-surface temperature (SST) and salinity (SSS) are 6.7◦C and 34.3
in summer and 3.4◦C and 34.8 in winter, respectively, and sea-ice cover develops for
CPD
5, 879–910, 2009Climate over Greenland and Baffin
Island
B. Fr ´echette and A. de Vernal
Title Page
Abstract Introduction
Conclusions References
Tables Figures
◭ ◮
◭ ◮
Back Close
Full Screen / Esc
Printer-friendly Version
Interactive Discussion
of the warm NAC, where SSTs are 10.3◦C and 5.3◦C in summer and winter respectively
and where SSS ranges 34.5 to 34.8 (NODC, 2001).
3 Methods
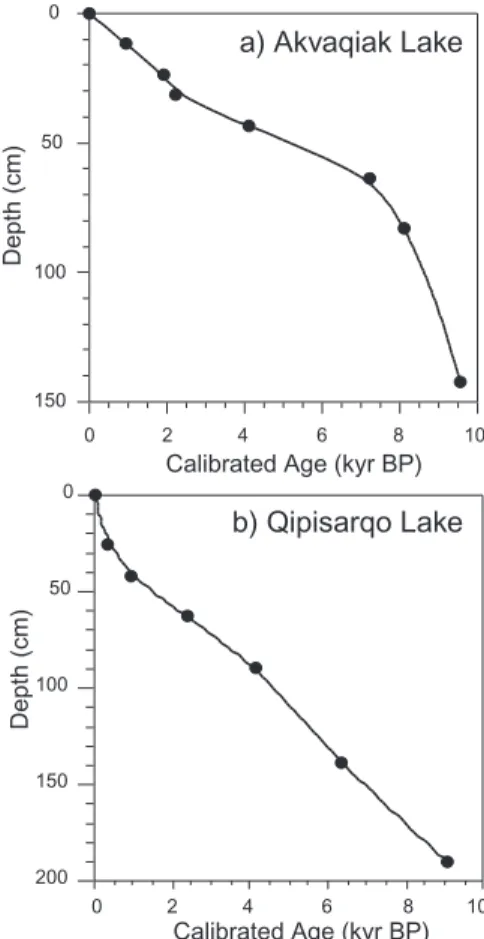
3.1 Lacustrine sediment cores chronology and pollen analysis
Akvaqiak (98BIR-02, 98BIR-G01) and Qipisarqo (98QIP-02, 98QIP-G01) lake cores
5
were collected in May 1998 from the frozen lake surface. Qipisarqo Lake sedimen-tology is thoroughly discusssed in Kaplan et al. (2002). At the two lakes, piston and gravity (Glew) cores were used for the establishment of composite records, in which the Glew cores provide the upper part of the sedimentary sequences. The chronology of the Akavqiak Lake record is based on seven accelerator mass spectrometry (AMS)
10
14
C dates on bryophyte macrofossils and humic acid extracts (Table 1). The chronology
of the Qipisarqo Lake record is based on six AMS-14C dates on bryophyte macrofossils
and humic acid extracts (see Kaplan et al., 2002) (Table 1). Paired macrofossil and hu-mic acid dates have been obtained at three levels in the Akvaqiak Lake core and one level in the Qipisarqo Lake core, producing humic acid ages that are older than adjacent
15
macrofossils. This has led to age correction of 537 and 230 years for humid acid dates in Akvaqiak and Qipisarqo lakes, respectively. All corrected (humic acid) and uncor-rected (bryophyte) dates have been calibrated to calendar years using the CALIB pro-gram (version 5.0.2) (Stuiver and Reimer, 1993) updated with the Intcal04c14 dataset (Reimer et al., 2004). Age models were then derived from smoothed linear
interpola-20
tion between calibrated ages (Fig. 2). For the last 8000 years, sediment accumulation
rates average 11.35±4.41 cm/ka at Akavaqiak Lake and 26.77±16.84 cm/ka at
Qipis-arqo Lake.
Standard pollen preparation techniques, including dispersion with KOH, digestion with HF and HCl, and acetolysis (Faegri and Iversen, 1975), were applied to 1.0 or
25
CPD
5, 879–910, 2009Climate over Greenland and Baffin
Island
B. Fr ´echette and A. de Vernal
Title Page
Abstract Introduction
Conclusions References
Tables Figures
◭ ◮
◭ ◮
Back Close
Full Screen / Esc
Printer-friendly Version
Interactive Discussion taxonomic keys of Richard (1970), McAndrews et al. (1973) and Moore et al. (1991), as
well as reference to modern collection archived at the Laboratoire Jacques-Rousseau, Universit ´e de Montr ´eal. Palynological analyses performed at 3 to 5 cm interval yield a centennial resolution, which permits to identify long term trend. For consistency, the pollen sum used for computing relative frequencies from the fossil assemblages
5
includes only the 39 pollen types contained in the modern database (cf. Table 1 in
Fr ´echette et al., 2008a). The pollen sums average 555±48 grains for Akvaqiak lake,
and 516±44 grains for Qipisarqo lake.
3.2 Marine sediment cores chronology and dinocyst analysis
Cores HU021 and HU085 were collected during expeditions of the CSS-Hudson. The
10
chronology was established on the basis of AMS14C dates on planktic foraminifera.
For core HU021 three dates are available and for core HU085 two dates are available.
The conventional14C ages have been calibrated into calendar years using the CALIB
Rev 5.0.1 program (Stuiver and Reimer, 1993) and the marine calibration dataset (Ma-rine04.14C) of Hughen et al. (2004). The marine calibration was made with a global
15
ocean reservoir correction of 400 years, but no further correction of reservoir age (delta
R) was applied to account for local effects. The age models were established from
linear interpolation between calibrated ages. For the last 8000 years, sediment accu-mulation rates average 17.6 cm/ka in core HU021 and 6.2 cm/ka in core HU085.
Palynological preparation for the analyses of dinocysts were made following
stan-20
dardized laboratory procedure that include sieving at 10µm to eliminate fine silt and
clays, in addition to repeated HCl (10%) and HF (52%) treatments to dissolve carbon-ate and silica particles. No oxidation treatment was done. Palynological analyses per-formed at 1 to 2 cm interval yield a centennial resolution. For consistency, the dinocyst sum used for computing relative frequencies from the fossil assemblages includes only
25
the 60 dinocyst taxa of the modern database (cf. Table 1 in de Vernal et al., 2005). The
CPD
5, 879–910, 2009Climate over Greenland and Baffin
Island
B. Fr ´echette and A. de Vernal
Title Page
Abstract Introduction
Conclusions References
Tables Figures
◭ ◮
◭ ◮
Back Close
Full Screen / Esc
Printer-friendly Version
Interactive Discussion
3.3 Principal component analysis
Detrended correspondence analysis (DCA) was first used to estimate the composi-tional gradient lenghts along the first few DCA axes in the lacustrine and marine records (Gauch, 1982; ter Braak and Prentice, 1988; Birks, 1995). For DCA calculations we used the pollen types and the dinoflagellates cysts selected for the quantitative
cli-5
mate and hydrographic reconstructions. Among the 39 pollen types, 25 were present at Akvaqiak Lake and 31 at Qipisarqo Lake. Among the 60 dinocyst taxa, 25 were recorded in core HU021 and 21 in core HU085. The length of gradient of DCA axis 1 is 0.87 and 1.01 SD (standard deviation) units for Akvaqiak and Qipisarqo lakes, respec-tively, and 1.09 and 1.41 SD units for cores HU021 and HU085, respecrespec-tively, which
10
indicates linear responses of both pollen and dinocysts to the underlying environmen-tal gradient. Therefore, linear ordination (Principal Component Analysis) was applied. Principal Component Analysis (PCA) was used to detect the major gradient among the fossil pollen and dinocyst spectra. Because the variables are dimensionally homoge-neous, a dispersion (variance/covariance) matrix was used (Birks, 1995; Legendre and
15
Legendre, 1998). The number of pollen and dinocysts was lowered. We selected taxa with a value greater-than or equal to 1% in at least one sample and created a collective
category among the pollen types (Picea+Pinus). This selection resulted in 10 pollen
types for Akvaqiak Lake, 17 pollen types for Qipisarqo Lake, 15 dinocyst types for core HU021 and 17 dinocyst types for core HU085. For PCA, as for the quantitative
20
climate and hydrographic reconstructions, the relative frequencies (in percent) of the pollen types was square-root transformed and the relative frequencies (in per mil) of dinocysts was logarithmic transformed. These transformations were done in order to optimize the signal-to-noise ration and stabilize the variances. DCA was implemented
with CANOCO version 4.0 (ter Braak and ˇSmilauer, 1998) with rare taxa not
down-25
CPD
5, 879–910, 2009Climate over Greenland and Baffin
Island
B. Fr ´echette and A. de Vernal
Title Page
Abstract Introduction
Conclusions References
Tables Figures
◭ ◮
◭ ◮
Back Close
Full Screen / Esc
Printer-friendly Version
Interactive Discussion http://www.clim-past-discuss.net/5/879/2009/cpd-5-879-2009-supplement.pdf.
3.4 Continental climate reconstruction
Continental climate reconstruction were made from the Modern Analogue Technique (MAT) using a modern database of 828 sites from lakes of the Boreal, Subarctic and
Arctic biomes of North America (north of 50◦N) and Greenland. The surface air
tem-5
perature (SAT), sunshine (S) and precipitation (P) (Whitmore et al., 2005; Fr ´echette et al., 2008a) were calculated from the Climatic Research Unit (CRU) gridded climatology using 1961–1990 climatological averages (New et al., 2002) and interpolated to each 828 pollen sites via lapse-rate collected bilinear interpolation. Whitmore et al. (2005) describe in full the method used to estimate modern climate. The gridded sunshine
10
data provided by New et al. (2002) are expressed as percent of possible bright sun-shine and were derived from sunsun-shine averages at given stations or from conversion of cloud cover to sunshine. Modern climate parameters at Akvaqiak and Qipisarqo lakes were estimated in the same way.
The pollen data include the 39 most common vascular taxa (18 woody plants and
15
21 herbs). The reconstructions based on MAT followed the procedure described in detail by Fr ´echette et al. (2008a). Similarity between fossil and modern pollen assem-blages is based on the squared chord distance (SCD) dissimilarity metric (Birks, 1977; Prentice, 1980; Overpeck et al., 1985; Gavin et al., 2003), which is an euclidean dis-tance calculated on the square-root transformed pollen types abundances expressed
20
in percent. Values of SCD vary between zero and 200, with larger values indicating larger dissimilarity. The adopted SCD threshold for the present study is 26. The cli-mate esticli-mates are calculated from the 5 best modern analogues.
Reconstructions of the July (warmest month) SAT and growing season
(June-September=JJAS) sunshine were performed with the 3Pbase software (Guiot and
25
es-CPD
5, 879–910, 2009Climate over Greenland and Baffin
Island
B. Fr ´echette and A. de Vernal
Title Page
Abstract Introduction
Conclusions References
Tables Figures
◭ ◮
◭ ◮
Back Close
Full Screen / Esc
Printer-friendly Version
Interactive Discussion timate of the mean predictive error (and hence power) of the fitted surface. At the scale
of North America and Greenland (20◦–85◦N, 20◦–180◦W), the RTGVC of July SAT is
of 0.7◦C and the RTGVC of summer sunshine is 4.5% (New et al., 1999, 2002). The
accuracy of the interpolated monthly sunshine at high northern latitudes is influenced by the effect of low sun angles on the amount of bright sunshine recorded (New et al.,
5
1999). Therefore, it is important to look at the station networks and cross-validation statistics for assessing the accuracy of the interpolation in the study region (New et al., 2002). At Akvaqiak and Qipisarqo lakes, July SAT is 6.2±1.0◦C and 9.0±1.1◦C respectively (Cappelen et al., 2001; Environment Canada, 2004), and JJAS sunshine is 39.6±5.8% and 33.2±1.9% respectively (New et al., 2002; Whitmore et al., 2005).
10
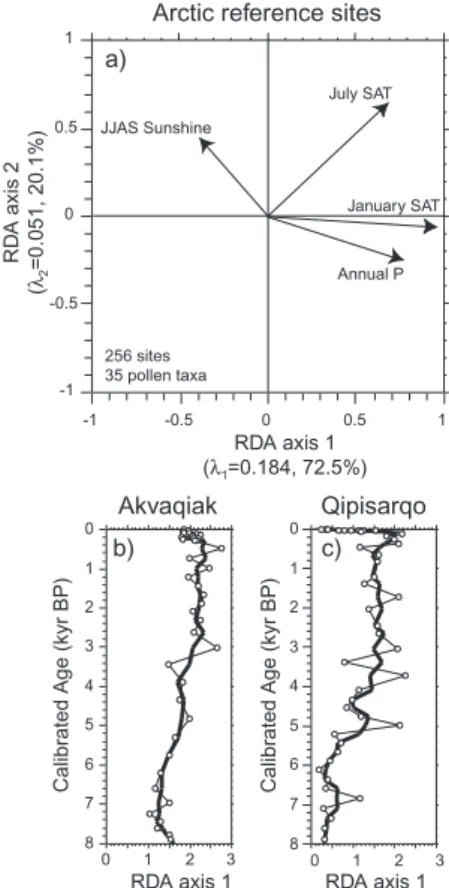
Redundancy Analysis (RDA) was used to estimate long term trend in winter SAT and
annual precipitation. RDA ordination of the Arctic reference sites (n=256, 35 pollen
types, 4 climate variables: July and January SAT, annual precipitation, JJAS sunshine)
demonstrates that the first RDA axis (λ1=0.184; 18.4% of the total variance in the
pollen data alone, and 62.5% of variance in the weighted-averages of the pollen taxa
15
constrained to climate variables) positively correlates with January SAT (r=0.79) and annual precipitation (r=0.63) (cf., Fig. 5a). In the Arctic, these two climate parame-ters are strongly correlated together (r=0.86). Fossil pollen assemblages of Akvaqiak and Qipisarqo lakes were projected passively onto the ordination space, without in-fluencing the RDA analysis in any other way. Therefore, the scores of Akavaqik and
20
Qipisarqo spectra projected on RDA axis 1 of the Arctic-site modern assemblages allow semi-quantitative estimates of January SAT. For RDA ordination the frequencies of the 35 pollen types were square-root transformed and rare taxa were not down-weighted.
RDA was performed with CANOCO version 4.0 (ter Braak and ˇSmilauer, 1998).
Infor-mations on RDA results (first three eigenvalues, % variance and loadings) and
corre-25
CPD
5, 879–910, 2009Climate over Greenland and Baffin
Island
B. Fr ´echette and A. de Vernal
Title Page
Abstract Introduction
Conclusions References
Tables Figures
◭ ◮
◭ ◮
Back Close
Full Screen / Esc
Printer-friendly Version
Interactive Discussion
3.5 Hydrographic reconstruction
Quantitative reconstruction of past sea-surface conditions is based on MAT applied to dinocyst assemblages. The reference database includes 60 taxa and 1054 refer-ence sites from mid- to high latitude North Atlantic, North Pacific and Arctic oceans, and adjacent sub-polar seas (de Vernal and Hillaire-Marcel, 2006). The dissimilarity
5
metric used is the euclidean distance calculated on neperian logarithmic transformed dinocysts abundance, expressed in per mil (de Vernal et al., 2001; 2005). Unlike the SCD used with the pollen database, the dissimilarity metric used with the dinocyst database has no upper limit. The adopted dissimilarity threshold for the present study is 74. The hydrographic values were estimated from the 5 best modern analogues.
10
Reconstruction of the August (warmest month) sea-surface temperature (SST) was performed with the 3Pbase software (Guiot and Goeury, 1996). The error of pre-diction (RMSE) for August SST is estimated to ±1.7◦C. It is of note that this error is close to the actual standard deviation around the mean for the summer temperature,
which averages±1.6◦C in the modern hydrographical database (NODC, 2001).
Rel-15
atively close analogues for dinocyst assemblages exist in the modern database, with distances lower than 44 and 78 for cores HU021 and HU085, respectively. At sites
HU021 and HU085, August SST is 6.7±0.9◦C and 10.6±0.8◦C respectively (NODC,
2001).
4 Results
20
4.1 Lacustrine sediment cores
The diagram of pollen assemblages of Akvaqiak and Qipisarqo cores is
given in supplementary Fig. 1 http://www.clim-past-discuss.net/5/879/2009/
cpd-5-879-2009-supplement.pdf. The mid to late Holocene pollen influxes are
of the order of 450 grains/cm2/yr at Qipisarqo and 150 grains/cm2/yr at Akvaqiak.
CPD
5, 879–910, 2009Climate over Greenland and Baffin
Island
B. Fr ´echette and A. de Vernal
Title Page
Abstract Introduction
Conclusions References
Tables Figures
◭ ◮
◭ ◮
Back Close
Full Screen / Esc
Printer-friendly Version
Interactive Discussion
At both sites, the mid-late Holocene pollen assemblages are dominated by Betula
and Ericales and are characterized by the increase of Betula onwards. However,
discrepancies exist regarding Alnus and pollen grains of coniferous trees (Picea
and Pinus). These taxa are best represented at Qipisarqo Lake and are related to long-distance transport (e.g., Rousseau et al., 2008). The present local vegetation
5
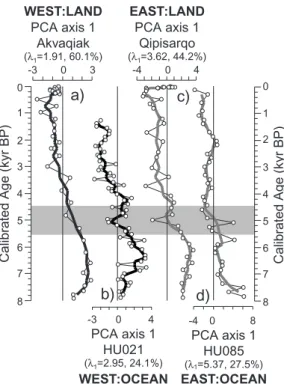
of these sites is comparable and the similarity is well expressed in their respective modern pollen assemblages. The SCD between the uppermost pollen assemblage of Akvaqiak and Qipisarqo lacustrine sequences is 14 (or 0.14), which indicates that they are indeed very similar to each other (cf. Overpeck et al., 1985; Anderson et al., 1989). PCA performed on pollen assemblages show strong linear trends since 8000 years
10
(Fig. 3a, c). The first eigenvalue (λ1) of the eastern site (Qipisarqo) is two times higher than that of western site (Akvaqiak), which indicates much higher amplitude changes
in pollen assemblages in southwest Greenland than in eastern Baffin Island. At both
sites, low PCA axis 1 sample scores are driven byBetulaand Ericales, two erect dwarf
shrubs, whereas high PCA axis 1 sample scores are driven by Cyperaceae at Akvaqiak
15
and Alnus at Qipisarqo (supplementary Tables 2a, 2b) http://www.clim-past-discuss. net/5/879/2009/cpd-5-879-2009-supplement.pdf. At Akvaqiak and Qipisarqo, there is a pronounced change at about 5000 years BP. The change is gradual at Akvaqiak, whereas it appears more abrupt at Qipisarqo.
Close analogues for the fossil pollen assemblages exist in the modern database,
20
with SCD values lower than 11 and 18 for Akavqiak and Qipisarqo lakes, respectively. At both sites, July SAT was maximum before 5000 years BP. However, the subsequent cooling trend is more pronounced at the eastern site (Qipisarqo) than at the western
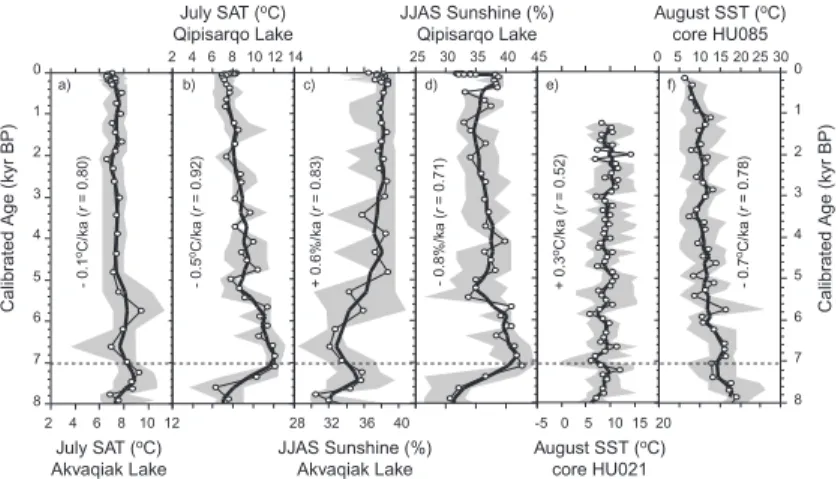
site (Akvaqiak). From 7000 years BP to present, July SAT decreased by 0.5◦C/ka at
Qipisarqo and by 0.1◦C/ka at Akvaqiak (Fig. 4a, b). Conversely, contrasting trends in
25
the mid-late Holocene growing season sunshine are observed. From 7000 years BP
to present, growing season sunshine increased at Akavaqiak (+0.6%/ka), whereas it
decreased at Qipisarqo (−0.8%/ka) (Fig. 4c, d).
CPD
5, 879–910, 2009Climate over Greenland and Baffin
Island
B. Fr ´echette and A. de Vernal
Title Page
Abstract Introduction
Conclusions References
Tables Figures
◭ ◮
◭ ◮
Back Close
Full Screen / Esc
Printer-friendly Version
Interactive Discussion (Fig. 5b, c). First RDA axis is positively correlated with January SAT and annual
pre-cipitation (Fig. 5a). This increasing trend can thus be translated by a slight winter
warming and higher precipitation. Betula has the highest species score on the first
RDA axis on Arctic reference sites (supplementary Table 3) and in both lake
sedi-ment cores, there is an increase inBetula frequencies onward (supplementary Fig. 1)
5
http://www.clim-past-discuss.net/5/879/2009/cpd-5-879-2009-supplement.pdf. Warm
winter and high depth of snow cover are likely critical to the survival of Betula (cf.
Fredskild, 1991).
4.2 Marine sediment cores
The diagram of dinocyst assemblages of cores HU021 and HU085 is
10
given in supplementary Fig. 2 http://www.clim-past-discuss.net/5/879/2009/
cpd-5-879-2009-supplement.pdf. In cores HU021 and HU085, the dinocyst fluxes are of the order of 50 000 and 2000 cysts/cm2/ka, respectively, which indicate a relatively high productivity at both sites. In core HU021, the assemblages are characterized by
the increase ofNematosphaeropsis labyrinthus and temperate taxa from the early to
15
late Holocene. In core HU085, the dinocyst assemblages are dominated by temperate
taxa and characterized by maximum of thermophilic species (Spiniferites mirabilis,
Impagidiniumspp.) in the early Holocene. These dinocyst assemblages are consistent
with the more temperate conditions in the axis of the NAC than off the Canadian
margins (de Vernal and Hillaire-Marcel, 2006).
20
PCA performed on dinocyst assemblages show strong linear trends since 8000 years
(Fig. 3b, d). The first eigenvalue (λ1) of the eastern site (HU085) is two times
higher than that of the western sites (HU021), which indicate much larger ampli-tude in the changes of dinocyst assemblages in central North Atlantic than along the Canadian margin. High PCA axis 1 sample scores are driven by the subpolar
25
taxon Spiniferites elongatus in core HU021, whereas they are notably driven by the
thermophilic species Spiniferites mirabilis in core HU085 (supplementary Tables 2c,
CPD
5, 879–910, 2009Climate over Greenland and Baffin
Island
B. Fr ´echette and A. de Vernal
Title Page
Abstract Introduction
Conclusions References
Tables Figures
◭ ◮
◭ ◮
Back Close
Full Screen / Esc
Printer-friendly Version
Interactive Discussion is was observed from the continental records, there is a pronounced change at about
5000 years BP. Again, the change seems gradual at the western site (HU021), whereas it appears more abrupt at the eastern site (HU085).
Good modern analogues of dinocyst assemblages exist in the modern database, with dissimilarity values lower than 44 and 78 for assemblages of cores HU021 and
5
HU085, respectively. However, the dissimilarity values of most samples are respec-tively lower than 23 and 47 in cores HU021 and HU085 which is much lower than the adopted threshold of 74. August SST was maximum before 5000 years BP at the east-ern site (HU085), whereas no trend is observed at the westeast-ern site (HU021). From
7000 years BP to present, August SST decreased by 0.7◦C/ka at site HU085, whereas
10
a slight warming of 0.3◦C/ka is observed at site HU021 (Fig. 4e, f).
5 Discussion
5.1 Mid-Holocene alder occurrence in southwest Greenland
A feature deserving attention from the pollen record of Qipisarqo is the early occur-rence ofAlnus crispa, which raised the question of the timing of its migration in
south-15
west Greenland during the Holocene. At present, Alnus crispa has its main area of
distribution between 63◦ and 66◦N in west Greenland, with isolated populations
grow-ing as far south as 61◦N (Fredskild, 1973, 1996). Although it is regionally commun at
61◦N, shrub alder is not present today on the Qipisarqo foreland presumably due to
the glacier’s proximity (less than 2 km) (Kaplan et al., 2002).
20
In the literature, there is a debate regardingAlnusmigration in Greenland. Based on
pollen studies from southwest Greenland, around 62◦N, Kelly and Funder (1974)
pro-posed an early migration of alder at about 750014C years BP, i.e. ca. 8400 cal. years
BP (Figs. 6, 7e). However, Fredskild (1973, 1983, 1985) suggested thatAlnus rather
migrated in west Greenland (64◦N) during the late Holocene (ca. 3500–4000 14C
25
CPD
5, 879–910, 2009Climate over Greenland and Baffin
Island
B. Fr ´echette and A. de Vernal
Title Page
Abstract Introduction
Conclusions References
Tables Figures
◭ ◮
◭ ◮
Back Close
Full Screen / Esc
Printer-friendly Version
Interactive Discussion
(Fig. 7g, h, i) and that all Alnus pollen grains accumulated in Holocene sediment
were related to long distance transport and carried mainly from Newfounland and
Labrador. At lake Qipisaqo, Alnus pollen relative frequency and fluxes increase at
about 8400 cal. years BP to reach maximum values between 6500 and 500014C BP,
i.e. 7400 and 5600 cal. years BP (Fig. 7f).
5
As shown in Fig. 7, which summarize available records of pollen influxes over
south-western Greenland during the Holocene, large variations inAlnusfrequency from site
to site are observed. This may be due to the mosaic character of the local vegetation. Nevertheless, the records strongly suggest time transgressive migration from about 700014C years BP in the south (site Iso ¨etes, 59.58◦N) to about 350014C years BP in
10
the north (site Johs. Iversen, 64.24◦N).
5.2 West to east gradient
At all sites there is a pronounced palynological change around the mid-late Holocene transition, at about 5000 years BP (Fig. 3). The change seems abrupt in the dinocyst and pollen records of eastern sites (HU085 and Qipisarqo), whereas it appears more
15
gradual westward (HU021 and Akvaqiak). An abrupt mid to late Holocene transition has been also reported from coccolith and dinocyst data in marine cores from the central North Atlantic, south of Iceland (Giraudeau et al., 2000) and on the northern Iceland shelf (Solignac et al., 2006). It seems therefore to be a robust feature in the regional and global climate (e.g., Steig, 1999).
20
The records of Akvaqiak and Qipisarqo lakes show a progressive decrease in July
SAT since 7000 years BP. However, the cooling at Qipisarqo is about 3.5◦C, which is
much larger than at Akvaqiak, where it does not exceed 1◦C (Fig. 8a). Similarly, the
marine records show a progressive decrease in August SST of about 5◦C in the central
North Atlantic site (HU085), whereas no significant trend is observed at the Canadian
25
CPD
5, 879–910, 2009Climate over Greenland and Baffin
Island
B. Fr ´echette and A. de Vernal
Title Page
Abstract Introduction
Conclusions References
Tables Figures
◭ ◮
◭ ◮
Back Close
Full Screen / Esc
Printer-friendly Version
Interactive Discussion The opposition between the eastern and western sites is also seen in the growing
season sunshine reconstruction from pollen data. The record of Akvaqiak Lake shows a slight increase since 7000 years, whereas a progressive decrease is reconstructed at Qipisarqo Lake (Fig. 8c). Independent evidence for changes in growing season
sunshine comes from pollen fluxes (grains/cm2/yr), which relate to pollen production
5
and positively correlate with meteorological factors such as daily thermal oscillation,
maximum and minimum temperatures and sunshine hours (cf. Rodr´ıguez-Rajo et al.,
2005). Since 7000 years, pollen fluxes have decreased at Qipisarqo while they display an increase at Akvaqiak (Fig. 8d), thus supporting the growing season sunshine recon-struction based on transfer functions. The trend in pollen fluxes provides an illustration
10
of the response of Arctic plants to changes in climate parameters such as sunshine (Fr ´echette et al., 2008b).
6 Conclusions
Our reconstructions show summer cooling trend since 7000 years particularly pro-nounced in southern Greenland. They also indicate a slight winter warming from the
15
mid to late Holocene (Fig. 8e), which suggests a decrease in the seasonal contrast of temperatures from winter to summer. Such an interpretation in terms of seasonality that applies to both terrestrial and marine environments is supported by paleoecolog-ical data from Scandinavia (e.g., Hammarlund et al., 2002) and paleoceanographic records from the northern North Atlantic (de Vernal and Hillaire-Marcel, 2006; Solignac
20
et al., 2006). It appears consistent with mid-late Holocene summer vs. winter insolation changes (Fig. 8f) (Berger and Loutre, 1991).
The mid to late Holocene insolation change certainly accounts for a large part in the cooling recorded and the decreasing winter to summer contrast of temperature. How-ever, the amplitude of the cooling is much smaller in the western North Atlantic than
25
CPD
5, 879–910, 2009Climate over Greenland and Baffin
Island
B. Fr ´echette and A. de Vernal
Title Page
Abstract Introduction
Conclusions References
Tables Figures
◭ ◮
◭ ◮
Back Close
Full Screen / Esc
Printer-friendly Version
Interactive Discussion may have been related to stronger and/or warmer NAC which resulted in enhanced
poleward heat fluxes in eastern North Atlantic and Nordic Seas (e.g., Duplessy et al., 2001; Birks and Koc¸, 2002). Conversely, high freshwater and meltwater export from the Arctic through BLC and LC may have maintained cold conditions along the con-tinental margins of the western North Atlantic during the early and middle Holocene
5
despite higher insolation (e.g., de Vernal and Hillaire-Marcel, 2006). An accelerated hydrographical cycle with higher northward flux of warm Atlantic waters to the east and higher southward export of Arctic waters to the west in the northern North Atlantic thus seem to have characterized the mid Holocene. On these bases, relationships with pos-itive NAO type of synoptic can be proposed (e.g., Hurrell and Dickson, 2004). Pospos-itive
10
phases of the NAO are presently characterized by reduced strength and frequency of cyclonic activity in the Labrador Sea (Serreze et al., 1997), which result in overall de-crease in cloudiness over much of the North Atlantic, west of Greenland (Previdi and Veron, 2007). The increasing trend of cloud cover in southern Greenland might thus be related to long-term changes in synoptic scale atmospheric circulation patterns,
15
with a progressive shift from dominant NAO+in the mid Holocene (e.g., Gladstone et
al., 2005; Davis and Stevenson, 2007) to negative NAO in the late Holocene. Finally, the present study provides an illustration of the response of Arctic plants to the NAO (Mysterud et al., 2003).
Acknowledgements. This study is a contribution of the Polar Climate Stability Network (PCSN)
20
supported by the Canadian Foundation of Climate and Atmospheric Science (CFCAS). We also acknowledge financial support from the Natural Sciences and Engineering Research Council (NSERC) of Canada and the Fonds Qu ´eb ´ecois de Recherche sur les sciences de la Nature et les Technologies (FQRNT). We are grateful to Gifford H. Miller and Alexander P. Wolfe for the access to core samples. We are also grateful to Denis-Didier Rousseau and Pierre J. H.
25
CPD
5, 879–910, 2009Climate over Greenland and Baffin
Island
B. Fr ´echette and A. de Vernal
Title Page
Abstract Introduction
Conclusions References
Tables Figures
◭ ◮
◭ ◮
Back Close
Full Screen / Esc
Printer-friendly Version
Interactive Discussion
Publication of this paper was granted by EDD (Environnement, D ´eveloppement Durable) and INSU (Institut des Sciences de l’Univers) at CNRS.
References
Andersen, C., Koc¸, N., Jennings, A., and Andrews, J. T.: Non uniform response of the
ma-5
jor surface currents in the Nordic Seas to insolation forcing: implications for the Holocene climate variability, Paleoceanography, 19, PA2003, doi:10.1029/2002PA000873, 2004. Anderson, P. M., Bartlein, P. J., Brubaker, L. B., Gajewski, K., and Ritchie, J. C.: Modern
analogues of late-Quaternary pollen spectra from the western interior of North America, J. Biogeogr., 16, 573–596, 1989.
10
Berger, A. and Loutre, M. F.: Insolation values for the climate of the last 10 million years, Quaternary Sci. Rev., 10, 297–318, 1991.
Birks, C. J. A. and Koc¸, N.: A high-resolution diatom record of late-Quaternary sea-surface temperatures and oceanographic conditions from the eastern Norwegian Sea, Boreas, 31, 323–344, 2002.
15
Birks, H. J. B.: Modern pollen rain and vegetation of the St. Elias Mountains, Yukon Territory, Can. J. Bot., 55, 2367–2382, 1977.
Birks, H. J. B.: Quantitative palaeoenvironmental reconstructions, in: Statistical Modelling of Quaternary Science Data, Technical guide 5, Quaternary Research Association, edited by: Maddy, D. and Brew, J. S., Cambridge, 161–254, 1995.
20
Cappelen, J., Jørgensen, B., Laursen, E., Stanius, L., and Thomsen, R.: The observed cli-mate of Greenland 1958–99 – with climatological normals, 1961–90, Danish Meteorological Institute, Technical Report No. 00-18, Copenhagen, 149 pp., 2001.
Chen, Q.-S., Bromwich, D. H., and Bai, L.: Precipitation over Greenland retrieved by a dynamic method and its relation to cyclonic activity, J. Climate, 10, 839–870, 1997
25
CPD
5, 879–910, 2009Climate over Greenland and Baffin
Island
B. Fr ´echette and A. de Vernal
Title Page
Abstract Introduction
Conclusions References
Tables Figures
◭ ◮
◭ ◮
Back Close
Full Screen / Esc
Printer-friendly Version
Interactive Discussion
and floodings in the Central Ebro Desert, NE Spain, Quaternary Sci. Rev., 26, 1695–1712, 2007.
de Vernal, A., Henry, M., Matthiessen, J., Mudie, P. J., Rochon, A., Boessenkool, K.P., Eynard, F., Grøsfjeld, K., Guiot, J., Hamel, D., Harland, R., Head, M.J., Kunz-Pirrung, M., Levac, E., Loucheur, V., Peyron, O., Pospelova, V., Radi, T., Turon, J.-L., and Voronina, E.:
Dinoflag-5
ellate cyst assemblages as tracers of sea-surface conditions in the northern North Atlantic, Arctic and sub-Arctic seas: the new ‘n=677’ data base and its application for quantitative palaeoceanographic reconstruction, J. Quaternary Sci., 16, 681–698, 2001.
de Vernal, A., Eynaud, F., Henry, M., Hillaire-Marcel, C., Londeix, L., Mangin, S., Matthiessen, J., Marret, F., Radi, T., Rochon, A., Solignac, S., and Turon, J.-L.: Reconstruction of
sea-10
surface conditions at middle to high latitudes of the Northern Hemisphere during the Last Glacial Maximum (LGM) based on dinoflagellates cyst assemblages, Quaternary Sci. Rev., 24, 897–924, 2005.
de Vernal, A. and Hillaire-Marcel, C.: Provincialism in trends and high frequency changes in the northwestern North Atlantic during the Holocene, Global Planet Change, 54, 263–290,
15
2006.
Duplessy, J.-C., Ivanova, E., Murdmaa, I., Paterne, M., and Labeyrie, L.: Holocene paleo-ceanography of the northern Barents Sea and variations of the northward heat transport by the Atlantic Ocean, Boreas, 30, 2–16, 2001.
Environment Canada: Canadian Climate Normals, http://climate.weatheroffice.ec.gc.ca/
20
climate normals/index e.html, 2004.
Faegri, K. and Iversen, J.: Textbook of Pollen Analysis, 3rd Edition, Hafner Press, New York, 295 pp., 1975.
Fr ´echette, B., de Vernal, A., Guiot, J., Wolfe, A. P., Miller, G. H., Fredskild, B., Kerwin, M. K., and Richard, P. J. H.: Methodological basis for quantitative reconstruction of air temperrature
25
and sunshine from pollen assemblages in Arctic Canada and Greenland, Quaternary Sci. Rev., 27, 1197–1216, 2008a.
Fr ´echette, B., de Vernal, A., and Richard, P. J. H.: Holocene and Last Interglacial cloudiness in eastern Baffin Island, Arctic Canada, Can. J. Earth Sci., 45, 1221–1234, 2008b.
Fredskild, B.: Studies in the vegetational history of Greenland. Palaeobotanical investigations
30
of some Holocene lake and bog deposits, Meddr Grønland, 198, 245 pp., 1973.
CPD
5, 879–910, 2009Climate over Greenland and Baffin
Island
B. Fr ´echette and A. de Vernal
Title Page
Abstract Introduction
Conclusions References
Tables Figures
◭ ◮
◭ ◮
Back Close
Full Screen / Esc
Printer-friendly Version
Interactive Discussion
Fredskild, B.: Holocene pollen records from west Greenland, in: Quaternary environments: Eastern Canadian Arctic, Baffin Bay and Western Greenland, edited by: Andrews, J. T., Allen and Unwin, Boston, 643–681, 1985.
Fredskild, B.: The genus Betula in Greenland – Holocene history, present distribution and synecology, Nordic J. Bot., 11, 393–412, 1991.
5
Fredskild, B.: A phytogeographical study of the vascular plants of west Greenland (62◦20′– 74◦00′), Meddr Grønland, Bioscience, 45, 157 pp., 1996.
Gauch, Jr., H. G.: Multivariate analysis in community ecology, Cambridge University Press, Cambridge, 298 pp., 1982.
Gavin, D. G., Oswald, W. W., Wahl, E. R., and Williams, J. W.: A statistical approach to
eval-10
uating distance metrics and analog assignments for pollen records, Quaternary Res., 60, 356–367, 2003.
Giraudeau, J., Cremer, M., Manth ´e, S., Labeyrie, L., and Bond, G.: Coccolith evidence for instabilities in surface circulation south of Iceland during Holocene times, Earth Planet. Sci. Lett., 179, 257–268, 2000.
15
Gladstone, R. M., Ross, I., Valdes, P. J., Abe-Ouchi, A., Braconnot, P., Brewer, S., Kageyama, M., Kitoh, A., Legrande, A., Marti, O., Ohgaito, R., Otto-Bliesner, B., Peltier, W. R., and Vettoretti, G.: Mid-Holocene NAO: A PMIP2 model intercomparison, Geophys. Res. Lett., 32, L16707, doi:10.1029/2005GL023596, 2005.
Guiot, J. and Goeury, G.: 3Pbase – a software for statistical analysis of paleoecological and
20
paleoclimatological data, Dendrochronologia, 14, 123–135, 1996.
Hammarlund, D., Barnekow, L., Birks, H. J. B., Buchardt, B., and Edwards, T. W. D.: Holocene changes in atmospheric circulation recorded in the oxygen-isotope stratigraphy of lacustrine carbonates from northen Sweden, Holocene, 12, 339–351, 2002.
Hughen, K. A., Baillie, M. G. L., Bard, E., Bayliss, A., Beck, J. W., Bertrand, C., Blackwell, P. G.,
25
Buck, C. E., Burr, G., Cutler, K. B., Damon, P. E., Edwards, R. L., Fairbanks R. G., Friedrich, M., Guilderson, T. P., Kromer, B., McCormac, F. G., Manning, S., Bronk Ramsey, C., Reimer, P. J., Reimer, R. W., Remmele, S., Southon, J. R., Stuiver, M., Talamo, S., Taylor, F. M., van der Plicht, J., and Weyhenmeyer, C. E.: Marine04 Marine Radiocarbon Age Calibration, 0–26 cal. kyr BP, Radiocarbon, 46, 1059–1086, 2004.
30
Hurrell, J. W.: Decadal trends in the North Atlantic Oscillation: Regional temperatures and precipitation, Science, 269, 676–679, 1995.
Ecosys-CPD
5, 879–910, 2009Climate over Greenland and Baffin
Island
B. Fr ´echette and A. de Vernal
Title Page
Abstract Introduction
Conclusions References
Tables Figures
◭ ◮
◭ ◮
Back Close
Full Screen / Esc
Printer-friendly Version
Interactive Discussion
tems and Climate Variation – the North Atlantic, edited by: Stenseth, N. C., Ottersen, G., Hurrell, J. W., and Belgrano, X., Oxford University Press, New York, 15–31, 2004.
Kaplan, M. R., Wolfe, A. P., and Miller, G. H.: Holocene environmental variability in southwest-ern Greenland inferred from lake sediments, Quatsouthwest-ernary Res., 58, 149–159, 2002.
Kaufman, D. K., Ager, T. A., Anderson, N. J., Anderson, P. M., Andrews, J. T., Bartlein, P. J.,
5
Brubaker, L. B., Coats, L. L., Cwynar, L. C., Duvall, M. L., Dyke, A. S., Edwards, M. R., Eisner, W. R., Gajewski, K., Geirsdottir, A., Hu, F. S., Jennings, A. E., Kaplan, M. R., Kerwin, M. W., Lozhkin, A. V., MacDonald, G. M., Miller, G. H., Mock, C. J., Oswald, W. W., Otto-Bliesner, B. L., Porinchu, D. F., Ruhland, K., Smol, J. P., Steig, E. J., and Wolfe, B. B.: Holocene thermal maximum in the western Arctic (0–180◦W), Quaternary Sci. Rev., 23, 529–560, 2004.
10
Kelly, M. and Funder, S.: The pollen stratigraphy of late Quaternary lake sediments of south-west Greenland, Rapp. Grønlands Geol. Unders., 64, 1–26, 1974.
Legendre, P. and Legendre, L.: Numerical ecology, 2nd English edition, Elsevier Science BV, Amsterdam, 853 pp., 1998.
Marchal, O., Cacho, I., Stocker, T. F., Grimalt, J. O., Calvo, E., Martrat, B., Shackelton, N.,
15
Vautravers, M., Cortijo, E., Van Kreveld, S., Andersson, C., Koc¸, N., Chapman, M., Sbaffi, L., Duplessy, J.-C., Sarnthein, M., Turon, J.-L., Duprat, J., and Jansen, E.: Apparent cooling of the sea surface in the northeast Atlantic and Mediterranean during the Holocene, Quaternary Sci. Rev., 21, 455–483, 2002.
McAndrews, J. H., Berti, A. A., and Norris, G.: Key to the Quaternary pollen and spores of
20
the great Lakes region, Life Science Miscellaneous Publications, Royal Ontario Museum, Toronto, Canada, 64 pp., 1973.
Moore, P. D., Webb, J. A., and Collinson, M. E.: Pollen analysis, 2nd edition, Blackwell Scientific Publications, Oxford, 216 pp., 1991.
Moros, M., Emeis, K., Risebrobakken, B., Snowball, I., Kuijpers, A., McManus, J., and Jansen,
25
E.: Sea surface temperatures and ice rafting in the Holocene North Atlantic: climate in-fuences on northern Europe and Greenland, Quaternary Sci. Rev., 23, 2113–2126, 2004. Mysterud, A., Stenseth, N. C., Yoccoz, N. G., Ottersen, G. O., and Langvatn, R.: The response
of terrestrial ecosystems to climate variability associated with the North Atlantic Oscillation, in: The North Atlantic Oscillation, Climatic Significance and Environmental Impact, Geophys.
30
Monogr. Ser., vol. 134, edited by: Hurrell, J. W., Kushnir, Y., Ottersen, G., and Visbeck, M., AGU, Washington, D.C., 235–262, 2003.
vari-CPD
5, 879–910, 2009Climate over Greenland and Baffin
Island
B. Fr ´echette and A. de Vernal
Title Page
Abstract Introduction
Conclusions References
Tables Figures
◭ ◮
◭ ◮
Back Close
Full Screen / Esc
Printer-friendly Version
Interactive Discussion
ability. Part I: Development of a 1961–90 mean monthly terrestrial climatology, J. Climate, 12, 829–856, 1999.
New, M., Lister, D., Hulme, M., and Makin, I.: A high-resolution data set of surface climate over global land areas, Climate Res., 21, 1–25, 2002.
NODC: World Ocean Database 2001, Scientific Data Sets, Observed and Standard Level
5
Oceanographic Data [CD-Rom], Natl. Oceanogr. Data Cent., Silver Spring, Md, 2001. Overpeck, J. T., Webb III, T., and Prentice, I. C.: Quatitative interpretation of fossil pollen
spec-tra: dissimilarity coefficients and the method of modern analogs, Quaternary Res., 23, 87– 108, 1985.
Prentice, I. C.: Multidimensional scaling as a research tool in Quaternary palynology: a review
10
of theory and methods, Rev. Palaeobot. Palyno., 31, 71–104, 1980.
Previdi, M. and Veron, D. E.: North Atlantic cloud cover response to the North Atlantic os-cillation and relationship to surface temperature changes, J. Geophys. Res., 112, D07104, doi:10.1029/2006JD007516, 2007.
Reimer, P. J., Baillie, M. G. L., Bard, E., Bayliss, A., Beck, J. W., Bertrand, C. J. H., Blackwell,
15
P. G., Buck, C. E., Burr, G. S., Cutler, K. B., Damon, P. E., Edwards, R. L., Fairbanks, R. G., Friedrich, M., Guilderson, T. P., Hogg, A. G., Hughen, K. A., Kromer, B., McCormac, F. G., Manning, S. W., Ramsey, C. B., Reimer, R. W., Remmele, S., Southon, J. R., Stuiver, M., Talamo, S., Taylor, F. W., van der Plicht, J., and Weyhenmeyer, C. E.: IntCal04 Terrestrial radiocarbon age calibration, 26–0 ka BP, Radiocarbon, 46, 1029–1058, 2004.
20
Renssen, H., Goose, H., Fichefet, T., Brovkin, V., Driesschaert, E., and Wolk, F.: Simulating the Holocene climate evolution at northern high latitudes using a coupled atmospheric-sea ice-ocean-vegetation model, Clim. Dynam., 24, 23-43, 2005.
Richard, P. J. H.: Atlas pollinique des arbres et de quelques arbustes indig `enes du Qu ´ebec, Nat. Can., 97, 1–34, 97–161, 241–306, 1970.
25
Rodr´ıguez-Rajo, F. J., M ´endez, J., and Jato, V.: Factors affecting pollination ecology ofQuercus
anemophilous species in north-west Spain, Bot. J. Linn. Soc., 149, 283–297, 2005.
Rousseau, D.-D., Schevin, P., Ferrier, J., Jolly, D., Andreasen, T., Ascanius, S. E., Hendriksen, S.-E., and Poulsen, U.: Long-distance pollen transport from North America to Greenland in spring, J. Geophys. Res., 113, G02013, doi:10.1029/2007JG000456, 2008.
30
CPD
5, 879–910, 2009Climate over Greenland and Baffin
Island
B. Fr ´echette and A. de Vernal
Title Page
Abstract Introduction
Conclusions References
Tables Figures
◭ ◮
◭ ◮
Back Close
Full Screen / Esc
Printer-friendly Version
Interactive Discussion
Solignac, S., Giraudeau, J., and de Vernal, A.: Holocene sea surface conditions in the west-ern North Atlantic: Spatial and temporal heterogeneities, Paleoceanography, 21, PA2004, doi:10.1029/2005PA001175, 2006.
Steig, E. J.: Mid-Holocene climate change, Science, 286, 1485–1487, 1999.
Stuiver, M. and Reimer, P. J.: Extended 14C database and revised CALIB radiocarbon
calibra-5
tion program, Radiocarbon, 35, 215–230, 1993.
ter Braak, C. J. F and Prentice, I. C.: A theory of gradient analysis, Adv. Ecol. Res., 18, 271– 317, 1988.
ter Braak, C. J. F. and ˇSmilauer, P.: CANOCO for windows: software for Canonical Community Ordination (version 4), Microcomputer Power, Ithaca, NY, USA, 1998.
10
Tsukernik, M., Kindig, D. N., and Serreze, M. C.: Characteristics of winter cyclone activity in the northern North Atlantic: Insights from observations and regional modeling, J. Geophys. Res., 112, D03101, doi:10.1029/2006JD007184, 2007.
Whitmore, J., Gajewski, K., Sawada, M., Williams, J. W., Shuman, B., Bartlein, P. J., Minckley, T., Viau, A. E., Webb III, T., Shafer, S., Anderson, P., and Brubaker, L.: Modern pollen
15
data from North America and Greenland for multi-scale paleoenvironmental applications, Quaternary Sci. Rev., 24, 1828–1848, 2005.
Wohlfahrt, J., Harrison, S. P., and Braconnot, P.: Synergistic feedbacks between ocean and vegetation on mid- and high-latitude climates during the mid-Holocene, Clim. Dynam., 22, 223–238, 2004.
CPD
5, 879–910, 2009Climate over Greenland and Baffin
Island
B. Fr ´echette and A. de Vernal
Title Page
Abstract Introduction
Conclusions References
Tables Figures
◭ ◮
◭ ◮
Back Close
Full Screen / Esc
Printer-friendly Version
Interactive Discussion
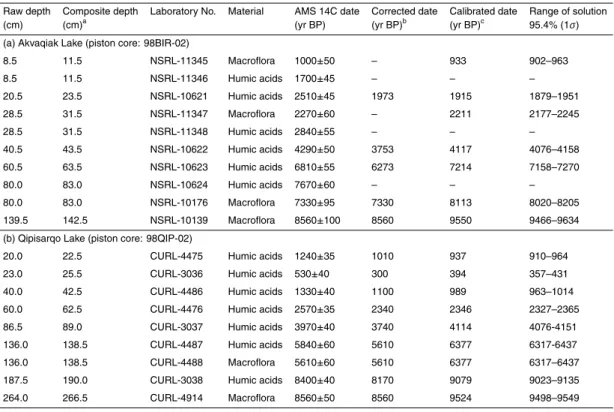
Table 1. AMS 14C dates from(a) Akvaqiak and(b)Qipisarqo lake cores used for developing the age-depth model.
Raw depth Composite depth Laboratory No. Material AMS 14C date Corrected date Calibrated date Range of solution
(cm) (cm)a (yr BP) (yr BP)b (yr BP)c 95.4% (1σ)
(a) Akvaqiak Lake (piston core: 98BIR-02)
8.5 11.5 NSRL-11345 Macroflora 1000±50 – 933 902–963
8.5 11.5 NSRL-11346 Humic acids 1700±45 – – –
20.5 23.5 NSRL-10621 Humic acids 2510±45 1973 1915 1879–1951
28.5 31.5 NSRL-11347 Macroflora 2270±60 – 2211 2177–2245
28.5 31.5 NSRL-11348 Humic acids 2840±55 – – –
40.5 43.5 NSRL-10622 Humic acids 4290±50 3753 4117 4076–4158
60.5 63.5 NSRL-10623 Humic acids 6810±55 6273 7214 7158–7270
80.0 83.0 NSRL-10624 Humic acids 7670±60 – – –
80.0 83.0 NSRL-10176 Macroflora 7330±95 7330 8113 8020–8205
139.5 142.5 NSRL-10139 Macroflora 8560±100 8560 9550 9466–9634
(b) Qipisarqo Lake (piston core: 98QIP-02)
20.0 22.5 CURL-4475 Humic acids 1240±35 1010 937 910–964
23.0 25.5 CURL-3036 Humic acids 530±40 300 394 357–431
40.0 42.5 CURL-4486 Humic acids 1330±40 1100 989 963–1014
60.0 62.5 CURL-4476 Humic acids 2570±35 2340 2346 2327–2365
86.5 89.0 CURL-3037 Humic acids 3970±40 3740 4114 4076-4151
136.0 138.5 CURL-4487 Humic acids 5840±60 5610 6377 6317-6437
136.0 138.5 CURL-4488 Macroflora 5610±60 5610 6377 6317–6437
187.5 190.0 CURL-3038 Humic acids 8400±40 8170 9079 9023–9135
264.0 266.5 CURL-4914 Macroflora 8560±50 8560 9524 9498–9549
a
Depth added to correct for offset between piston and gravity (Glew) core depths.
b
Years subtracted from humic acid ages to correct for offset measured between paired macro-fossil and humic acid dates.
c
CPD
5, 879–910, 2009Climate over Greenland and Baffin
Island
B. Fr ´echette and A. de Vernal
Title Page
Abstract Introduction
Conclusions References
Tables Figures
◭ ◮
◭ ◮
Back Close
Full Screen / Esc
Printer-friendly Version
Interactive Discussion HU085
80oW 60oW 40oW 0o 20oE
40oN
50oN
60oN
70oN
80oN
AKV
QIP
HU021 BLC
EGC
NA C
NAC
AF
LC WGC
20oW
CPD
5, 879–910, 2009Climate over Greenland and Baffin
Island
B. Fr ´echette and A. de Vernal
Title Page
Abstract Introduction
Conclusions References
Tables Figures
◭ ◮
◭ ◮
Back Close
Full Screen / Esc
Printer-friendly Version
Interactive Discussion
0
50
100
150
Calibrated Age (kyr BP)
0 2 4 6 8 10
Depth (cm)
0 2 4 6 8 10
0
50
100
150
200
Depth (cm)
Calibrated Age (kyr BP) a) Akvaqiak Lake
b) Qipisarqo Lake
CPD
5, 879–910, 2009Climate over Greenland and Baffin
Island
B. Fr ´echette and A. de Vernal
Title Page
Abstract Introduction
Conclusions References
Tables Figures
◭ ◮
◭ ◮
Back Close
Full Screen / Esc
Printer-friendly Version
Interactive Discussion
EAST:OCEAN
-4 0 8
PCA axis 1 HU085
(λ1=5.37, 27.5%)
Calibr
ated Age (kyr BP)
0
1
2
3
4
5
6
7
8
WEST:LAND
PCA axis 1 Akvaqiak
(λ
1=1.91, 60.1%)
3 0 -3 0
1
2
3
4
5
6
7
8
Calibr
ated Age (kyr BP)
WEST:OCEAN
4 0 -3
PCA axis 1 HU021
(λ
1=2.95, 24.1%)
EAST:LAND
-4 0 4
PCA axis 1 Qipisarqo
(λ
1=3.62, 44.2%)
a)
b)
c)
d)
CPD
5, 879–910, 2009Climate over Greenland and Baffin
Island
B. Fr ´echette and A. de Vernal
Title Page Abstract Introduction Conclusions References Tables Figures ◭ ◮ ◭ ◮ Back Close
Full Screen / Esc
Printer-friendly Version
Interactive Discussion
28 32 36 40
25 30 35 40 45
-5 0 5 10 15 20
0 5 10 15 20 25 30 0 1 2 3 4 5 6 7 8
2 4 6 8 10 12
0 1 2 3 4 5 6 7 8
July SAT (oC) Akvaqiak Lake
2 4 6 8 10 12 14
Calibr
ated Age (kyr BP)
Calibr
ated Age (kyr BP)
a) b) c) d) e) f)
July SAT (oC) Qipisarqo Lake
JJAS Sunshine (%) Akvaqiak Lake
JJAS Sunshine (%) Qipisarqo Lake
August SST (oC) core HU021
August SST (oC) core HU085
- 0.1
oC/ka (
r = 0.80)
- 0.5
oC/ka (
r = 0.92)
- 0.7
oC/ka (
r = 0.78)
+ 0.6%/ka (
r = 0.83)
- 0.8%/ka (
r = 0.71)
+ 0.3
oC/ka (
r = 0.52)
Fig. 4. Time series of climatic and sea-surface conditions. (a) July surface air temperature (SAT) at Akvaqiak Lake. Modern value: 6.2±1.0◦C (Environment Canada, 2004). (b)July SAT
at Qipisarqo Lake. Modern value: 9.0±1.1◦C (Cappelen et al., 2001). (c) Gowing season
(JJAS) sunshine at Akvaqiak Lake. Modern value: 39.6±5.8% (New et al., 2002; Whitmore
et al., 2005). (d) JJAS sunshine at Qipisarqo Lake. Modern value: 33.2±1.9% (New et al.,
2002; Whitmore et al., 2005). (e)August sea-surface temperature (SST) at core HU021 (de Vernal and Hillaire-Marcel, 2006). Modern value: 6.7±0.9◦C (NODC, 2001). (f)August SST at
core HU085 (de Vernal and Hillaire-Marcel, 2006). Modern value: 10.6±0.8◦C (NODC, 2001).
CPD
5, 879–910, 2009Climate over Greenland and Baffin
Island
B. Fr ´echette and A. de Vernal
Title Page
Abstract Introduction
Conclusions References
Tables Figures
◭ ◮
◭ ◮
Back Close
Full Screen / Esc
Printer-friendly Version
Interactive Discussion
-1 -0.5 0 0.5 1
-1 -0.5 0 0.5 1
RDA axis 1 (λ
1=0.184, 72.5%)
RD
A axis 2
(
λ2
=0.051, 20.1%)
Arctic reference sites
January SAT
Annual P July SAT
JJAS Sunshine a)
0 1 2 3
0
1
2
3
4
5
6
7
8
Akvaqiak
RDA axis 1
Calibr
ated Age (kyr BP)
b)
0 1 2 3
0
1
2
3
4
5
6
7
8
Qipisarqo
RDA axis 1
Calibr
ated Age (kyr BP)
c) 256 sites
35 pollen taxa
Fig. 5. Results of Redundancy Analysis (RDA). (a)RDA plot of environmental gradients as-sociated with the 256 Arctic reference sites. The eigenvalue (λ) and percentage of variance are given for RDA axes 1 and 2. Stratigraphic plot of RDA axis 1 sample scores of (b)
CPD
5, 879–910, 2009Climate over Greenland and Baffin
Island
B. Fr ´echette and A. de Vernal
Title Page
Abstract Introduction
Conclusions References
Tables Figures
◭ ◮
◭ ◮
Back Close
Full Screen / Esc
Printer-friendly Version
Interactive Discussion Baffin Is.
Greenland
Labrador
NF
Québec
South (60o N)
Isoëtes Spongilla Kløftsø
South-West (61-62oN)
Nigerdleq (62oN)
Qipisarqo (61oN)
West (64oN)
Johs. Iversen (50o
W) Karra (50o
W) Terte (51o
W) Sârdlup (51o
W)
Labrador Sea
CPD
5, 879–910, 2009Climate over Greenland and Baffin
Island
B. Fr ´echette and A. de Vernal
Title Page Abstract Introduction Conclusions References Tables Figures ◭ ◮ ◭ ◮ Back Close
Full Screen / Esc
Printer-friendly Version Interactive Discussion Aln us influx (g rains/cm 2/yr) T
otal pollen influx (g
rains/cm 2/yr) 0 100 200 300 0 500 1000 1500
0 2000 4000 6000 8000
i) Isoëtes (59˚58'N, 44˚21'W)
Alnus absent S
Age 14C BP
100 200 300 500 1000 1500
f) Qipisarqo (61˚00'N, 47˚45'W)
Alnus present regionally
SSW 100 200 300 500 1000 1500
h) Spongilla (59˚58'N, 44˚21'W)
Alnus absent S
100 200 300 500 1000 1500
d) Sârdlup Qáqâ (64˚24'N, 51˚41'W)
Alnus present regionally
W coast 100 200 300 500 1000 1500
g) Kløftsø (60˚03'N, 44˚14'W)
Alnus absent
S 100 200 300 500 1000 1500
c) Terte Lake A (64˚28'N, 51˚35'W)
Alnus present regionally
W coast 100 200 300 500 1000 1500
e) Nigerdleq (62˚04'N, 49˚20'W)
Alnus present regionally
SW
Alnus immigration
7600 14
C BP 100 200 300 500 1000 1500
b) Karra (64˚46'N, 50˚35'W)
Alnus present locally
no data
W inland Alnus immigration
3500 14
C BP 100 200 300 500 1000 1500
a) Johs. Iversen (64˚24'N, 50˚12'W)
Alnus present locally inlandW
Alnus immigration
3500 14
C BP
Age 14C BP
0 2000 4000 6000 8000
CPD
5, 879–910, 2009Climate over Greenland and Baffin
Island
B. Fr ´echette and A. de Vernal
Title Page
Abstract Introduction
Conclusions References
Tables Figures
◭ ◮
◭ ◮
Back Close
Full Screen / Esc
Printer-friendly Version
Interactive Discussion
Fig. 7. Mid-late Holocene Alnus and total pollen influxes of southwestern Greenland sites (cf. Fig. 6).(a–d)Data from west Greenland sites (Fredskild, 1983). (e)Data from south-west Greenland site (Kelly and Funder, 1974). (g–i)Data from south Greenland sites (Fredskild, 1973). The influxes were calculated by Fredskild (1973, 1983) and Kelly and Funder (1974) and presented as average for each pollen assemblage zones. (f)Data from Qipisarqo Lake (this study). At present,Alnus crispagrows only around (a) Johs. Iversen and (b) Karra sites. On each graph, the shaded curve corresponds toAlnuspollen influx and the tick black line cor-responds to total pollen influx. The total pollen influx includesAlnuspollen grains but excludes long-distance pollen grains from trees,Ambrosia and Chenopodiaceae. High Alnus percent-ages (>20%) are recorded only at (a) Johs. Iversen and (f) Qipisarqo sites. At these sites, the
CPD
5, 879–910, 2009Climate over Greenland and Baffin
Island
B. Fr ´echette and A. de Vernal
Title Page
Abstract Introduction
Conclusions References
Tables Figures
◭ ◮
◭ ◮
Back Close
Full Screen / Esc
Printer-friendly Version
Interactive Discussion
2
4
6
8 0
Calibr
ated Age (kyr BP)
5 10 15 20
August SST (oC)
HU-085
HU-021
0
2
4
6
8
Calibr
ated Age (kyr BP)
5 7 9 11 13
Qipisarqo
Akv
aqiak
July SAT (oC)
470 490 510 530 19 21 23 25
Insolation 60oN (Wm-2)
June December
June December
0 1 2 3
RDA Axis 1
Relative Ann. Moisture & Winter Warmth
Akv
aqiak
Qipisarqo
0 400 800 1200
Pollen Influx (grains/cm2/yr)
0 200 400
Akv
aqiak
Qipisarqo
Qipisarqo Akvaqiak
Qipisarqo
Akv
aqiak
JJAS Sunshine (%)
30 34 38 42
a) b) c) d) e) f)
Fig. 8. Contrasting trend in climatic and sea-surface conditions. (a) July SAT reconstruction at Akvaqiak (black) and Qipisarqo (grey) lakes. (b) August SST reconstruction from cores HU021 (black) and HU085 (grey) (de Vernal and Hillaire-Marcel, 2006). (c) JJAS sunshine reconstruction at Akvaqiak (black) and Qipisarqo (grey) lakes.(d)Total pollen influx at Akvaqiak (black) and Qipisarqo (grey) lakes. (e) Stratigraphic plot of RDA axis 1 scores at Akvaqiak (black) and Qipisarqo (grey) lakes. This curve represents an estimation of the January air temperature and annual precipitation trends, which are co-variant parameters (supplementary Tables 3 and 4) http://www.clim-past-discuss.net/5/879/2009/cpd-5-879-2009-supplement.pdf.