REGULAR ARTICLE
RECOMBINANT PROTEIN PRODUCTION OF ABUNDANT LARVAL
TRANSCRIPT (ALT-2) IN ESCHERICHIA COLI
Kamran Ashraf *1, Subramanian Ramalingam1, Mohd. Mujeeb2 , Amreen Haider3
Address: Kamran Ashraf,
1SPIC Bioprocess Laboratory, Centre for Biotechnology, Anna University, Chennai-600025
Tamilnadu. (India), Mobile-+91-7503457737.
2 Bioactive Natural Product Laboratory, Department of Pharmacognosy and Phytochemistry
Faculty of Pharmacy, Jamia Hamdard New Delhi-62, India. 3Z H Unani Medical College & Hospital, Siwan, Bihar, India.
*Corresponding author: [email protected]
ABSTRACT
Keywords: Lymphatic filariasis, IPTG, plasmid stability, abundant larval transcript, shake flask
INTRODUCTION
Lymphatic filariasis (LF) is a mosquito-transmitted disease caused by parasitic nematodes Brugia and Wuchereria. More than 120 million people living in 83 endemic countries of the tropics and subtropics were affected from this disease. Over 1.3 billion people (one-fifth of the world’s population) are at the risk of infection through their exposure to LF’s mosquito borne infective larvae (WHO, 2006). Two highly expressed genes designated abundant larval transcript-1 and -2 (alt-1 and alt-2). ALT-1 and ALT-2 represent closely related protein (79%) it ALT-2 is the most abundantly expressed protein in the infective stage larvae (L3) of the filarial life cycle (Joseph et al., 1998). The Global Programme to eliminate Lymphatic Filariasis (GPELF) has been initiated by World Health Organization (WHO) in 1997 with two major goals, which is to disrupt transmission of the parasite and morbidity control by providing care for those who suffer the overpowering clinical manifestations of the disease (Addiss and Brady, 2007). Escherichia coli is commonly used to produce recombinant proteins because it can be grown to high densities on inexpensive media and its genetics has been well understood. These attributes led to the use of E. coli as the most popular host cell in bio fermentation. Although filarial parasite is a eukaryote, and we had chosen a prokaryotic expression system (E. coli) for production of ALT-2 recombinant protein based on two reasons. First, an E. colisystem is used because the proteins expressed do not have post translational modifications. Second, an E. coli expression system allows production of large amounts of recombinant proteins (Kathleen et al., 1996). However, synthesis of recombinant protein places substantial metabolic burden on the producing cells. In order to prevent this burden from compromising the growth, by using transcription regulators. Common regulators used in E. coli include the lac, trp, ara BAD and tac promoters
conditions, such as culture temperature, medium composition, induction time, inducer concentration and inducer type, which can be optimized for over expression of a soluble protein (Hettwer et al., 2002; Kopetzki et al., 1989).
Hence it is important to optimize the type of medium, IPTG concentration and induction time, to achieve high cell density culture towards the aim of producing a high yield of the recombinant protein. Generally the development of fermentation strategies is paying attention on improving the cultivation techniques, manipulating the physiology of the bacteria and the level of recombinant protein expression. As a result, batch and fed batch fermentation techniques have been developed (Shiloach and Fass, 2005).
Here in this experiment, we first optimized the different parameter for the production of larger amount of abundant larval transcript-2 recombinant protein then after production was done at reactor scale. This is because of its potential use in vaccines.
MATERIAL AND METHODS
Host and vectors pRSETB-alt-2 construct coding for the His-tagged ALT-2 protein was previously constructed in our laboratory. It was expressed in E. coli BL21(DE3)pLysS (Novagen, Darmstadt, Germany).
Reagents and media
Reagents and chemicals were purchased from Merck (Darmstadt, Germany) and BioRad (Hercules, USA). Inoculum was grown in Luria-Bertani medium (LB) that contained the following: peptone (10 g.L-1), yeast extract (5 g.L-1), NaCl (5 g.L-1) and the pH was adjusted to 7.2.
Competent cell preparation
There are two main methods are available for transformation of competent bacterial cells, the calcium chloride and the electroporation method (Dargert et al., 1979; Okamoto et al., 1997; Topcu, 2000). Here we have chosen the calcium chloride method.
flask was chilled on ice immediately. The culture was centrifuged at 4˚C at 3500 rpm for 5 minutes. The supernatant was decanted and the tube was kept in an inverted position for 1 min to allow the last trace of media to drain away. The pellet was suspended in 100 mM of CaCl2 (one fourth volume of culture), kept in ice for 30 minute. The cells were recovered by centrifugation at 3500 rpm for 5 min at 4˚C. The fluid was decanted from the tube and the pellet was re suspended in 100 mM CaCl2 and stored for 30 minute in ice. Again we recovered the cell by centrifugation at same speed. Discarded the liquid and suspend the cell in 2 ml 0.1M CaCl2.
Preparation of competent cells for storage as glycerol stocks
Transfer 1.6 ml of the competent cellsuspension to sterile cryo-storage tubes, and add 0.4 ml of sterile 100% glycerol to give a final concentration of 20% glycerol, and then mix together. The glycerol stocks areplaced at -4ºC, -20ºC and -70ºC separately for later use.
Transformation in bacterial cell
Bacterial transformation, Plasmid transformation and antibiotic selection
Calcium chloride treatment of bacterial cells produces competent cells that will take up DNA following a heat shock step. DNA molecules, i.e. plasmids, which are introduced by this method, will then be replicated in the bacterial host cells. To aid the bacterial cells’ recovery, the cells are incubated briefly with non-selective growth medium following the heat shock treatment. However, due to the low percentage of bacterial cells that have been transformed with the plasmid and the potential for the plasmid not to propagate itself in all daughter cells, it is necessary to select for bacterial cells that contain the plasmid. This is commonly performed using antibiotic selection.
Bacterial transformation protocol
added to tube and incubated at 37˚C. This step is to allow the bacteria to recover and to express the antibiotic resistant marker encoded by the plasmid. After 1 hr. incubation plate 100 μL of cell in LB with agar ampicillin plate. A negative control was also prepared accordingly. The plates were incubated at 37˚C overnight (12 to 16 hrs.). After 16 hr of overnight incubation, the colonies were screened and the results compared. The transformed colonies were incubated in 3 mL of LB ampicillin medium.
Initial inoculum concentration
A single colony of Alt-2 was inoculated in 10 mL of LB broth followed by sub-culturing into 100 mL modified LB (supplemented with 100 μg.mL-1 ampicillin) and incubated overnight (± 16 h) at 37 °C at 180 rpm in an incubator shaker. In order to optimize the initial inoculum, different concentrations of initial inoculum were varied at 1% v/v, 3% v/v, 7% v/v and 10% v/v of the recombinant bacteria in shake flask culture. Optimization of culture medium. Media trials were performed to evaluate the ALT-2 recombinant antigen production on several media that are commonly used for culturing E. coli. Triplicate cultures were performed in four different medium namely Luria-Bertani broth (LB), Terrific broth (TB), Super broth (SB), and M9 minimal medium (Atlas, 1997). Culture working volume was set at 10% of total volume, where the optimized inoculum was added to 100 mL of each of the different medium in 1 L Erlenmeyer flask incubated at 180 rpm at 37 °C. Samples were taken at regular time intervals. Cultures were induced with 1.0 mM IPTG once the cell density reached (OD600)0.62. The amounts of total cell protein recombinant protein and biomass were measured.
Optimization of inducer concentration
Optimization of induction time
To examine the effect of induction time on the production of ALT-2, the optimized inoculum was added to 1 L shake flasks containing 200 mL of the optimized medium supplemented with 100 μg/mL ampicillin. Triplicate cultures were induced at initial ODs of 0.1, 0.2, 0.4, 0.6, 0.8, 1.0 and 1.5 using 1.0 mM IPTG, at 180 rpm and 37 °C. The amounts of total cell protein, recombinant protein and biomass were measured.
Shake flask experiment
E.coli BL21(DE3)pLysS host was transformed chemically with the pRSETB-alt-2 vector construct.LB media used for culturing E. coli. Culture working volume was set at 18% of total volume, where the optimized inoculum was added to 200 mL of LB medium in 1 L Erlenmeyer flask incubated at 180 rpm at 37 °C. Samples were taken at regular time intervals. Cultures were induced with 1.0 mM IPTG once the cell density reached (OD600) 0.62. Expression of protein was checked by running SDS-PAGE (Fig 1). The amounts of total recombinant protein were measured.
Batch Culture
Protein Recovery
Biomass was monitored by measuring optical density at 600nm using a spectrophotometer (Thermo Spectronic, USA). The dry cell weight (DCW) was estimated from a calibration curve that interrelated experimentally measured dry weight to spectrophotometric measurement of optical density. Total cell protein was estimated at various concentrations of bovine serum albumin (Sigma, USA) by BioRad Protein Assay (BioRad, USA), using protein standards. This is comprising Sodium dodecyl sulfate polyacrylamide gel electrophoresis (SDS-PAGE) of protein samples and was carried out as described previously (Laemmli, 1970). The gels were stained with Coomassie Brilliant blue R-250 (BioRad, USA). Low molecular weight marker proteins were used as standards (BioRad Precision Plus Protein Standards Unstained, BioRad, USA).
RESULTS AND DISCUSSION
The growth and protein production characteristics of the cell cultured on various media have been studied. LB produced the highest cell protein among them(Table 1).
The only chemically defined medium used was minimal medium (M9) which yielded poor growth, this may be due to the low glucose level in the medium. Chemically defined media are generally known to produce slower growth and lower protein titres than complex media
(Zanette et al., 1998). In the present study, the volumetric titre of recombinant antigen declined as the concentration of IPTG increased over the 1.0 mM threshold.This was obvious because the presence of excessive IPTG reduced the final biomass as a consequence of the growth inhibition. Thus the results shown that expression of total protein using 0.5 mM (2.0 mg.L-1), 0.8 mM (2.3 mg.L-1) and 1.0 mM (2.4 mg.L-1) IPTG. Thus, 1.0 mM IPTG was found to be the optimum inducer concentration and was used in all subsequent experiments.
Optimization of induction time
Shake flask experiment
From shake flask experiment, it was noted that the protein expression in induced pellet is more better as compared to uninduced pellet and supernatant (Fig 1).
Batch Culture
In this experiment we have seen that in long run of batch culture plasmid is no longer stable and did not produce any expression (Table 2). Hence plasmid analysis experiment was carried out.
Plasmid stability analysis
Appropriate dilution of each sample of cells(uninduced and induced) were plated as in two LB agar plates-one containing ampicillin at a conc.of 100 ug.mL-1 (X) and 200 ug.mL-1 (2X) and other without antibiotics. The cells were incubated at 30oC.The no. of colonies grown in both plates were counted and the stablity of plasmids were expressed in terms of percentage of plasmid bearing cells using the following formula (Table 3).
Percentage of plasmid bearing cells = No.of colonies in LB ampicillin containing plate X 100 No.of colonies in LB media containing plate
stable.The expression of protein was seen in SDS-PAGE analysis (Fig 2) and concentration of protein were measured.
Figure 1 SDS-PAGE (12%) analysis of BL21(DE3) plysS
Experiment was done in flask with 200 ml LB media. Lane1: standard protein marker (kDa), Lane2: uninduced supernatant, Lane3: uninduced pellet, Lane 4: induced supernatant, Lane5: induced pellet.
Figure 2 SDS-PAGE analysis of E.coli BL21(DE3) plysS
Experiment was done in shake flask in 100 ml of LB media. Lane1:Standard protein marker, Lane2: 2X concentration of ampicillin at 1st hour of sample after induction, Lane3: 3X concentration of ampicillin at1st hour sample after induction, Lane4: X concentration of ampicillin, 1st hour sample before induction (where X
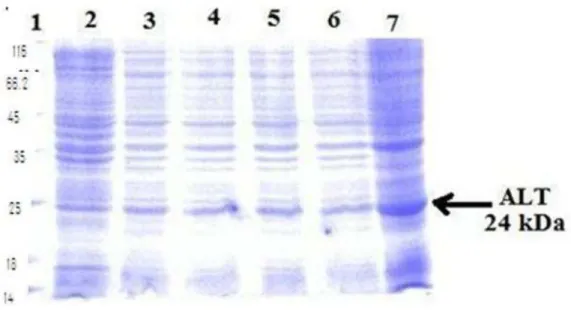
Figure 3 SDS-PAGE (12%) analysis of BL21(DE3) plysS of batch culture in fermenter
Lane1:Std protein marker (kDa), Lane2: uninduced sample, Lane 3:uninduced sample, Lane4: uninduced sample, Lane5: induced sample, Lane6: induced sample, Lane7: induced sample.
Table 1 Production characteristics of ALT-2 expressing Total Cell Protein (TCP) cultured in various media (n=2)
Post inocula tion time(h)
LB TB SB M9 minimum media
TCP(mg/L) DCW(g/L) TCP(mg/L) DCW(g/L) TCP(mg/L) DCW(g/L) TCP(mg/L) DCW(g/L)
3 103.54
±3.26 3.25 ±0.12 93.25 ± 3.95 1.33 ±0.06 64.08 ±2.79 1.84 ±0.08 51.69 ±2.29 0.77 ±0.03
4 97.29
±4.16 6.20 ±0.24 98.07 ±3.18 1.54 ±0.06 76.44 ±3.80 2.79 ±0.11 69.22 ± 2.40 0.93 ±0.04
5 103.54
±3.26
3.25 ±0.11
98.23 ± 1.34
1.53 ±0.05
88.34 ±2.08
1.44 ±0.03
61.09 ±3.18
0.98 ±0.06
6 102.79
±2.21 3.99 ±0.06 93.25 ± 3.95 1.33 ±0.06 60.09 ±3.17 0.98 ± ±0.05 66.97 ±3.35 2.11 ±0.11
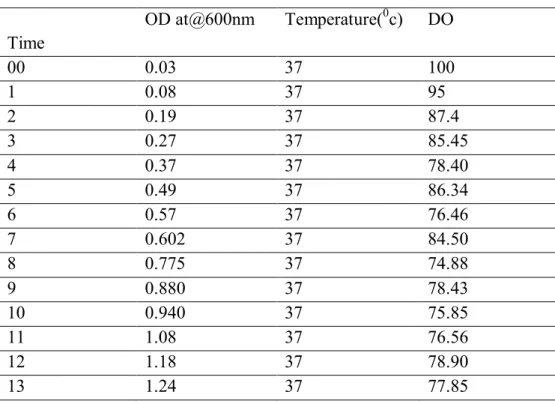
Table 2 Profile of Batch fermentation with induction (n=2)
Time OD at@600nm Temperature(
0c) DO
00 0.03 37 100
1 0.08 37 95
2 0.19 37 87.4
3 0.27 37 85.45
4 0.37 37 78.40
5 0.49 37 86.34
6 0.57 37 76.46
7 0.602 37 84.50
8 0.775 37 74.88
9 0.880 37 78.43
10 0.940 37 75.85
11 1.08 37 76.56
12 1.18 37 78.90
13 1.24 37 77.85
OD-optical density, DO-Dissolve Oxygen
Table 3 Plasmid stability analysis at different dilution (n=2) Before induction,1st hr sample
S.N No of times
dilution % plasmid bearing cell 1 10-1 dilution 83
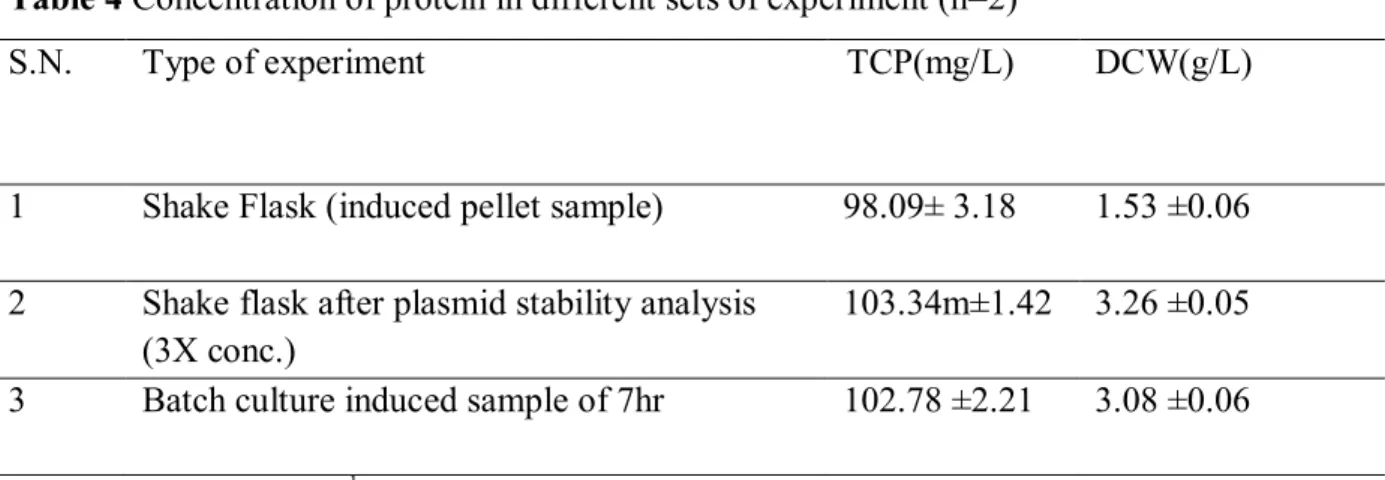
Table 4 Concentration of protein in different sets of experiment (n=2)
S.N. Type of experiment TCP(mg/L) DCW(g/L)
1 Shake Flask (induced pellet sample) 98.09± 3.18 1.53 ±0.06
2 Shake flask after plasmid stability analysis
(3X conc.) 103.34m±1.42 3.26 ±0.05
3 Batch culture induced sample of 7hr 102.78 ±2.21 3.08 ±0.06
X concentration-100 ug.mL-1
CONCLUSION
Expression of ALT in E.coli Bl21plysS at flask level was found very good as compared to large scale production. This is because of at shake flask expression was very good because all the controlling parameter like PH, dissolve oxygen, plasmid stability etc was maintained but at large scale it is difficult to do. Since plasmid in E.coli is no longer stable in running the reactor for longer duration. Hence pulsation of antibiotic of different concentration at different interval of time have overcome this problem and plasmid become stable and expression of ALT was recorded very good. When target protein is highly expressed, maintenance of plasmid induces stress reponse (Hoffmann and Rinas, 2004). Plasmid copy number play very important role in plasmid maintenance may often induced by stress (Bailey, 1993). In this experiment good expression was recorded in soluble form and hence maximum amount of protein was found in soluble form.
Acknowledgments: All authors are thankful to the Director,Centre for Biotechnology, Anna University, Chennai for providing the laboratory facility to carry out the research.
REFERENCES
ADDISS, D. G. – BRADY, M. A. 2007. Morbidity management in the global programme to eliminate lymphatic filariasis. A review of the scientific literature. In Filaria Journal, vol. 6, 2007, p.1-19.
BAILEY, J. E. 1993. Host-vector interactions in Escherichia coli. In Adv. Biochem. Eng. Biotechnol., vol. 48, 1993, p. 29–52.
CHISTI, Y. 1998. Bioseparation and Bioprocessing: A Handbook,vol.2, Subramanian, G. ed, Wiley-VCH, New York. 1998, p. 3-30.
CORCHERO, J. L. – CUBARSI, R. – VILA, P. – ARIS, A. – VILLAVERDE, A. 2001. Cell lysis in Escherichia coli cultures stimulates growth and biosynthesis ofrecombinant proteins in surviving cells.In Microbiological Research, vol. 156, 2001, p.13-18.
DAGERT, M. – EHRLICH, S. D. 1979. Prolonged incubation in calcium chloride improves the competence of E. coli cells. In Gene, vol. 85, 1979, no. 6, p. 2312.
HETTWER, S. – STERNER, R. 2002. A novel tryptophan synthase beta-subunit from the hyperthermophile Thermotoga maritima. Quaternary structure, steady-state kinetics, and putative physiological role. In J Biol Chem. vol. 277(10), 2002, p. 8194-8201.
HOFFMANN, F. – RINAS, U. 2004. Stress induced by recombinant protein production in Escherichia coli. In Adv. Biochem. Eng. Biotechnol, vol. 89, 2004, p. 73–92.
JENSEN, E. B. – CARLSEN, S. 1990.Production of recombinant human growth hormone in Escherichia coli. Expression of different precursors and physiological effects of glucose, acetate and salts. In Biotechnol. Bioeng, vol. 36, 1990, p. 1–11
JOSEPH, G. T. – HUIMA, T. – LUSTIGMAN, S. 1998. Characterization of an Onchocerca volvulus L3-specific larval antigen, Ov-ALT-1. In Mol Biochem Parasitol, vol. 96, 1998, p. 177–183 doi:10.1016/S0166-6851(98) 00094-2.
KATHLEEN, A. S. – TIMOTHY, J. H. – RAJAN, T. V. – YATES, J. A. 1996. Localization of paramyosin, myosin andheat shock protein70 in larval and adult Brugiamalayi. In Journal of Parasitology, vol. 82, 1996,p. 367-370.
KOPETZKI, E. – SCHUMACHER, G. – BUCKEL, P. 1989.Control of formation of active soluble or inactive insoluble baker’s yeast alphaglucosidase PI in Escherichia coli by induction and growth conditions. In Mol Gen Genet, vol. 216, 1989, no. 1, p. 149–155.
KWEON, D. H. – HAN, N. S.– PARK, K. M. – SEO, J. H. 2001.Overproduction of Phytolacca insularis protein in batch and fed-batch culture of recombinant Escherichia coli. In Process Biochemistry, vol. 36, 2001, p. 537-542.
KWON, S. – KIM, S. – KIM, E. 1996. Effects of glycerol on b-lactamase production during high cell density cultivation of recombinant Escherichia coli. In Biotechnol. Prog. vol. 12, 1996, p. 205–208.
MAKRIDES, S.C. 1996. Strategies for achieving high-level expression of genes in Escherichia coli. In Microbiological Review, vol. 60, 1996, p. 512-538.
MARK, A. – EITEMAN – ALTMAN, E. 2006.Overcoming acetate in Escherichia coli recombinant protein fermentations. In Trends In Biotechnology, vol. 24, 2006, no.11, p. 531-536.
OKAMOTO, A. – KOSUGI, A. – KOIZUMI,Y. –YANAGIDA, F.– UDAKA, S. 1997. High efficiency transformation of Bacillus brevis by electroporation. In Bioscience, Biotechnology and Biochemistry. vol.61, 1997, no.1, p. 202-203.
SAKAMOTO, S. – IIJIMA, M. – MATSUZAWA, H. – OHTA, T. 1994. Production of thermophilic protease by glucose-controlled fed-batch culture of recombinant Escherichia coli. In J. Ferment. Bioeng. vol.78, 1994, p. 304–309.
SHILOACH, J. – FASS, R. 2005. Growing E. coli to high cell density – A historical perspective on method development. In Biotechnology Advances, vol. 23, 2005, p. 345-357. SORENSEN, H.P. – MORTENSEN, K.K. 2005. Advanced genetic strategies for recombinant protein expression in Pichia pastoris. In Journal of Biotechnolog, vol. 115, 2005, p. 113–128. THIRY, M. – CINGOLANI, D. 2002. Optimizing scale-up Fermentation processes. In Trend in Biotechnology, vol. 20, 2002, p. 103-105.
TOPCU, Z. 2000. An optimized recipe for cloning of the polymerase chain reaction- amplified DNA inserts into plasmid vectors. In Acta Biochimica Polonica, vol. 47, 2000, no. 3, p. 841-846.
WORLD HEALTH ORGANIZATION. 2006. Global programme to eliminate lymphatic filariasis: progress report on mass drug administrations.
ZANETTE, D. – DUNDON, W. – SOFFIENTINI, A.– SOTTANI, C. MARINELLI, F. – AKESON, A. – SARUBBI, E. 1998. Human IL-1 receptor antagonist from Escherichia coli large-scale microbial growth and protein purification. In Journal of Biotechnology, vol. 64, 1998, p. 187-196.