Health Promotion Perspectives, 2015, 5(1), 34-41 doi: 10.15171/hpp.2015.005
http://journals.tbzmed.ac.ir/HPP
Stroke Education in an Emergency Department Waiting Room:
A Comparison of Methods
Yu-Feng Yvonne Chan1, Lynne D. Richardson1, *Roxanne Nagurka2, Ke Hao3, Sergey B. Zaets1, Michael B. Brimacombe4, Susanne Bentley1, Steven R. Levine5
1Department of Emergency Medicine, Icahn School of Medicine at Mount Sinai, New York, New York 10029, USA 2Department of Emergency Medicine, Rutgers, New Jersey Medical School, Newark, New Jersey 07103, USA 3Department of Genetics and Genomic Sciences Icahn School of Medicine at Mount Sinai, New York, New York 10029, USA
4Department of Biostatistics, Division of Biostatistics, Rutgers, New Jersey Medical School, Newark, New Jersey 07103, USA 5Department of Neurology, Icahn School of Medicine at Mount Sinai, New York, New York 10029, USA
ARTICLE INFO ABSTRACT
Article type:
Original Article Background: Since the emergency department (ED) waiting room hosts a large, captive audience of patients and visitors, it may be an ideal location for conduct-ing focused stroke education. The aim of this study wastoassess the effective-ness of various stroke education methods.
Methods: Patients and visitors of an urban ED waiting room were randomized into one of the following groups: video, brochure, one-to-one teaching, combi-nation of these three methods, or control group. We administered a 13-question multiple-choice test to assess stroke knowledge prior to, immediately after, and at 1 month post-education to patients and visitors in the ED waiting room.
Results: Of 4 groups receiving education, all significantly improved their test scores immediately post intervention (test scores 9.4±2.5-10.3±2.0, P<0.01). At 1 month, the combination group retained the most knowledge (9.4±2.4) exceed-ing pre-intervention and control scores (both 6.7±2.6, P<0.01).
Conclusion: Among the various stroke education methods delivered in the ED waiting room, the combination method resulted in the highest knowledge reten-tion at 1-month post intervenreten-tion.
Article history:
Received: Nov 16 2014 Accepted:Feb 14 2015 e-published: Mar 29 2015
Keywords:
Stroke education, Patient education, Emergency Department
*Corresponding Author:
Roxanne Nagurka Tel: +1 973 972 5129;
Email:
Introduction
Delayed presentation of stroke patients to the emergency department (ED) occurs primarily due to a lack of public knowledge of the risk factors, warning signs, and symptoms of stroke.1 Up to 27%
of adults cannot name a single warning sign of stroke and up to 25% are unable to name a single risk factor.2,3 This lack of stroke knowledge is
most widespread in the populations at highest risk
for experiencing stroke: the elderly, African Amer-icans, and men.4-7
Community education that includes teaching how to identify a stroke and the need for prompt medical attention after stroke onset has been shown effective.8-10 Studies have demonstrated a
particular need for community education in urban Citation: Yvonne Chan YF, Richardson LD, Nagurka R, Hao K, Zaets SB,Brimacombe MB, Bentley S, Levine SR.
and medically underserved areas predominantly home to ethnic minorities.1
Various educational programs for stroke pa-tients and their caregivers have been proposed to increase stroke awareness and provide stroke edu-cation. They include seminars, community educa-tional programs, and stroke educaeduca-tional cam-paigns.8-15 Investigations into interventions to
in-crease stroke knowledge in the community have studied audio-visual programs, brochures, and personal counseling. Application of a wide spec-trum of these methods seems to have achieved the best results; however, the effectiveness of the-se programs remains unproven.
There continues to be a need for increased stroke education, and the ED waiting room may be an ideal location due to a high volume of pa-tients, many of who are at high risk for stroke. The almost continual, large-scale, captive audience of patients and visitors in the ED allows for fo-cused stroke education. There are limited data concerning public health education in the ED de-voted to alcohol and tobacco use, domestic vio-lence and stroke.16-20
The aim of this pilot study was to compare dif-ferent methods of stroke education for use in an ED waiting room and to determine which ap-proach is the most effective.
Materials and Methods
Study design
This study was conducted at University Hospital in Newark, NJ in 2005. Subject selection was based on the last digit of an individual's medical record number. Student research assistants ap-proached only Fast Track (triaged to urgent care) patients waiting in the ED waiting room with a medical record number ending in an odd or even number (based on a computer generated list). Sub-jects were enrolled after signing a written in-formed consent form approved by our Institu-tional Review Board. We studied a convenience sample because subjects were recruited only when our research assistants were available. Over the course of the study, recruitment was conducted during various times over seven days of the week
from 10 am to 10 pm Research assistants were college and medical students trained to adhere to the study protocol.
We compared five different methods of stroke education: 1) Video group: viewed a 12-minute educational stroke video developed by the Ameri-can Stroke Association; 2) Counseling group: ceived one-to-one instruction from a trained re-search assistant who covered the same infor-mation presented in the video which lasted 15 minutes; 3) Brochure group: received a brochure containing the same information presented in the video (time varied per individual, but lasted no more than 20 minutes); 4) Combination group: received a combination of the three aforemen-tioned methods (average 1 hour); and 5) Control group: received no intervention. The content of the educational intervention was identical in all intervention groups and the post-test was devel-oped to test knowledge of this information.
Participants in the video group were individu-ally conducted to a separate viewing room. The material contained in the two-page brochure summarized the information in the video and some parts of the brochure were verbatim from the video. Similarly, the education received from the one-to-one counseling was scripted and cov-ered the material in the brochure. Educational ef-ficacy was assessed via improvement from pre-test to post-test scores.
Setting
The setting was a 504-bed urban, inner city, teaching hospital, with an ED serving over 82,000 patients annually. The hospital is a designated re-gional stroke center that treats over 700 stroke patients annually. ED patients were primarily low-income African Americans.
Selection of participants
age of 18, non-English speaking, psychiatrically or cognitively impaired, under arrest, or incarcerated.
Ethical Considerations
The Institutional Review Board of the Univer-sity of Medicine and Dentistry of New Jersey ap-proved this study.
Data collection
Consenting individuals were randomized into one of the four intervention groups or the control group. A list of random numbers was generated using SPSS-PC 9.0 (SPSS Inc., Chicago, IL), to allow equal assignment into the five groups. Pa-tient assignments were placed in consecutively numbered sealed envelopes and attached to in-formed consent forms. All intervention group subjects received the same information via their assigned method about stroke risk factors, warn-ing signs, and the immediate actions to be taken after the onset of stroke symptoms. We allotted approximately 10-15 minutes per subject. All of the subjects were brought to the same study room and informed that there would be a post-test re-gardless of their group assignments. Participants were educated by three research assistants who were trained to use the same technique and teach-ing script. Those in the control group received no education.
Each of the five groups completed a 13 ques-tion pre-test to assess baseline stroke knowledge (Appendix 1). The test assessed knowledge of top-ics including stroke risk factors, warning signs and symptoms, and the requisite immediate actions if signs and symptoms are present. The test was conducted in written format with answer sets pro-vided as multiple-choice options. All questions had one correct answer weighted equally for a to-tal possible score of 13. Each educational method covered all the information needed to complete successfully the quiz.
We pilot-tested the quiz on 100 subjects of varying educational backgrounds prior to this and our previous project.19 There was a positive
corre-lation between test scores and educational lev-el/medical experience. Results from the pilot test
indicated that the test accurately reflects stroke knowledge.
After completion of the intervention, the par-ticipants in the intervention groups were again given the same test (post-test). At one-month fol-low-up, the participants were given the identical 13-question quiz by phone. The participants were not provided with correct answers or their final test scores at any time during the study.
Methods of measurement
The 13-question test was used to assess base-line stroke knowledge. Measurement of improved stroke knowledge was determined by increased scores from pre-test to post-test. There was no predetermined score for clinically sufficient stroke knowledge. The main outcome measurement was comparison of pre-test to post-test scores.
Primary data analysis
We employed linear models to conduct pair-wise comparison between groups in term of test-ing scores: Y ~ G, where Y denotes the testtest-ing scores and G denotes groups defined by educa-tion methods or time points. Given multiple tests were performed in this study, we corrected the P value using Bonferroni methods assuming 10 in-dependent tests, that is pcorrected = pnominal 10. The
level of Bonferroni corrected statistical signifi-cance was set at P<0.05. A power analysis deter-mined 45 subjects per group as the sample size needed for 80% power to detect 20% differences in test scores. Data were analyzed using SPSS 9.0 for Windows (SPSS Inc., Chicago, IL), and pre-sented as a Mean ± Standard Deviation.
Results
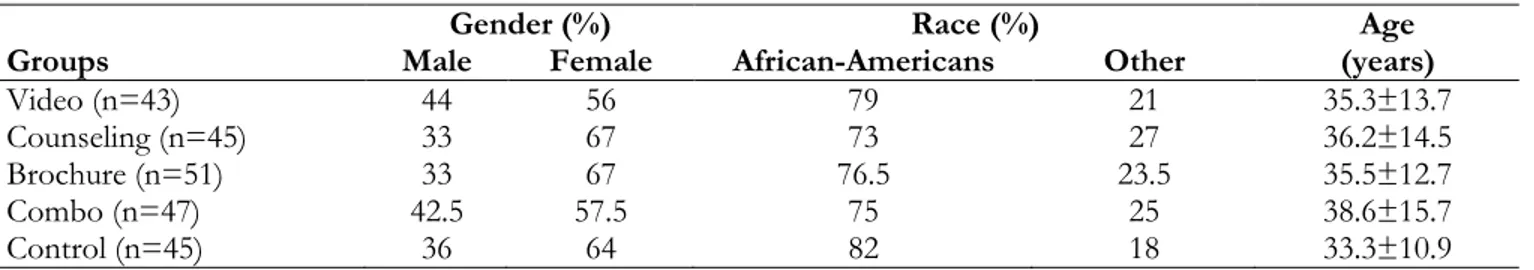
Table 1: Patient demographic parameters
Gender (%) Race (%) Age
(years)
Groups Male Female African-Americans Other
Video (n=43) 44 56 79 21 35.3±13.7
Counseling (n=45) 33 67 73 27 36.2±14.5
Brochure (n=51) 33 67 76.5 23.5 35.5±12.7
Combo (n=47) 42.5 57.5 75 25 38.6±15.7
Control (n=45) 36 64 82 18 33.3±10.9
All differences among the compared groups are insignificant
Table 2: Participants’ level of education
Level of Education Control
(%)
Intervention (%)
Elementary School 1.4 2.5
Incomplete High School 18.3 17.7
Completed High School 42.3 44.3
Vocational School 1.4 3.4
Incomplete College 23.2 22.8
Completed College 10.5 6.3
Advanced Degree 2.1 2.5
Unknown 0.8 0.5
Immediately after the intervention, all four groups demonstrated significant improvement in stroke knowledge. All post-intervention test scores were significantly higher than pre-interven-tion and control values (Table 3). Absolute values of post-intervention scores did not significantly differ among the groups. However, the relative increase in pre-test to post-test intervention test scores was the highest in the Combination group: 72±44.9% vs. 53±48.2% for the Video group, 45±42.8% for the Counseling group, and 36±38.1% for the Brochure group, respectively.
Table 3: Stroke knowledge test results
Groups Pre-Intervention Score Post-intervention Score 1 Month Follow-Up Score
Video (n=43) 6.9±2.4 9.7±2.5* 6.7±2.3x
Counseling (n=45) 7.7±2.3 10.3±2.0* 8.2±2.4xz
Brochure (n=51) 7.2±2.5 9.4±2.5* 8.3±2.5z
Combo (n=47) 6.7±2.6 10.1±2.4* 9.4±2.4y
Control (n=45) 6.7±2.6 - -
P<0.01 vs. Pre-Intervention Score & Control/x P <0.01 vs. Post-Intervention Score
z P <0.01 vs. Control/y P <0.01 vs. Pre-Intervention Score, Control & Video 1 Month Follow-Up Score
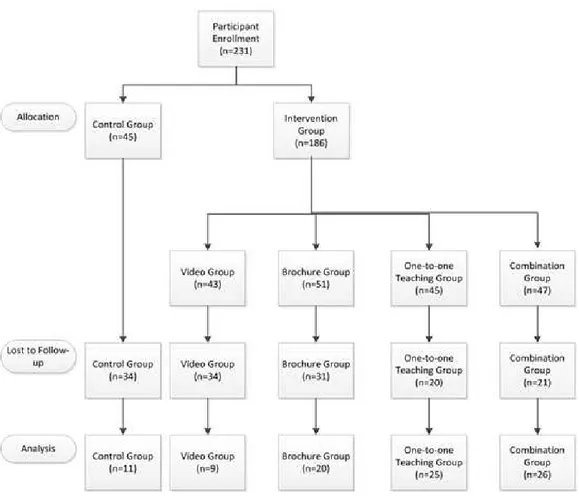
We successfully contacted 90 (39%) of the par-ticipants for the one-month follow-up (Figure 1). We made up to 10 attempts at contact for each participant. At one-month follow-up, the Combi-nation group again demonstrated the best stroke knowledge. However, this difference was statisti-cally significant only compared to the Video group. The Combination group did not show a signifi-cant decrease in test scores compared with the immediate post-intervention test. Follow-up test scores for the Brochure group did not signifi-cantly decrease compared with the immediate
Figure 1:Enrollment flow diagram
Discussion
Our pilot study demonstrated that all of the various methods of stroke education used, namely a video program, individual counseling, and a bro-chure all produced measurable, immediate results. However, each method failed to provide a long-lasting increase in knowledge when assessed sepa-rately. Only participants in the Combination group did not show a decrease in their test scores at one-month follow-up versus their immediate post-test results.
Our data show that a combination of different educational methods can be successfully imple-mented in ED waiting rooms to educate patients about stroke. These results are similar to those obtained by other programs focusing on educating stroke patients and their caregivers. For example, the program of Rodgers et al. included a one-hour
in-patient seminar followed by six one-hour sessions after hospital discharge.8 The authors provided information about the nature of stroke, rationale of treatment, and prevention of future strokes. Test scores six months afterwards were signifi-cantly higher among members of the intervention group than among the control group.
A very limited number of studies examine stroke knowledge retention after community edu-cational programs. DeLemos et al. have shown that a community program that includes health screening, stroke education, and counseling re-sulted in a 35% increase in knowledge of stroke symptoms.12 Three months after the intervention,
A public campaign was able to increase stroke knowledge.21 The main tools used by mass media for this campaign included board advertising, bro-chures and posters, radio and television public service announcements, and news stories. The authors demonstrated a decline from 43% to 22% in the number of people who were unable to name even a single warning sign of stroke. Unfor-tunately, the study design did not assess knowledge retention following the conclusion of the campaign.
The effectiveness of different methods of edu-cation for the public in this manner has not yet been extensively studied. It may be that public education about such topics as stroke awareness needs to take into account language and reading ability, educational level, and the specific modes by which people learn best.
Limitations
Our study had several potential weaknesses. The low follow up rate may bias the results and conclusions of the study. It examined individuals over a large age range instead of focusing on pa-tients 60 and over who are most affected by stroke. Since this age group is most at risk for stroke, they may be more interested in learning about it. We did not enroll non-English speaking subjects or control for race/ethnicity so we do not know if different ethnicities/cultural groups re-spond differently to the various educational meth-ods. We did not assess our subjects’ literacy or evaluate for possible differences in effectiveness between the assistants providing counseling. An-other limitation of our study was that it did not examine whether the participant could identify warning signs and take appropriate action during an actual stroke. Lastly, it remains unclear whether interventions will influence patients to modify their behavior positively.
Conclusion
Numerous studies have demonstrated the need for stroke education because public knowledge of signs and symptoms of this disease remains low.
The present study assessed the effectiveness of different educational techniques used in an ED waiting room. The study demonstrates that the exposure to any of the four educational interven-tions (videotape, one-to-one teaching, brochure reading, or a combination of the three) signifi-cantly improves short-term awareness and under-standing of stroke. However, only a combination of these methods provides knowledge retention at one-month follow-up. Additional studies are needed to determine the best method to improve retention of stroke knowledge.
Acknowledgements
No funding sources utilized. The authors declare that there is no conflict of interest.
References
1. Kothari R, Sauerbeck L, Jauch E, Broderick J, Brott T, Khoury J, et al. Patient's awareness of stroke signs, symptoms, and risk factors. Stroke
1997;28:1871-1875. doi:10.1161/01.str.28.10.1871
2. Pancioli AM, Broderick J, Kothari R, Brott
T, Tuchfarber A, Miller R, et al. Public per-ception of stroke warning signs and potential
risk factors. JAMA 1998;279:1288-1292.
doi:10.1001/jama.279.16.1288
3. Williams LS, Bruno A, Rouch D, Marriott DJ. Stroke patients’ knowledge of stroke: influence on time to presentation. Stroke 1997;28:912-915. doi:10.1161/01.str.28.5.912
4. Samsa GP, Cohen SJ, Goldstein LB, Bonito
AJ, Duncan PW, Enarson C, et al. Knowledge of stroke risk among patients at increased risk for stroke. Stroke 1997;28:916-921.doi:10.1161/01.str.28.5.916
5. Sacco RL, Boden-Albala B, Gan R, Chen X,
Kargman DE, Shea S, et al. Stroke incidence among white, black, and Hispanic residents of an urban community: The Northern Manhattan stroke study. Am J Epidemiol 1998;147:259-268. doi:10.1093/oxfordjournals.aje.a009445
6. Rosamond WD, Folsom AR, Chambless LE,
in communities (ARIC) cohort. Stroke
1999;30:736-743.doi:10.1161/01.str.30.4.736
7. Broderick J, Brott T, Kothari R, Miller R, Khoury
J, Pancioli A, et al. The greater Cincin-nati/Northern Kentucky stroke study: prelimi-nary first-ever and total incidence rates of stroke
among blacks. Stroke 1998;29:415-421.
doi:10.1161/01.str.29.2.415
8. Rodgers H, Atkinson C, Bond S, Suddes M,
Dobson R, Curless R. Randomized controlled tri-al of a comprehensive stroke education programs for patients and caregivers. Stroke 1999;30:2585-2591.doi:10.1161/01.str.30.12.2585
9. Stern EB, Berman ME, Thomas JJ, Klassen AC.
Community education for stroke awareness. An
efficacy study. Stroke 1999;30:720-723.
doi:10.1161/01.str.30.4.720
10. Glanz K, Marger SM, Meehan EF. Evaluation of
a peer educator stroke education program for the
elderly. Health Educ Res 1986;1:121-130.
doi:10.1093/her/1.2.121
11. Greenlund KJ, Neff LJ, Zheng Z-J, Keenan NL,
Giles WH, Ayala CA, et al. Low public recogni-tion of major stroke symptoms. Am J Prev Med
2003;25:315-325.
12. DeLemos CD, Atkinson RP, Croopnick SL,
Wentworth DA, Akins PT. How effective are “community” stroke screening programs at improving stroke knowledge and preven-tion practices? results of a 3-month
follow-up study. Stroke 2003;34:247-249.
doi:10.1161/01.str.0000098901.97350.7d
13. Morgenstern LB, Staub L, Chan W, Wein TH,
Bartholomew LK, King M, et al. Improving de-livery of acute stroke therapy: the TLL Temple Foundation stroke project. Stroke 2002;33:160-166. doi:10.1161/hs0102.101990
14. Alberts MJ, Perry A, Dawson DV, Bertels C.
Ef-fects of public and professional education on re-ducing the delay in presentation and referral of
stroke patients. Stroke 1992;23:352-356.
doi:10.1161/01.str.23.3.352
15. Fortmann SP, Vardy AN. Effects of a
communi-ty-wide health education program on cardiovascu-lar disease mortality: the Stanford Five-City
pro-ject. Am J Epidemiol 2000;152:316-323.
doi:10.1093/aje/152.4.316
16. Mello MJ, Nirenberg TD, Longabaugh R,
Woolard R, Minugh A, Becher B, et al. Emergen-cy department brief motivational interventions for alcohol with motor vehicle crash patients. Ann
Emerg Med 2005;45:620-625.
doi:10.1016/j.annemergmed.2005.01.026
17. Vokes NI, Bailey JM, Rhodes KV. “Should I give
my smoke lecture now or later?” Characterizing emergency physician smoking discussions and
cessation counseling. Ann Emerg Med
2006;48:406-414.
doi:10.1016/j.annemergmed.2006.03.037
18. Bair-Merritt MH, Mollen CJ, Yau PL, Fein JA. Impact of domestic violence posters on female caregivers’ opinions about domestic violence screening and disclosure in a pediatric emergency department. Pediatr Emerg Care 2006;11:689-693. doi:10.1097/01.pec.0000238742.96606.20
19. Chan YF, Lavery R, Fox N, Kwon R, Zinzuwadia
S, Massone R, et al. Effect of an educational video on emergency department patient stroke
knowledge. J Emerg Med 2008;34:215-220.
doi:10.1016/j.jemermed.2007.04.003
20. Yvonne Chan YF, Nagurka R, Richardson LD,
Zaets SB, Brimacombe MB, Levine SR. Effec-tiveness of stroke education in the emergency de-partment waiting room. J Stroke Cerebrovasc Dis
2010;19:209-215.
doi:10.1016/j.jstrokecerebrovasdis.2009.04.009
21. Dornan WA, Stroink AR, Pegg EE, Kattner KA,
Appendix 1
The test
Emergency Department Patient Education Center Stroke Quiz
Circle the correct answer(s) for each of the following ques-tions:
1) Where does stroke rank among the nation’s leading
causes of death? a. First b. Third c. Fifth d. Twelfth
2) What is a stroke?
a. A blood clot that stops the flow of blood to a limb
b. The heart slows and nearly stops func-tioning
c. Blood flow to the brain is interrupted or a blood vessel in the brain bursts
d. All of the above
3) Where in the body does a stroke occur? a. Heart
b. Brain c. Lung d. Stomach
4) Which of the following is a risk factor for stroke? (There is more than one correct answer)
a. High blood pressure b. Asthma
c. Diabetes d. Obesity e. Cancer
5) Which of the following will LOWER your chances of having a stroke?
a. Reading every day
b. Having high blood pressure c. Exercising 30 minutes a day d. Being overweight or obese e. All of the above
6) What will INCREASE your risk of having a stroke?
a. Intense physical activity b. Taking drugs like aspirin c. Having low cholesterol d. Smoking cigarettes
7) What can cause a stroke? a. Bleeding into the brain
b. Blockage of blood vessel to the brain c. Both of the above
d. None of the above
8) On average, compared to other Americans,
African-Americans…
a. Are five times more likely to die from a stroke
b. Are twice as likely to die from a stroke c. Are less likely to die from a stroke d. Are just as likely to die from a stroke
9a) Which of the following is a warning sign of stroke? (There is more than one correct answer)
a. Trouble speaking b. Chest pain c. Severe headache d. Sudden numbness e. Shortness of breath
9b) Which of the following is a warning sign of stroke? (There is more than one correct answer)
a. Trouble walking b. Pain in the left arm
c. Sudden blurry vision or loss of vision d. Sudden confusion
e. Racing heartbeat
10) What should you do if you see someone with the warning signs of stroke or if you are experiencing them yourself?
a. Call your doctor b. Call 911
c. Drive to the hospital d. Lie down and rest e. Take an aspirin
11) How long after you see signs of stroke in either yourself or someone else should you call for help?
a. In a half an hour if the person is not at all better
b. Up to 24 (twenty-four) hours c. Right away
d. Right away after you take an aspirin
12) Untreated stroke may result in which of the follow-ing (There is more than one correct answer):