U
NIVERSIDADE DE
L
ISBOA
F
ACULDADE DE
C
IÊNCIAS
D
EPARTAMENTO DE
Q
UÍMICA E
B
IOQUÍMICA
Study of drug formulations and development of
immunosensing interfaces with membrane model
systems
Mestrado em Bioquímica
Especialização em Bioquímica
Telmo Manuel Oliveira Paiva
Dissertação orientada por:
ii
i
Contents
Acknowledgments/Agradecimentos ... iii
Resumo ... v
Palavras-Chave ... ix
Abstract ... xi
Keywords ... xii
List of abbreviations and symbols ... xiii
Part I - Study of m-cresol effects on membrane biophysical properties
using model membrane systems ... 1
1. Introduction ... 4
2. Materials and Methods ... 6
3. Results ... 10
4. Discussion ... 19
5. References ... 22
Supplementary Material ... 25
Part II – Construction of Novel Sensitive Biosensing Interfaces for
Tumor Markers Detection ... 27
1. Introduction ... 30
2. Characterization Techniques ... 33
3. Methods ... 44
4. Results and Discussion ... 45
5. Conclusions and Future Work ... 54
6. Acknowledgments ... 55
Concluding remarks ... 57
iii
Acknowledgements/Agradecimentos
First, I would like to thank to my supervisors, Doctor Rodrigo de Almeida and
Doctor Ana Viana, for all the support and trust, motivation and encouragement and, most
of all, for the time spent teaching me.
To Professor Jorge Correia, leader of the Interfacial Electrochemistry Group for
all the trust and kindness.
I am also very grateful for the opportunity given by my supervisors and Professor
Gang Jin, to collaborate with the 7
thSino-Portugal Scientific and Technological
Cooperation of 2013-2015, in Beijing, for a month. To Doctor Niu, I would like to thank
all the support given during my stay there and for the wise tips. I am also grateful for all
the help that Liu and Kang gave me, particularly to carry out the experiments and for the
guidance during my stay in a new and unfamiliar city.
I thank to Fundação para a Ciência e Tecnologia for the research project
PEst-OE/QUI/UI0612/2013, and PEst 2015-2020 (UID/MULTI/00612/2013), and IF
2012/2013; IF/00808/2013/CP1159/CT0003 (POPH, Fundo Social Europeu).
Gostaria, ainda de agradecer aos colegas de laboratório, Filipa Santos, Joaquim
Marquês, André Bastos, Ana Carreira, Catarina Antunes e Inês Almeida, por toda a
incansável ajuda e ensinamentos. Ao Joaquim, à Filipa e à Ana que, por terem estado
mais presentes, agradeço os seus brilhantes ensinamentos, a sua disponibilidade,
prontidão e simpatia
Aos meus amigos, Andreia, Alexandra e Ângela, sempre presentes, agradeço por
todos os momentos que passámos juntos. À Andreia, especialmente, agradeço a
prontidão, ajuda e, acima de tudo, pelos dias bem passados e pelas gargalhadas. À Cleide
que, apesar da distância física, esteve sempre presente, agradeço a motivação e carinho.
À minha família, sem o quais isto não teria sido possível, agradeço o apoio e acima de
tudo a confiança que em mim depositaram.
Por fim, a todos aqueles que, de mais ou menos perto me seguiram nesta fase,
agradeço o apoio, o incentivo e toda a paciência.
iv
v
Resumo
Grande parte dos processos bioquímicos encontra-se associada às membranas
biológicas enquanto estruturas capazes de delimitar variados compartimentos e,
simultaneamente, desempenhar funções ao nível da sinalização, comunicação e
transmissão de informação, bem como de servir de suporte a inúmeras moléculas
essenciais a esses processos bioquímicos. A capacidade de desempenhar todos estes
papéis prende-se com o facto de as membranas biológicas apresentarem uma complexa
estrutura, possuindo na sua composição, para além de inúmeras proteínas, um vasto leque
de moléculas lipídicas, conferindo-lhes diversas propriedades físicas características. Por
si só, os lípidos são caracterizados por uma elevada diversidade estrutural, quer ao nível
da região hidrófila, quer ao nível das cadeias alifáticas, que podem diferir no seu
comprimento, no grau de insaturação hidroxilação, etc. Assim, no sentido de perceber
toda esta complexidade, diferentes sistemas modelo capazes de mimetizar as membranas
biológicas têm surgido, tendo como ponto de partida a estrutura da bicamada lipídica
proposta por Gorter e Grendel, em 1925.
Estes modelos, cujo tamanho, geometria e composição podem ser adaptados face
aos objectivos, têm sido amplamente utilizados no estudo de processos tão variados como
o comportamento de diferentes fases lipídicas ou mesmo a fusão de membranas. Os
sistemas modelo de biomembranas vão desde sistemas de bicamadas lipídicas em
suspensão (lipossomas) com diferentes tamanhos e diferente número de bicamadas, a
bicamadas lipídicas suportadas (SLBs). Nos estudos com sistemas modelo, uma vasta
gama de técnicas de caracterização biofísicas pode ser aplicada, incluindo diferentes
espectroscopias, como a espectroscopia de fluorescência e a espectroscopia de
infravermelho com transformada de Fourier (FTIR), e diferentes técnicas de caraterização
de superfície, tais como a microscopia de força atómica (AFM), a elipsometria, ainda que
pouco utilizada, e a ressonância do plasmão de superfície. A interacção de pequenas
moléculas com interesse biológico com biomembranas tem sido um tópico amplamente
estudado recorrendo aos sistemas modelo. Os sistemas compostos por monocamadas
lipídicas suportadas foram ainda utilizados, neste trabalho, na criação e desenvolvimento
de imunossensores, os quais podem ser utilizados como importantes ferramentas de
diagnóstico de diversas patologias.
Na primeira parte deste trabalho, que se encontra escrita sob a forma de um artigo
para publicação, estudou-se a interacção de um derivado fenólico, o m-cresol
(3-vi
metilfenol), com a membrana biológica segundo diferentes perspectivas. Para tal,
recorrendo a dois tipos de sistemas modelo membranares, os lipossomas e as SLBs, foram
empregues duas técnicas de caracterização, a espectroscopia de fluorescência e a AFM.
O m-cresol é um excipiente frequentemente utilizado em elevadas concentrações
em diversas formulações farmacêuticas e, recentemente, tem sido associado a diversos
casos de toxicidade após utilização de formulações prescritas para o tratamento da
diabetes. No entanto, os efeitos da sua interacção com membranas biológicas
encontram-se ainda por decifrar. Utilizando lipossomas constituídos por misturas ternárias de
1-palmitoil-2-oleoil-sn-glicero-3-fosfocolina (POPC) / N-palmitoil-esfingomielina (PSM) /
Colesterol (Chol), nas proporções adequadas para abranger a linha de conjugação que
contém a proporção equimolar 1:1:1 do diagrama de fases publicado para esta mistura,
em presença de fase líquido desordenado (l
d), líquido ordenado (l
o) e coexistência de
ambas. O POPC é um dos glicerofosfolípidos mais abundante nas membranas celulares
de organismos eucariotas, a PSM o principal esfingofosfolípido em membranas celulares
de mamíferos e o Chol o esterol que se encontra em níveis mais elevados nas mesmas.
Esta mistura foi escolhida por representar um modelo bem estabelecido que mimetiza a
formação de jangadas lipídicas.
Através de medidas de anisotropia de fluorescência em estado estacionário, de
decaimentos de fluorescência e de medidas de transferência de energia por ressonância
de Förster (FRET), utilizou-se a fluorescência intrínseca do m-cresol para inferir acerca
do seu comportamento na presença de lipossomas (vesículas unilamelares grandes
(LUVs)). Para além disso, recorreu-se a sondas de fluorescência de membrana para
melhor
caracterizar
esta
interacção:
nitrobenz-2-oxa-1,3-diazol-4-il)-1,2-dipalmitoil-sn-glicero-3-fosfoetanolamina, sal trietilamónio (NBD-DPPE) e
N-(7-nitrobenz-2-oxa-1,3-diazol-4-il)-1,2-dioleoil-sn-glicero-3-fosfoetanolamina
(NBD-DOPE), que têm preferência pelas fases l
oe l
d, respectivamente;
4-(2-(6-(dibutilamino)-2-naftalenil)etenil)-1-(3-sulfopropil)-piridínio (di-4-ANEPPS), que permite extrair
informação acerca do estado de hidratação da bicamada; ácido trans-parinárico (t-PnA),
que traduz o grau de empacotamento das cadeias acilo dos fosfolípidos e N-(lissamina
rodamina B sulfonil)-1,2-dioleoil-sn-3-fosfatidiletanolamina (Rhod-DOPE), que, foi
usado em medidas de FRET como aceitador com NBD-DPPE enquanto dador, permitem
concluir acerca de alterações do tamanho das jangadas lipídicas. Paralelamente,
utilizando SLBs depositadas em mica, compostas por misturas ternárias de
1,2-dioleoil-sn-glicero-3-fosfocolina (DOPC)/PSM/Chol na proporção 2:2:1, um sistema que
vii
apresenta coexistência de fases l
de l
oe mimetiza jangadas lipídicas, foram efectuados
estudos de AFM para avaliar em tempo real os efeitos causados pelo m-cresol nas
jangadas lipídicas.
Os resultados obtidos permitiram concluir que os efeitos do m-cresol sobre as
bicamadas lipídicas deverão inicialmente estar restritos à sua superfície, sem perturbação
das cadeias acilo dos fosfolípidos. Esta interacção superficial deverá fazer-se notar
principalmente ao nível das zonas de interface entre as fases l
de l
o, levando ao
desaparecimento das jangadas lipídicas com o tempo e com o aumento da concentração
de m-cresol. Globalmente, observou-se que o m-cresol apresenta preferência por fases l
o,
através da do alinhamento do seu momento dipolar com o dipolo da bicamada lipídica,
levando ao desaparecimento das jangadas lipídicas. Como exemplo de uma formulação
farmacêutica de insulina humana contendo elevadas concentrações de m-cresol, foi
utilizada a Humulina®, uma das formulações mais utilizadas no tratamento da diabetes.
Foram efectuados os mesmos estudos na presença desta formulação e os efeitos
observados são semelhantes aos que se observaram na presença de m-cresol, ainda que
de uma forma menos acentuada. Isto poderá indicar que, quando inserido em formulações,
o m-cresol apresenta efeitos adversos, ainda que uma parte deles possa ser atenuada pela
interacção com os outros componentes da formulação.
A segunda parte deste trabalho, realizada no âmbito da Sétima Cooperação
Científica e Tecnológica Sino-Portuguesa (2013-2015) sob o tema “Construction of
Novel Sensitive Biosensing Interfaces for Tumor Markers” foi parcialmente realizada no
“Institute of Mechanics, Chinese Academy of Sciences, Beijing”. Recorrendo a modelos
membranares depositados em substratos de ouro, teve como objectivo a construção de
interfaces para imunossensores estáveis, biomiméticos e que reduzam a adsorção
não-específica de proteínas, recorrendo a uma técnica avançada, pouco recorrente e com
elevada capacidade de detecção, a elipsometria de imagem de reflexão interna total
(TIRIE).
Como ponto de partida, foi utilizada uma abordagem já testada com
ditiocarbamatos (DTCs) imobilizados em superfícies de ouro para o biorreconhecimento
específico de anticorpos e antigénios. Este método é particularmente útil, na medida em
que permite a modificação da superfície do ouro e a imobilização de ligandos,
nomeadamente a proteína A (que permite uma orientação correcta do anticorpo que a ela
se liga posteriormente) em apenas um passo e, para além disso, não é necessário recorrer
à activação dos grupos dos grupos funcionais para a imobilização covalente do anticorpo.
viii
Para além de IgG e Anti-IgG, esta plataforma foi testada com o antigénio específico da
próstata (PSA) e anti-PSA por TIRIE. Esta técnica foi utilizada para a deteccção e
monitorização em tempo real do reconhecimento do anticorpo e respectivo antigénio pelo
immunosensor imobilizado no substrato de ouro. Globalmente foi possível mostrar que
os DTCs imobilizados em ouro podem ser utilizados no reconhecimento de PSA e
Anti-PSA e, portanto, devem ser encarados enquanto possíveis interfaces para a detecção
específica de marcadores tumorais.
Ainda no sentido do desenvolvimento de imunossensores, foi testada e optimizada
uma nova abordagem recorrendo à deposição de fosfolípidos sobre uma monocamada
auto-montada (SAM) depositada num substrato de ouro. Para a formação da SAM
utilizou-se 11-amino-1-undecanetiol, que se liga fortemente à superfície do ouro por meio
de um grupo tiol. Após activação do grupo carboxilo estrategicamente localizado na
extremidade da cadeia acilo do
1-miristoil-2-(14-carboximiristoil)-sn-glicero-3-fosfocolina (DMPC-COOH), este foi depositado sobre a SAM, ligando-se
covalentemente ao seu grupo amina, localizado na sua extremidade. Entre as moléculas
de DMPC-COOH foram posteriormente inseridas moléculas de ácido 2-hidroxioleico
que, contendo também um grupo carboxílico numa extremidade, pode ser activado para
imobilizar proteínas covalentementemente. Entre cada um dos passos da construção do
imunossensor acima descritos foi utilizada elipsometria convencional para estimar a
espessura da superfície, confirmando assim a correcta execução de cada passo de
modificação. Com o mesmo objectivo foram também efectuadas experiências de AFM
como forma de visualização da topografia da superfície durante a construção do
imunossensor. Tal como anteriormente, a técnica de TIRIE foi utilizada para monitorizar
o reconhecimento específico dos anticorpos e respectivos antigénios (IgG e Anti-IgG) e,
como complemento, foi também utilizada a técnica de SPR. Com este estudo mostrou-se
que esta plataforma apresenta algum potencial enquanto imunossensor capaz de evitar
interacções não específicas, um dos requisitos necessários para a construção de um
biossensor. Para além disto, foi demonstrada a possibilidade da utilização de fosfolípidos
modificados para a construção de monocamadas estáveis, que podem ser aplicadas como
componentes de biossensores.
Com o trabalho apresentado ao longo desta dissertação mostra-se, uma vez mais,
a importância da utilização de sistemas modelo na mimetização das membranas
biológicas e enquanto versáteis ferramentas, quer para o estudo de fenómenos associados
ix
ao comportamento das biomembranas no seu contexto natural, quer para o
desenvolvimento de importantes plataformas usadas na detecção de patologias.
Palavras-Chave
- Sistemas modelo de biomembranas;
- m-cresol;
- Espectroscopia de fluorescência.
- Biofuncionalização de superfícies de ouro;
- Construção e desenvolvimento de imunossensores;
xi
Abstract
Different model membrane systems have been developed and improved over the
years, in order to study the complexity associated with the structure and function of
biological membranes. These models retain the lipid bilayer structure, and their size,
geometry and composition can be tailored regarding the goals of each specific study. They
include free-standing lipid bilayers (liposomes), whit several sizes and layers, and
supported lipid bilayers (SLBs). The studies employing membrane model systems can be
performed with a wide range of biophysical characterization techniques, such as
spectroscopies, namely fluorescence spectroscopy, surface characterization techniques,
like atomic force microscopy (AFM) and ellipsometry.
In this work, biomembrane model systems were applied regarding two different
perspectives. Firstly, m-cresol interaction with biological membranes was studied in
liposomes (large unilamellar vescicles (LUVs)) with several fluorescence spectroscopy
techniques and SLBs with AFM. m-cresol is an excipient widely used in pharmaceutical
formulations, like Humulin, a formulation prescribed to diabetes treatment. Recently,
several studies have reporting cases of toxicity associated with m-cresol usage but, despite
that, its effects on biomembranes are not described. The steady state fluorescence
anisotropy and fluorescence lifetime results, both of m-cresol intrinsic fluorescence and
membrane fluorescent probes, in combination with real-time AFM experiments, show
that m-cresol interacts with lipid bilayers superficially, leading to the bilayer components
reorganization. Furthermore, it keeps this ability when integrated in Humulin, but with
less intensity.
The purpose of the second part of the work was the building of biosensing
interfaces to avoid protein non-specific adsorption using different gold modifications.
The previously reported dithiocarbamate (DTC) formation principle on gold substrates
was used to test prostate specific antigen (PSA) and anti-PSA, showing that this
immunosensor platform can be employed in tumor markers detection. One more complex
approach, based on utilization of self-assembled monolayers (SAMs) and modified lipids,
was also tested. The covalent immobilization of IgG and Anti-IgG was successfully
achieved with this immunosensor interface that may be used to avoid non-specific
adsorption. The immunosensors construction was followed by conventional ellipsometry
xii
and AFM and its performance was monitored using surface plasmon resonance (SPR)
and total internal reflection imaging ellipsometry (TIRIE).
Keywords
- Model membrane systems;
- m-cresol;
- Gold surfaces modification;
- Fluorescence spectroscopy;
xiii
List of abbreviations and symbols
Abbreviations
Acceptor
A
AFM
Atomic Force Microscopy
BB
Blocking Buffer
BSA
Bovine Serum Albumin
CCD
Charge-Coupled-Device
CDI
Carbonyldiimidazole
Chol
Cholesterol
D
Donor
DTC
Dithiocarbamate
di-4-ANEPPS
4-(2-(6-(Dibutylamino)-2-naphthalenyl)ethenyl)-1-(3-sulfopropyl)-pyridinium inner salt
DMPC
1,2-dimyristoyl-sn-glycero-3-phosphocholine
DMPC-COOH
1-myristoyl-2-(14-carboxymyristoyl)-sn-glycero-3-phosphocholine
DOPC
1,2-dioleoyl-sn-glycero-3-phosphocholine
EDC
1-ethyl-3-(3-dimethylaminopropyl) carbodiimide
FBS
Fetal Bovine Serum
FRET
Förster’s Resonance Energy Transfer
HOPG
Highly Ordered Pyrolytic Graphite
LUV
Large Unilamellar Vesicles
MLV
Multilamellar Vesicles
NBD-DOPE
xiv
NBD-DPPE
N-(7-nitrobenz-2-oxa-1,3-diazol-4-yl)-1,2-dipalmitoyl-sn-glycero-3-phosphoethanolamine, triethylammonium salt
NHS
N-hydroxysuccinimide
POPC
1-palmitoyl-2-dioleoyl-sn-glycero-3-phosphocholine
PSA
Prostate Specific Antigen
PSM
N-palmitoyl-D-erythro-sphingosylphosphorylcholine
Rhod-DOPE N-(lyssamine rhodamine B
sulfonyl)-1,2-dioleoyl-sn-3-phosphatidylehanolamine ammonium salt
SAM
Self-assembled Monolayer
SLB
Supported Lipid Bilayer
PSM
N-palmitoyl-sphingomyelin
SPR
Surface Plasmon Resonance
SUV
Small Unilamellar Vesicles
TIRIE
Total Internal Reflection Imaging Ellipsometry
t-PnA
trans-parinaric acid
UV
Ultraviolet
X
Molar Fraction
Symbols
d
Thickness
Δ
Ellipsometric phase parameter
𝒇
𝟎Resonant frequency, Hz
k
Extinction coefficient
l
dLiquid disorded
xv
n
Refractive index or number of electrons
𝑵
̃
Complex refractive index
θ
Angle of incidence or propagation
Ψ
Ellipsometric amplitude parameter
t
Time, s
<r>
Fluorescence anisotropy
𝑹𝒑
𝑹𝒔
Fresnel coefficients in p and s directions
T
Absolute temperature, K
1
Part I
Study of m-cresol effects on membrane biophysical
properties using model membrane systems
3
Study of m-cresol effects on membrane biophysical properties using
model membrane systems
Telmo O. Paiva, André E. P. Bastos, Joaquim T. Marquês, Ana S. Viana, Rodrigo F. M.
De Almeida*
Centro de Química e Bioquímica, DQB, Faculdade de Ciências da Universidade de Lisboa, Campo Grande, Ed. C8, 1749-016 Lisboa, Portugal
*Corresponding author. Tel: +351 217500924; Fax: +351 2175500088. E-mail address: [email protected]
Abstract
m-cresol is a preservative used in numerous pharmaceutical formulations, including parenteral
insulin and vaccines. Humulin® is one such form of insulin containing high levels of m-cresol. Therefore, we studied the effects of m-cresol alone and in Humulin® on membrane model systems containing raft-like liquid ordered domains (lo), in order to understand the effects that this
compound, when present in pharmaceutical formulations, can have on human cell membranes, which might in turn explain its toxicological effects.
The intrinsic fluorescence of m-cresol was first studied, showing that it interacts with liposomes and furthermore, this interaction is strongly dependent on membrane lipid composition. Liposomes were also labeled with several membrane probes spanning a range of in-depth locations and with preference for distinct lipid domains. The probes located at the bilayer core reported no effect, whereas for the more superficial probes, m-cresol induced a significant intensity-weighted fluorescence lifetime decrease and again a membrane composition dependence.
Real-time imaging was carried out by atomic force microscopy (AFM), on ternary supported lipid bilayers (SLB). It was observed that upon addition of m-cresol in the µM range, a small reduction of the lo phase fraction occurs without changing its thickness. For higher m-cresol concentrations,
raft-like domains totally disappeared. All the changes observed occur in less than one hour. m-cresol contained in Humulin® has qualitatively similar effects, but much less pronounced. As a whole, we show that m-cresol interacts with the membrane surface, affecting lipid raft organization. In Humulin®, the presence of other components probably decreases the amount of
4
1. Introduction
Cresol was for the first time identified in 1851 and the three cresol isomers (o-, m- and p-cresol) in 1896 [1]. Currently, they are used in different areas, such as textiles industries, as bactericide and fungicide in agriculture, in cosmetic industry as antiseptics and fragrances, as industrial solvents in synthetic processes, in pharmaceutical industry and in many others around the world [1-3]. Naturally, they are formed as metabolites from enzymatic oxidation of toluene [2] and menthofuran [3] and are components of foods and drinks, being widely disseminated in nature [1]. For that reason, its toxicity has deserved a great attention and there are several toxicity studies reporting quite a lot of side effects caused by exposure to cresol [2-5]. These effects include severe inflammation of mucous membranes and central nervous system [2] and hepatic injury that leads to death [6]. The toxicity has been well described for the three isomers and, usually, p-cresol is consider the most toxic isomer and its toxicity implicates reactive intermediates formation [2], like reactive oxygen species, contributing to atherosclerosis and thrombosis [3]. Despite that, the degree of cell killing observed using rat liver slices in presence of p-cresol, can be achieved using a 5- to 10-fold higher concentration of either o- or m-cresol. Moreover, oral LD50s of all isomers are very similar [2] and m-cresol (Figure 1) was determined, by the Environmental Protection Agency from U.S. Department of Health and Human Services, as a possible human carcinogen [7].
Dentistry is another field of cresols application [3, 8]. In conjugation with formaldehyde, they have been used in production of dentistry products, as a component of dental materials and devices, as solvent and as disinfectant. Therefore, exposure to formocresol, via inhalation, has been subject of special concern regarding its mutagenic and carcinogenic potential as well as possible damage of central nervous system [9-11]. According to these studies lipid peroxidation increases after exposure to cresols as a consequence of free radicals production, which may induce changes in membrane fluidity and permeability [10].
Given the ability of phenolic compounds and specially, cresols, to act as antiseptics and stabilizers of protein aggregation [12], they have been widely used in commercial pharmaceutical formulations [13, 14]. Firstly, they were described as preservatives in insulin formulations [14] used to prevent bacterial growth and to stabilize insulin molecules during storage and transport [15]. More recently, m-cresol and other phenolic derivatives were also described as excipients [16], used mainly with the intent of preserve insulin hexameric form and maintain the sterility of solution. Despite the problematic toxic effects known, cresols are used in substantial amounts in these formulations. One example is Humulin that contains m-cresol 2.5 mg/mL and human insulin 100 U/mL, which represents c.a. 38-fold higher concentration of m-cresol. Humulin is a human insulin injection formulation synthesized through rDNA technology and prescribed to improve
5 glycemic control in patients with type 1 and type 2 diabetes mellitus. It also contains glycerin 16 mg/mL, endogenous zinc (approximately 0.015 mg/100 U) and water. Some of its side effects comprise swelling of hands and feet and heart failure. The most common problem concerning insulin pumps like Humulin are complications associated with continuous subcutaneous insulin infusion. These complications involve skin irritation and local inflammation at the infusion site and seem to be associated to m-cresol presence in large amounts, through an interference with body defense mechanisms [5]. Patients who used insulin formulation containing m-cresol had a significantly higher inflammation rate than those who used insulin with methyl p-hydroxylbenzoate [4]. Comparing pure m-cresol with insulin formulations containing m-cresol, the level of toxicity was similar and even a short exposure to m-cresol induces cell death, whereas insulin solution without excipients did not cause cell death [16].
m-cresol interaction with synthetic phospholipid liposomes was studied for the first time
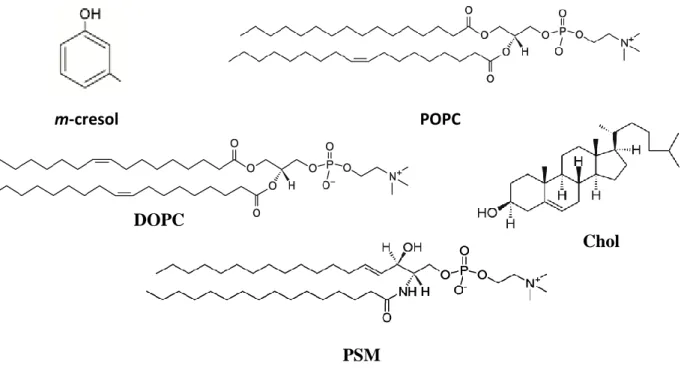
by differential scanning calorimetry [8]. It was shown that m-cresol is capable of induce changes in phase transition temperature and in enthalpy of the transition from gel to a liquid-crystalline phase. However, m-cresol effects concerning cell membrane are not well established and there is a lack of information about its fluorescence properties. Thus, the purpose of this work is to present a detailed biophysical characterization of the interaction between m-cresol and lipid bilayers in order to understand the potential effects caused by this compound on cell membrane. Humulin was used as an example of a formulation containing high amounts of this excipient. Its fluorescence properties were evaluated in presence of liposomes containing well characterized binary mixtures and a ternary mixture of the type low transition temperature/high main-transition temperature/Chol to mimic lipid rafts [17]. Using atomic force microscopy (AFM) with supported lipid bilayers (SLB), m-cresol and Humulin effects were evaluated in real-time. The chemical structures of m-cresol and lipid molecules used in this work are represented in Figure 1. 1-palmitoyl-2-dioleoyl-sn-glycero-3-phosphocholine (POPC) is one of the most abundant glycerophospholipids of eukaryotic organisms’ cell membranes, N-palmitoyl-sphingomyelin (PSM) is the central sphingolipid of the animal cell membranes and Cholesterol (Chol) is the sterol that exists in higher amounts [18].
6
Figure 1. Structural formula of m-cresol and of the lipid molecules used in this work.
2. Materials and Methods 2.1. Chemicals
1,2-Dioleoyl-sn-glycero-3-phosphocholine (DOPC), 1-palmitoyl-2-dioleoyl-sn-glycero-3-phosphocholine (POPC), N-palmitoyl-sphingomyelin (PSM) and N-(lyssamine rhodamine B sulfonyl)-1,2-dioleoyl-sn-3-phosphatidylehanolamine ammonium salt (Rhod-DOPE) were purchased from Avanti Polar Lipids (Alabaster, AL); Bovine insulin, Cholesterol (Chol), minimum 99%, and Ludox (colloidal silica diluted to 50 wt% in water) were purchased from Sigma-Aldrich (Barcelona, Spain). trans-parinaric acid (t-PnA), 4-(2-(6-(Dibutylamino)-2-naphthalenyl)ethenyl)-1-(3-sulfopropyl)-pyridinium inner salt (di-4-ANEPPS), N-(7-nitrobenz-2-oxa-1,3-diazol-4-yl)-1,2-dipalmitoyl-sn-glycero-3-phosphoethanolamine, triethylammonium salt (NBD-DPPE) and
N-(7-nitrobenz-2-oxa-1,3-diazol-4-yl)-1,2-dioleoyl-sn-glycero-3-phosphoethanolamine (NBD-DOPE) were purchased from Invitrogen (Madrid, Spain). m-Cresol was obtained from MERCK (Germany) and Humulin® REGULAR 100 UI/mL from Lilly Lda. (Portugal), containing m-cresol 2.5 mg/mL. Other reagents were of the highest purity available. Two buffers were used for hydration of lipid mixtures: i) 10 mM Hepes, 150 mM NaCl, pH 7.4 (HEPES buffer) ; ii) 2.70 mM K2HPO4, 1.50 mM NaH2PO4, 150 mM NaCl, pH 7.4 (PBS).
POPC
DOPC
PSM
Chol
7
2.2. Phospholipid, cholesterol, m-cresol and fluorescent probes quantification
The phospholipid concentration was determined gravimetrically and by inorganic phosphate quantification [19]. Cholesterol quantification was made by gravimetry. m-cresol concentration was determined spectrophotometrically using ε (270nm) = 2.34 M−1 cm-1 [20].
Probe concentrations in stock solutions (spectroscopic grade solvents) were determined spectrophotometrically using ε (NBD-DPPE or DOPE, 465 nm, chloroform) = 21 × 103 M−1 cm−1;
ε (Rhod-DOPE, 559 nm, chloroform) = 95 × 103 M−1 cm−1; ε (t-PnA, 299.4 nm, ethanol) = 89 ×
103 M−1 cm−1, ε (di-4-ANEPPS, 497 nm, methanol) = 42 × 103 M−1 cm−1 [21].
2.3. Lipid Mixtures and Multilamellar Vesicles (MLV) Preparation
In AFM studies the ternary mixture DOPC/PSM/Chol 2:2:1 was employed. In fluorescence spectroscopy studies, three different systems were used (POPC/PSM/Chol, POC/Chol and POPC/PSM). For ternary system, the several mixtures prepared had the following molar proportions of each lipid component 80/20/0; 71.8/23.1/5.1; 60/23.1/5.1; 48.5/29.3/22.2; 33.3/33.3/33.3 and 25.2/35.5/39.3. These compositions were selected to span the tie line containing the 1:1:1 equimolar mixture, taken from the ternary phase diagram [17]. For binary system POPC/Chol, the molar proportions of each component were 0/100; 5.1/94.9; 14/86; 22.2/77.8; 33.3/66.7 and 39.9/60.7 and for system POPC/PSM were 0/100; 20/80; 30/70; 40/60; 50/50; 60/40; 70/30; 80/20 and 100/0. Lipid stock solutions and lipid mixtures were prepared with spectroscopic grade chloroform. The solvent was slowly evaporated under a mild flow of nitrogen, followed by overnight vacuum. MLV suspensions were prepared by hydration of the mixtures with either HEPES buffer for small unilamellar vescicles (SUV) and SLB preparation, or PBS for large unilamellar vesicles (LUV) preparation and progressively suspended by vortex stirring and freeze-thaw cycles (T>50°C).
2.4. SLB preparation and interaction with m-cresol
SUV (total lipid concentration 1mM) were obtained by power sonication (Hielscher, UP200S). 150 µL of the resulting suspension with 5mM CaCl2 were deposited on freshly cleaved
mica (Veeco) and incubated for 1h at 60°C. After this incubation step, the SLB samples were left at room temperature for 1h to cool and then washed several times with HEPES buffer [22].
The SLB samples were initially covered with 80 μL of HEPES buffer. After AFM imaging in a region of interest, successive additions of higher concentrations of m-cresol and Humulin were performed with at least 2 hours between each one. The same region was imaged several times between and after each addition of m-cresol. Successive additions of HEPES buffer and insulin were also performed as control.
8
2.5. AFM Imaging
In situ AFM measurements were performed at room temperature using a Multimode
Nanoscope IIIa Microscope (Digital Instruments, Veeco). Topographic images were taken with a scan rate of ca. 2 Hz in tapping mode. Before each experiment, the glass block holding the cantilever was washed several times with water and ethanol. The cantilevers used were made of silicon nitride (NPS, ca. 0.58 N/m of spring constant, Veeco) with a resonance frequency in liquid of about 9 kHz. In many cases, regions with small defects, and where the lipid domains had distinctive shapes were chosen, in order to easily identify the changes in lateral organization of the membrane. The images presented in this study are representative of each sample (the observations are uniform for the whole sample); at least 3 independent experiments on freshly prepared SLB have been performed. To obtain the thickness values (or thickness differences) for each sample, at least 10 different topographic profiles were drawn, and the median value taken. The most representative profiles were selected for the figures shown. The relative area corresponding to the different types of domains in each image was calculated using the software ImageJ.
2.6. LUV preparation and interaction with m-cresol
Large unilamellar vesicles (LUV) (total lipid concentration 1mM) were prepared by standard procedures [23]. LUV were formed by extrusion (Avanti Mini-Extruder) at 60°C, by forcing the MLV suspension 21 times through polycarbonate filters with pore diameter of 100 nm (Nucleopore, Whatman). The probe/lipid ratio used was 1:500 (mol/mol) for t-PnA, 1:1000 for NBD-DOPE and NBD-DPPE, 1:200 for Rhod-DOPE and 1:500 for di-4-ANEPPS. All probes, except t-PnA and di-4-ANEPPS were incorporated in lipid mixtures with lipid stock solutions. After extrusion, samples were kept overnight at 4°C protected from light. Before the measurements, samples were slowly brought to room temperature and incubated with pure m-cresol 30 µM or Humulin containing m-m-cresol 100µM and 1mM at least one hour before. In control experiments, measurements were performed with and without the presence of m-cresol, Humulin and insulin.
2.7. Fluorescence Spectroscopy Measurements
Fluorescence measurements were performed at room temperature in 1.0cm x 0.4cm quartz cuvettes using a Spex Fluorolog 3-22/Tau 3 spectrofluorometer (Horiba Jobin Yvon) equipped with double grating monochromators in both excitation and emission light paths. For steady-state measurements, the excitation and emission wavelengths were respectively 275nm and 303nm for m-cresol and Humulin, 303nm and 405nm for t-Pna, 468nm and 536nm for NBD-DPPE and NBD-DOPE, 467nm and 599nm for di-4ANEPPS and 570nm and 593nm for Rhod-DOPE. The steady-state anisotropy (r) was calculated according to Equation 1 [24].
9 𝑟 = (𝐼𝑉𝑉− 𝐺 × 𝐼𝑉𝐻)(𝐼𝑉𝑉+ 2𝐺 × 𝐼𝑉𝐻) 𝐸𝑞. 1
in which G is the instrumental correction factor. Subscripts V and H represent the vertical and horizontal orientations of the polarizers, and the order of the subscripts corresponds to excitation and emission. An adequate blank was subtracted from each intensity reading. The set of the 4 intensity components for each sample was measured 7 times.
The fluorescence intensity decays were obtained by the single photon counting technique using a nanoLED N-320 (Horiba Jobin-Yvon) for the excitation of t-Pna and emission wavelength was 405nm. For the excitation of di-4-ANEPPS and NBD-DPPE and NBD-DOPE Nano-LED N-460 was used and emission wavelength was 599nm and 536nm, respectively. For Rhod-DOPE, nanoLED N-560 was used for the excitation and emission wavelength was 593nm. Ludox scattering was used to obtain the instrumental response function and the background (obtained with the black sample) was subtracted from the decay. Data analysis was performed using the software TRFA v1.4 (Scientific Software Technologies Center, Minsk, Belarus). Fluorescence decays were analyzed by fitting a sum of exponentials as shown in Equation 2,
𝐼(𝑡) = ∑ 𝛼𝑖 𝑛 𝑖=1 exp (− 𝑡 𝜏𝑖 ) 𝐸𝑞. 2
where i and i are the normalized amplitude and lifetime of the component i, respectively. The
mean intensity-weighted fluorescence lifetime <τ> was obtained through Equation 3,
< 𝜏 >= ∑ 𝛼𝑖𝜏𝑖2 ∑ 𝛼⁄ 𝑖𝜏𝑖 𝐸𝑞. 3
The quality of the fit was judged by a reduced 2 value close to 1 and random distribution of
weighted residuals and residuals autocorrelation.
All the data represents the mean ± standard deviation of at least 3 independent samples.
2.8. FRET Measurements
NBD-DPPE/Rhod-DOPE (Donor (D)/Acceptor (A)) pair with lipid ratio 1:1000/1:200 was chosen for FRET between lo and ld phases [25]. FRET efficiency, E, was obtained from the
time-resolved fluorescence intensity curves, for each sample, through Equation 4,
𝐸 = 1 −𝜏̅𝐷𝐴 𝜏̅𝐷
𝐸𝑞. 4
Where 𝜏̅ is the amplitude-weighted fluorescence lifetime of the probe in the presence of the donor only (𝜏̅𝐷) and with both donor and acceptor (𝜏̅𝐷𝐴).
10
3. Results
3.1. Interactions of m-cresol with biomembranes evaluated through intrinsic fluorescence properties of m-cresol and insulin
m-cresol interactions with lipid bilayers mimicking the outer leaflet of mammalian plasma
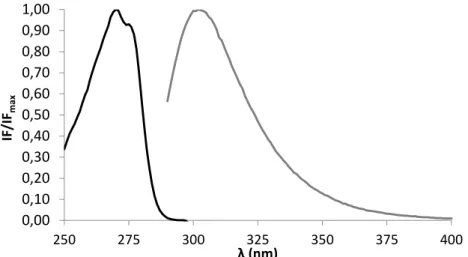
membrane were evaluated through its intrinsic fluorescence properties. m-cresol maximum fluorescence excitation occurs at 270 nm and maximum of fluorescence emission at 302 nm (Figure 2). The excitation and emission spectra measured (Figure 2) are in agreement with previously reported data [26].
Figure 2. Normalized excitation (black line) and emission (gray line) spectra of m-cresol at room
temperature. The represented spectra are the median of at least 3 independent experiments. This excipient is a phenol derivative [1] and displays absorption and emission in the UV region of the electromagnetic spectrum [27], similarly to other phenol derivatives such as the aromatic amino acid tyrosine. Thus we used this feature of m-cresol to assess directly its adsorption to lipid bilayers and their consequences without the need of using external probes and still taking advantage of the high sensitivity of fluorescence spectroscopy. The system POPC/PSM/Chol was chosen as a lipid raft model with different lipid proportions accordingly with the tie-line that contains the mixture 1:1:1 in the phase diagram [17].Using these proportions,
m-cresol effects were evaluated in presence of a liquid ordered (lo) and a liquid disordered phase
(ld) and in coexistence of both, since phase boundaries are well established with very small
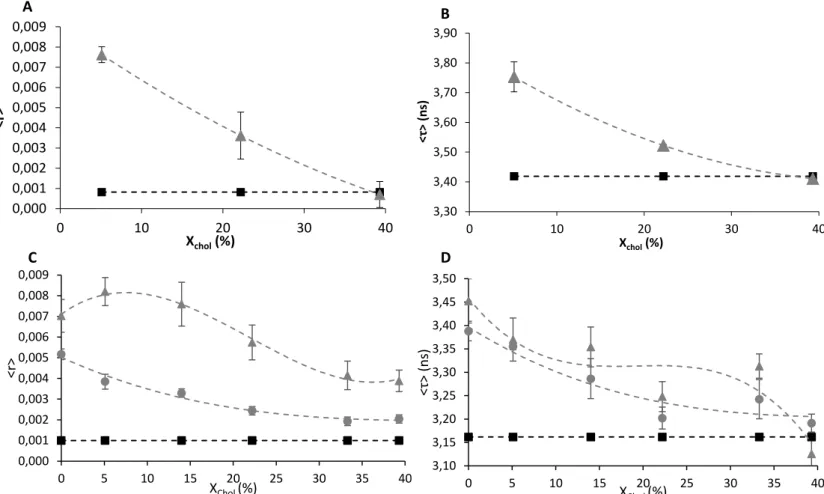
uncertainty. The steady-state fluorescence anisotropy of m-cresol (Figure 3- A) increased in presence of liposomes, suggesting that its rotational dynamic is reduced. The intensity-weighted average fluorescence lifetime (Figure 3 - B), that is proportional to the steady-state fluorescence intensity, follows the same trend, confirming that m-cresol mobility is in fact reduced as a result of the interaction with liposomes and that the microenvironment of the molecule is changed significantly. Furthermore, this interaction depends on membrane lipid composition, since the values tend to decrease as the content in PSM/Chol becomes higher. This could indicate that
m-0,00 0,10 0,20 0,30 0,40 0,50 0,60 0,70 0,80 0,90 1,00 250 275 300 325 350 375 400 IF /IF m ax λ (nm)
11 cresol may interact more profoundly with disordered domains. However, the shape of both curves suggests that m-cresol interaction with ordered domains should be preferred, because small fractions of lo are sufficient to induce a noticeable change in the photophysical parameters of
m-cresol.
Regarding Humulin, since it is composed by two species with intrinsic fluorescence properties, insulin and m-cresol, anisotropy values obtained should be the weighted sum of the individual anisotropies of these two fluorophores, by anisotropy additivity law [24]:
𝑟𝐻𝑢𝑚𝑢𝑙𝑖𝑛 = 𝑓𝐼𝑛𝑠𝑢𝑙𝑖𝑛𝑟𝐼𝑛𝑠𝑢𝑙𝑖𝑛+ 𝑓𝑚−𝑐𝑟𝑒𝑠𝑜𝑙𝑟𝑚−𝑐𝑟𝑒𝑠𝑜𝑙 𝐸𝑞. 5
where r is the anisotropy value and f is the fractional intensity. The fractional intensity of each specie depends on its molar fraction and fluorescence quantum yield. Since insulin fluorescence emission is mainly due to the four tyrosine residues, an amino acid residue with aromatic group, [28] and m-cresol is a phenolic compound, quantum yield of each specie should be similar. Thus, the difference between m-cresol and insulin contribution to Humulin anisotropy is mainly due to their molar fraction. It is known that in Humulin formulation, m-cresol molar concentration is ca. 38-fold higher than insulin concentration (Eli Lilly and Company) which explains why anisotropy values obtained for m-cresol are comparable to the ones obtained for Humulin (Figure 3 – C). Insulin anisotropy value in presence of liposomes is much larger than m-cresol anisotropy values (c.a. 0.06), and it does not change (data not shown) regarding the lipid composition.
Additionally, Humulin steady-state anisotropy (Figure 3 – C) and intensity-weighted mean fluorescence lifetimes (Figure 3 – D) exhibit the same behavior than pure m-cresol in presence of the ternary lipid bilayers (Figure 3 – A, B), increasing with the same dependency on lipid phase. These results show that m-cresol in Humulin formulation is also able to interact with the membrane. Upon increase of m-cresol concentration, anisotropy and intensity-weighted mean fluorescence lifetime values slightly decrease, indicating that with the increase in m-cresol concentration, the system becomes more complex and a simple membrane/water partition of m-cresol is not sufficient to quantitatively describe the data.
12
Figure 3. Steady-state fluorescence anisotropy (A) and intensity-weighted average fluorescence
lifetime (B) of pure m-cresol 30µM. Both measurements were performed in the absence (square) and presence of LUVs (POPC/SM/Chol ternary mixtures with molar proportions indicated in Materials and Methods) (triangle). Steady-state fluorescence anisotropy (C) and intensity-weighted average fluorescence lifetime (D) of Humulin containing m-cresol 100 µM (triangle) and 1 mM (circle). Both measurements were performed also in absence of Humulin (square). The values are the mean ± standard deviation of at least 3 independent experiments. The dotted lines are merely guides for the eye. All experiments were performed at room temperature.
3.2. Interactions of m-cresol with biomembranes evaluated through membrane fluorescent probes
The highly used excipient m-cresol is able to interact with models of the mammalian plasma membrane outer leaflet, both alone, and when present in an insulin formulation used for human diabetes therapy. Thus, it can be anticipated that the interaction of m-cresol, both alone and in the formulation may have effects on membrane lipid organization/biophysical properties. Thus, to fully characterize these interactions, it was necessary to label liposomes with several membrane probes spanning a range of in-depth locations and with preference for distinct lipid domains and biophysical properties (e.g. [29-31]).Two different head-labelled phospholipid analogues localized at the membrane interface [32] were used, NBD-DPPE which partitions preferentially into lo phase [18, 33] and NBD-DOPE which partitions preferentially into ld phases [34]. Upon
0,000 0,001 0,002 0,003 0,004 0,005 0,006 0,007 0,008 0,009 0 10 20 30 40 <r > Xchol(%) 3,30 3,40 3,50 3,60 3,70 3,80 3,90 0 10 20 30 40 <τ > (n s) Xchol(%) 0,000 0,001 0,002 0,003 0,004 0,005 0,006 0,007 0,008 0,009 0 5 10 15 20 25 30 35 40 <r> XChol (%) 3,10 3,15 3,20 3,25 3,30 3,35 3,40 3,45 3,50 0 5 10 15 20 25 30 35 40 <τ > (n s) XChol (%) A B A C D
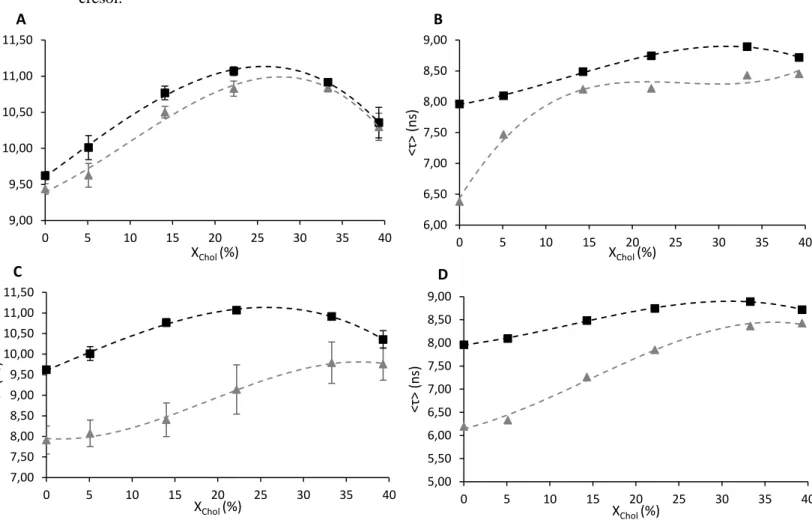
13 addition of m-cresol, both NBD-DPPE (Figure 4 – A) and NBD-DOPE (Figure 4 – B) intensity-weighted average fluorescence lifetimes decreased, indicating that m-cresol locates preferentially, at least in a first stage, at the membrane surface of both ordered and disordered domains. Moreover, this interaction should preferentially affects disordered domains, since the magnitude of the variation is smaller in the case of NBD-DPPE (Figure 4 – A) and the amplitude-weighted mean fluorescence lifetime values follow the same trend with and without the presence of m-cresol.
Figure 4. Intensity-weighted average fluorescence lifetime of NBD-DPPE in absence (square)
and in presence (triangle) of pure m-cresol 30 µM (A) and m-cresol 100 µM from Humulin (C); Intensity-weighted average fluorescence lifetime of NBD-DOPE in absence (square) and in presence (triangle) of pure m-cresol 30µM (B) and m-cresol 1mM from Humulin (D). Both measurements were performed in presence of LUVs (POPC/SM/Chol ternary mixtures with molar proportions indicated in Materials and Methods) at room temperature. The values are the mean ± standard deviation of at least 3 independent experiments. The dotted lines are merely guides for the eye.
Additionally, the probe di-4-ANEPPS was used to address the hypothesis that m-cresol interaction with the membrane surface may implicate surface charge effects such as an alteration of membrane dipole potential as a result of an increased hydration. Since it is known that Chol increases membrane dipole potential [35], di-4-ANEPPS is also sensitive to the presence of Chol and Chol-enriched domains [36] and its fluorescence lifetime increases with the amount of Chol,
A 9,00 9,50 10,00 10,50 11,00 11,50 0 5 10 15 20 25 30 35 40 <τ > (n s) XChol (%) 6,00 6,50 7,00 7,50 8,00 8,50 9,00 0 5 10 15 20 25 30 35 40 <τ > (n s) XChol (%) 5,00 5,50 6,00 6,50 7,00 7,50 8,00 8,50 9,00 0 5 10 15 20 25 30 35 40 <τ > (n s) XChol (%) 7,00 7,50 8,00 8,50 9,00 9,50 10,00 10,50 11,00 11,50 0 5 10 15 20 25 30 35 40 <τ > (n s) XChol (%) B C D
14
independently of the bilayer phase [30]. As expected, the intensity-weighted average fluorescence lifetime increases with the conversion of ld phase in lo (Figure 5) and its values are not affected
by the presence of m-cresol. This result shows that m-cresol does not induce any changes on membrane hydration or solvent relaxation processes.
Figure 5. Intensity-weighted average fluorescence lifetime of di-4-ANEPPS in absence (square)
and in presence (triangle) of pure m-cresol 30µM in LUVs of POPC/SM/Chol ternary mixtures with molar proportions indicated in Materials and Methods at room temperature. The values are the mean ± standard deviation of at least 3 independent experiments. The dotted lines are merely guides for the eye.
In order to understand if m-cresol effects are restricted to the membrane surface or if it also interacts with the hydrophobic core of the lipid bilayer, the intensity-weighted mean fluorescence lifetime of the probe trans-parinaric (t-PnA) was measured in the presence of m-cresol. t-PnA is a very useful probe to assess even subtle changes in the organization of lipid rafts and ordered domains, both in membrane model systems [37, 38], and in living cell membranes [30, 39]. In addition, it provides information about the phospholipids acyl chains packing, since its chromophore is integrated inside the bilayer core [40]. The intensity-weighted average fluorescence lifetime of t-PnA (Figure 6) seems not to be significantly affected by the presence of m-cresol, even when its concentration increases 10-fold. With conversion of ld phase into lo,
t-PnA intensity-weighted average fluorescence lifetime values are slightly more affected by the presence of m-cresol. Interestingly, the intensity-weighted average fluorescence lifetime of t-PnA which is already longer in the lo [37] becomes slightly longer. Rather than leading to a decreased
packing in the more ordered and compact lo domains, as could be intuitively expected, it seems
to have an opposite effect. The major conclusion is, however, that m-cresol effects on membrane do not occur at the hydrophobic core level and it only adsorbs to the surface, probably involving H-bonding of the phenol OH group with the lipid headgroups.
1,00 1,50 2,00 2,50 3,00 3,50 4,00 4,50 0 5 10 15 20 25 30 35 40 <τ > (n s) XChol (%)
15
Figure 6. Intensity-weighted average fluorescence lifetime of t-PnA in the absence (square) and
presence of m-cresol 30µM (circle) and 300 µM (triangle) in LUVs of POPC/SM/Chol ternary mixtures with molar proportions indicated in Materials and Methods at room temperature. The values are the mean ± standard deviation of at least 3 independent experiments. The dotted lines are merely guides for the eye.
3.3. Interactions of m-cresol with lipid rafts evaluated in real-time by AFM
As previously shown, by fluorescence spectroscopy, m-cresol effects on bilayer seem to be restricted to the bilayer surface and dependent on the lipid phase. To clarify these effects, in situ tapping-mode AFM was performed to follow real-time detailed morphological and structural changes induced by m-cresol on SLB. For that purpose, ternary mixtures of DOPC/PSM/Chol with molar ratio of 2:2:1 were used to form SLB containing raft-like liquid ordered domains on mica (Figure 7). According to the phase diagram [41], by using this lipid proportion, at room temperature, two liquid phases are assembled, with both PSM and Chol preferentially localized in lo phase (thicker) surrounded by DOPC in ld phase (thinner) [42]. In absence of m-cresol
(Figure 7 – A) coexistence of lo and ld domains in the predicted proportions [43] is evident (Table
1) and the thickness gap between them is close to 1 nm (Table 1, Figure 7), as previously reported [22]. Upon addition of m-cresol, a gradual decrease in size and number of small lo domains is
observed (Figure 7). Both effects are clearly depicted in the circles drawn in Figure 7, for 300 µM
m-cresol concentration. Despite that, ld phase remains apparently unchanged with no detectable
thickness variation (Table 1, Figure 7). For higher m-cresol concentration (successive addition), lo small domains reduction is even clearer and lo fraction tends to decrease concomitantly with an
increasing of the ld fraction. Upon ca. two hours exposure of SLB to the highest m-cresol
concentration (3 mM), lo domains totally disappear (Figure 7 - E), meaning that m-cresol effects
are both time and concentration-dependent. In fact, these effects on SLB are undoubtedly caused by m-cresol interaction, since scanning the surface repeatedly does not change significantly the domains morphology (Figure S1). The same experiments were performed with addition of Humulin comprising the same range of m-cresol concentrations (Figure 8). On the whole, Humulin effects on SLB are identical to those of m-cresol, promoting a progressive disruption of
5,00 7,00 9,00 11,00 13,00 15,00 17,00 19,00 21,00 23,00 0 5 10 15 20 25 30 35 40 <τ > (n s) XChol (%)
16
lo domains. These effects should be a consequence of an interaction with lo/ld boundaries since
that first they lead to the disappearance of small lo domains and then to the entire lo fraction.
Interestingly, for each m-cresol concentration, the percentage of lo reduction is lower after
addition of Humulin than when pure m-cresol is added. For example, after addition of Humulin containing 300 µM m-cresol, only 8% of lo fraction is lost (Table 1) but, in presence of the same
concentration of pure m-cresol lo fraction is reduced by 11%. Moreover, in presence of 3000 µM
pure m-cresol, all lo fraction is converted into ld fraction (Table 1) and, in presence of Humulin
containing m-cresol in a concentration 10-fold higher (3 mM), lo fraction was reduced only in
46%. These results show that m-cresol, per se, interacts with lipid rafts in a more damaging way than when it is contained in Humulin.
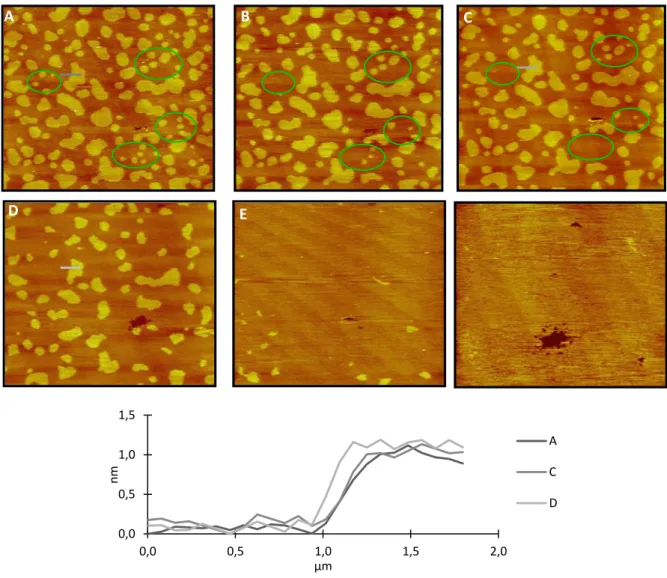
Figure 7. m-cresol interaction with a bilayer displaying ld/lo phase separation (lipid rafts) on mica.
AFM image of an SLB composed by DOPC/PSM/Chol (2:2:1 mol:mol:mol) deposited on mica, in the absence of cresol (A), 1h (B), 2h (C) after the addition of cresol 300µM and 5min (D), 1h (E), and 2h (F) after the addition of m-cresol 3 mM in Hepes buffer. Circles show changes in lipid rafts shape after addition of m-cresol. The inset shows the topographical profiles corresponding to the colored lines in panels A – D. The images were obtained in a liquid cell at room temperature. The images correspond to an area of 20x20µm2. Z = 5nm.
A B A 0,0 0,5 1,0 1,5 0,0 0,5 1,0 1,5 2,0 nm µm A C D B A B C D B E B
17
Table 1. Percentage of reduction of the area occupied by lo phase on SLB deposited on mica and
height difference between lo and ld phases after addition of both pure m-cresol and Humulin. lo,
liquid ordered; ld, liquid disordered. Calculations were performed based on AFM topographic
images after 2h exposure to pure m-cresol and Humulin.
Pure m-cresol Humulin
[Cresol] (μM) lo Area Reduction (%) Domain Height Difference (nm) lo Area Reduction (%) Domain Height Difference (nm) 0 0 1.0 ± 0.2 0 1.2 ± 0.1 3 0 1.0 ± 0.2 0 1.2 ± 0.1 30 9 1.1 ± 0.1 8 1.3 ± 0.1 300 17 0.9 ± 0.1 8 1.3 ± 0.1 3000 100 - 46 1.3 ± 0.1
18
Figure 8. Humulin interaction with a bilayer displaying ld/lo phase separation (lipid rafts) on mica.
AFM image of an SLB composed by DOPC/PSM/Chol (2:2:1 mol:mol:mol) deposited on mica, in the absence of Humulin (A), 1h (B), 2h (C) after the addition of Humulin containing m-cresol 300µM and 5min (D), 1h (E), and 2h (F) after the addition of Humulin containing m-cresol 30mM in Hepes buffer. Circles show changes in lipid rafts shape after addition of Humulin. The inset shows the topographical profiles corresponding to the colored lines in panels A – D. The images were obtained in a liquid cell at room temperature. The images correspond to an area of 20x20µm2. Z = 7nm. B A C D E F 0,0 0,5 1,0 1,5 2,0 0,0 0,5 1,0 1,5 2,0 nm µm A C E
19
4. Discussion
The current work presents a detailed study of the effects of an excipient highly used in pharmaceutical formulations, m-cresol, on lipid bilayers mimicking the outer leaflet of mammalian plasma membrane. For that purpose, fluorescence spectroscopy and atomic force microscopy techniques were applied to study the effects of this compound on lipid model membranes displaying different lipid phases and lipid raft-forming ternary mixtures. The experiments were performed with pure m-cresol and compared with Humulin, an example of a commercial pharmaceutical formulation containing m-cresol, showing that when this excipient is incorporated in a formulation, its effects are still detectable.
For the first time, m-cresol steady-state fluorescence anisotropy (Figure 3 – A) and intensity-weighted average fluorescence lifetime (Figure 3 – B) were measured. We demonstrated that m-cresol intrinsic fluorescence is a valid tool to study m-cresol dynamics and its interaction with biomembrane models, namely lipid bilayers. Through these measurements, it was unequivocally shown that m-cresol interacts with lipid bilayers. With steady-state fluorescence anisotropy it was shown that, in presence of liposomes, m-cresol mobility is more restricted as compared to the aqueous medium. Intensity-weighted average fluorescence lifetime results show a decrease in the number of collisions between m-cresol and water molecules or buffer ions and, at the same time, a reduction on polarity of the medium in presence of liposomes which, by itself, may have influence on m-cresol fluorescence properties. Moreover, a less polar environment may prevent the formation of dimers or clusters between different m-cresol molecules and therefore, the probability of occurrence of self-quenching will be smaller than that in aqueous medium without presence of liposomes.
Another important hallmark of m-cresol is the distinct behavior in presence of distinct lipid phases, showing that the biophysical properties of these phases play an important role in the interaction. It seems that ld phase is more affected by m-cresol than lo phase, in which steady-state
fluorescence anisotropy (Figure 3 – A) and intensity-weighted average fluorescence lifetimes (Figure 3 – B) exhibit smaller values. Nevertheless, this result does not mean that in presence of lo phase, m-cresol does not interact with the bilayer and the small values obtained may be due to
a self-quenching and energy transfer phenomena between m-cresol molecules. These possibilities can occur when m-cresol molecules are located at the membrane surface between phospholipid heads and they are close enough to allow the occurrence of these phenomena. This explanation is corroborated by the results obtained with the NBD-labeled lipids (Figure 4), since the observed intensity-weighted average fluorescence lifetime decrease can be caused by dynamic self-quenching or by the hydration increase at the bilayer core. The results obtained with t-PnA (Figure 6) suggest then that m-cresol should act preferentially on membrane surface and not at the
20
hydrophobic core level, and the decrease of the intensity-weighted average fluorescence lifetime is only explained by dynamic self-quenching phenomena.
The observation of m-cresol effects on SLB composed by raft-forming mixtures through AFM showed notoriously a preferential interaction with lo/ld domains boundaries (Figure 7) in
such a way that leads to a progressive reduction of the lipid rafts size over time and for higher concentrations, to the elimination of the ordered phase. Once again, this observation is confirmed by the results from fluorescence spectroscopy with NBD probes (Figure 4) and di-4-ANEPPS (Figure 5), indicating that m-cresol effects are related essentially with an alteration on lipid phase proportions and the size of lo domains. Additionally, results obtained from FRET experiments
(Figure S2) are in agreement with this behavior, since FRET efficiency between the donor, localized in lo phase, and the acceptor, with preference for ld phase, decreases in presence of
m-cresol. This result is in agreement with the expected, since an average increase of the lo domains
size results in phase separation and therefore in an increase in donor-acceptor distance, as reported [18, 34].
Globally, m-cresol interaction with lipid bilayers should involve an initial interaction with the bilayer surface of both lo and ld phases through hydrogen bounds between OH group from
m-cresol and phospholipid heads. This effect should be restricted to the bilayer surface, without perturbation of the phospholipid acyl chains packing. Since membrane dipole potential is higher at lo phase, at this phase, m-cresol dipolar moment aligns with membrane dipole. Thus, m-cresol
insertion into the bilayer is energetically compensated by the dipolar moments interaction. This interaction is the explanation for the m-cresol preference for lo phase. The packing of this phase
is not perturbed during the interaction since m-cresol should locates preferentially at the surface, aligned with the planar structure of the sterol rings. However, since new hydrogen bounds with
m-cresol are formed, the hydrogen bounds sterol-phospholipid are replaced, contributing to the
further lo phase destabilization. This superficial interaction should happen preferentially on the
interfaces between lo and ld domains probably because kinetically is more easy, leading to the
disappearance of the small lo domains and to a progressive reduction of the lo domains size. This
change on bilayer organization can be described as a displacement of the ternary mixture phase diagram in the direction of the disordered phase or a shift to higher temperature. At the final stage, bilayer should correspond to a disordered phase, but with distinct properties from the initial ld,
since it contains large amounts of Chol. At ld phase, hydrophobic interactions should avoid
m-cresol contact with water molecules and it will have an orientation with more freedom. Globally, at this phase, the interactions will not be so strong as those at the lo phase, since there are no
dipolar interactions between m-cresol and the bilayer. The behavior based on dipolar moment interactions is similar to the one described to explain the different solubility of two fluorescent
21 lipid probes containing comparable apolar structures and different polar head groups, the NBD-hexadecylamine and the RG-tetradecylamine [44].
Knowing that in Humulin formulation, m-cresol concentration is c.a. 38-fold higher that of insulin, it was also convenient to study the effects of this formulation on membrane mimetic models in similar conditions as those used for pure m-cresol. The results obtained are in agreement with m-cresol behavior, suggesting that Humulin effects are largely triggered by m-cresol. The
m-cresol toxicity level was recently tested and compared to insulin solutions containing m-cresol
as excipient [16]. The results revealed that m-cresol displays the same level of cytotoxicity as the commercial insulin formulations, whereas insulin solutions without excipients did not cause cell death. Besides that, since m-cresol is also a preservative agent, the fact that the trend in intrinsic fluorescence is similar for pure m-cresol (Figure 3 – A, B) and Humulin (Figure 3 – C, D) is already quite surprising. This conclusion is based on the fact that, in formulation, m-cresol may interact with insulin itself and, possibly, with other components such as glycerol and hence, a more complex trend in the data should be expected. Actually, the system has a large number of components and, for example, a simple membrane/water partition of m-cresol is not sufficient to quantitatively describe the data. This is a problem regarding the study of this formulation using cells, since it is not possible to predict whether effects detected are due to m-cresol or insulin. This occurs because cells have innumerous receptors for insulin and thus, the application of Humulin will lead to activation of regulation pathways that will not be activated in presence of
m-cresol alone. Therefore, this kind of studies has to be performed using model systems, like what
was done during the study here presented.
Results here revealed may be of some medical importance since m-cresol is present in pharmaceutical formulations already in market and, particularly, Humulin is a widely used drug formulation prescribed as an adjunct to diet and exercise for patients with type 1 and type 2 diabetes mellitus. Furthermore, Humulin administration may be done subcutaneously or through intravenous injection. Thus, a fast release of formulation components leads to a fast spreading of
m-cresol over the body, including blood circulation and the contact with cells, especially with cell
membrane. Once in contact with the outer leaflet of plasma membrane, it may act on membrane constituents, namely with lipid rafts via mechanisms here described with possible implications on cellular viability. As a matter of fact, some of the skin irritation cases reported [4] using insulin-pump therapy containing m-cresol may be due to the m-cresol effects here described. Hence, this study will certainly contribute to unravel the mechanisms of pharmaceutical formulations containing m-cresol toxicity, at the membrane level, like insulin preparations.


![Figure 1. General scheme of a biosensor. Adapted from [57].](https://thumb-eu.123doks.com/thumbv2/123dok_br/15568681.1047764/52.892.283.642.909.1082/figure-general-scheme-biosensor-adapted.webp)
