ISSN 0100-879X
CLINICAL INVESTIGATION
www.bjournal.com.br
www.bjournal.com.br
Volume 43 (6) 522-599 June 2010
Institutional Sponsors
The Brazilian Journal of Medical and Biological Research is partially financed by
Hotsite of proteomics metabolomics developped by:
Braz J Med Biol Res, June 2010, Volume 43(6) 572-579
doi: 10.1590/S0100-879X2010007500051
Predictors of restenosis after percutaneous coronary intervention
using bare-metal stents. A comparison between patients with and
without dysglycemia
Predictors of restenosis after percutaneous
coronary intervention using bare-metal stents.
A comparison between patients with and
without dysglycemia
M.O. Lima-Filho
1, G.L. Figueiredo
1, M.C. Foss-Freitas
2,
M.C. Foss
2and J.A. Marin-Neto
11Divisão de Cardiologia, 2Divisão de Endocrinologia, Departamento de Clínica Médica,
Faculdade de Medicina de Ribeirão Preto, Universidade de São Paulo, Ribeirão Preto, SP, Brasil
Abstract
The objective of this study was to identify intravascular ultrasound (IVUS), angiographic and metabolic parameters related to restenosis in patients with dysglycemia. Seventy consecutive patients (77 lesions) selected according to inclusion and exclusion criteria were evaluated by the oral glucose tolerance test and the determination of insulinemia after a successful percutane-ous coronary intervention (PCI) with a bare-metal stent. The degree of insulin resistance was calculated by the homeostasis model assessment of insulin resistance (HOMA-IR). Six-month IVUS and angiogram follow-up were performed. Thirty-nine patients (55.7%) had dysglycemia. The restenosis rate in the dysglycemic group was 37.2 vs 23.5% in the euglycemic group (P = 0.299). The predictors of restenosis using bivariate analysis were reference vessel diameter (RVD): ≤2.93 mm (RR = 0.54; 95%CI = 0.05-0.78; P = 0.048), stent area (SA): <8.91 mm2 (RR = 0.66; 95%CI = 0.24-0.85; P = 0.006), stent volume (SV):
<119.75 mm3 (RR = 0.74; 95%CI = 0.38-0.89; P = 0.0005), HOMA-IR: >2.063 (RR = 0.44; 95%CI = 0.14-0.64; P = 0.027), and
fasting plasma glucose (FPG): ≤108.8 mg/dL (RR = 0.53; 95%CI = 0.13-0.75; P = 0.046). SV was an independent predictor of restenosis by multivariable analysis. Dysglycemia is a common clinical condition in patients submitted to PCI. The degree of insulin resistance, FPG, RVD, SA, and SV were correlated with restenosis. SV was inversely correlated with an independent predictor of restenosis in patients treated with a bare-metal stent.
Key words: Coronary stents; Coronary restenosis; Insulin resistance; Diabetes mellitus; Dysglycemia
Introduction
Correspondence: M.O. Lima-Filho, Divisão de Cardiologia, Departamento de Clínica Médica, FMRP, USP, 14048-900 Ribeirão Preto, SP, Brasil. Fax: +55-16-3633-0869. E-mail: [email protected] or [email protected]
Received January 7, 2010. Accepted May 14, 2010. Available online June 2, 2010. Published June 11, 2010.
Diabetes mellitus (DM) has been associated with poor clinical outcome and higher restenosis rate after percu-taneous coronary intervention (PCI) using balloon alone, bare-metal stents (BMS) or drug-eluting stents (DES) (1-3). Although, on the basis of such evidence, DM has emerged as an independent predictor of restenosis, the mechanism responsible for this association remains to be elucidated (1-4). Several factors related to DM may be involved in the restenotic process: the duration of disease, the sustained hyperglycemic state, the requirement of insulin for control of plasma glucose concentration, the hyperinsulinemic
condition of patients whose pancreatic β cell reserve is preserved, inflammation injury, and abnormal growth factors
leading to neo-intimal proliferation (5,6). A strong correlation
between pre-diabetic hyperglycemic states and increased cardiovascular risk has also been demonstrated (7). In ad-dition, there is evidence that postprandial 2-h glycemia is better than fasting glycemia as a predictor to cardiovascular events (8,9). However, the role of insulin resistance (IR) in the development of cardiovascular disease is not well
defined (10,11) despite the fact that IR is present in
Restenosis and dysglycemia 573
parameters with intravascular ultra-sound (IVUS) and quantitative coronary angiographic (QCA) characteristics of restenosis in a population of non-selected consecutive patients undergoing PCI with BMS.
Material and Methods
Study population
This was a prospective, single-center controlled cohort study designed to correlate the glycemic metabolic status of patients submitted to PCI using BMS with QCA and IVUS data. During a period of 18 months, from January 2001 to August 2002, we studied 76 consecutive patients selected according to strict inclusion and exclusion criteria with 84 lesions who were enrolled in this study after a successful procedure. The study was approved by the Institutional Review Board and all patients gave written informed consent after appropriate consideration of inclusion and exclusion criteria.
Procedure-related parameters such as number of stents,
final pressure of deployment and type of stent were left to
the discretion of the operators. All patients received com-bined anti-platelet therapy with acetylsalicylic acid and a thienopyridine for at least 1 month after the procedure.
Gly-coprotein IIb/IIIa inhibitors were not used in any patient.
Within 2 weeks after a successful PCI documented with QCA and IVUS, the patients were evaluated for glycemic metabolism. The patients were monitored during a 6-month follow-up period by visits at 30 days, 3 and 6 months, and coronary angiography and IVUS were repeated after this period in all but 6 patients. The data presented concern 70 patients (77 lesions) who completed the study.
Inclusion and exclusion criteria
Consecutive patients ≥18 years old referred for PCI on the basis of having clinical and/or laboratory evidence of
myocardial ischemia, with at least one coronary stenosis
≥70% in vessels with a reference diameter >2.5 mm, were
considered eligible to participate in the study. The other sine-qua-non criterion was to provide a signed informed consent for participating in the study protocol. The exclusion criteria were as follows: non-protected left main coronary stenosis, angiographic evidence of coronary thrombus, degenerated saphenous vein graft lesions, total occlusions, pregnancy, acute phase of a coronary syndrome.
Metabolic evaluation
The patients underwent an oral glucose tolerance test (OGTT) with assessment of glycemia and insulinemia at baseline and 2 h after glucose ingestion. The degree of insulin resistance was evaluated by the homeostasis model assessment method (HOMA-IR) (17).
After metabolic evaluation, 39 patients (55.7%) with 43 lesions were found to be dysglycemic and 31 patients (44.3%) with 34 lesions were found to be euglycemic. The
dysglycemic group comprised 23 diabetic patients with 27
lesions, and 16 patients with IGT and/or IFG with 16 lesions.
The OGTT was not performed in 4 diabetic patients because they were under treatment with insulin (2 patients) or with double-oral hypoglycemic drugs (2 patients).
The criterion for the diagnosis of IFG was fasting plasma
glucose (FPG) ≥100.0 mg/dL (5.6 mM), but <126 mg/dL (7.0 mM). An IGT state was characterized by FPG <126 mg/ dL (7.0 mM) with 2-h glycemia ≥140 mg/dL (7.8 mM) and <200 mg/dL (11.1 mM). The individuals were considered to be diabetic if their FPG was ≥126 mg/dL and/or a 2-h glycemia >200 mg/dL.
Study endpoints
The primary endpoint was the comparison of angiog-raphy restenosis rates between the subgroups of patients with dysglycemia and euglycemia. The secondary endpoint was the correlation of the occurrence of restenosis as de-termined by the binary angiographic criteria with the IVUS, QCA and metabolic parameters.
Angiographic and IVUS analysis
Patients were submitted to an angiogram and IVUS im-mediately and 6 months after the procedure. The QCA and IVUS analyses were performed by experienced observers who were blind to the metabolic status of the patients.
QCA was performed off-line using a previously validated (18) edge-detection system, the CAAS-II System (Pie Medi-cal Imaging B.V., Netherlands). The analysis was performed using the standard methodology, in a frame corresponding to the diastolic phase of the cardiac cycle, in two orthogonal projections, identical at baseline, post-procedure, and at the 6-month follow-up. The following parameters were analyzed: reference vessel diameter (RVD), minimum luminal diam-eter, lesion length, and percent stenosis (stenosis).
The IVUS studies were performed using commercially available systems, Clear View™ or Galaxy™ (Boston
Sci-entific, USA), and catheters with 30- or 40-MHz transducers.
An automatic IVUS pullback from a position distal to the stent toward the aorto-ostial junction was performed at a
speed of 0.5 mm/s, following the intracoronary administra -tion of 200 µg nitroglycerin.
by a new and final IVUS pullback.
Follow-up
A clinical follow-up evaluation was performed 1, 3, and 6 months after the procedure. At the 6-month visit, a new angiogram with IVUS evaluation was scheduled and performed up to 2 weeks thereafter. Of the 76 patients previously enrolled, 5 refused to be submitted to another procedure and 1 patient died from a cardiovascular com-plication 3 months after the procedure. No further cardio-vascular event was observed.
During the follow-up period, 2 patients were receiving insulin, 2 metformin plus glibenclamide, 4 only metformin, 6 only glibenclamide, and none was receiving rosiglitazone. All diabetic patients were receiving statins.
Statistical analysis
Sample size calculation. Previous studies have ob-served a difference in the area of neointimal hyperplasia of 64%, with SD = 42 and 95%CI = 32-90 in the comparison of diabetic vs non-diabetic patients and a difference of 35% with SD = 28 and 95%CI = 7-52 in the comparison of glucose-intolerant vs normoglycemic individuals. Based on these results, in order to detect a difference of 35% between normoglycemics and dysglycemics and of 60% between normoglycemics and diabetics, with 80 or 90% power, we would need 15 to 25 subjects per group, respectively, using a t-test and a two-sided level of significance.
Continuous variables are reported as means ± SD and
were analyzed for significant differences between dysglyce -mic and euglyce-mic individuals, and also between patients with and without restenosis using the Student t-test or the Mann-Whitney test. Categorical variables were analyzed
for significant differences using the chi-square test and
the Fisher exact test. Linear regression and Spearman or Pearson correlation estimates were used. One-way analysis of variance was used to determine the clinical and laboratory parameters related to a greater degree of neointimal hyperproliferation. The predictors of restenosis were evaluated by bivariate analysis, correlating the binary criteria of restenosis with the median or 75th percentile of
any continuous variable. All variables with a P value ≤0.05
were also evaluated by multiple logistic regression analysis. A Pvalue ≤0.05 was considered to be significant.
Results
Comparisons of euglycemic versus dysglycemic individuals
There were no significant differences regarding clinical
baseline characteristics between the two groups (Table 1).
Lesions in the left circumflex artery were more prevalent in dysglycemic patients. No other significant difference was
observed regarding the baseline angiogram characteristics, QCA parameters, or procedural results (Table 2). Similar
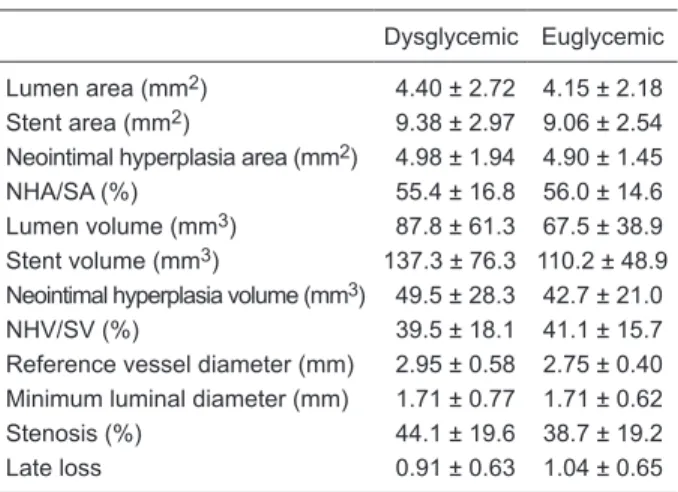
results were observed regarding the IVUS and QCA pa-rameters at the 6-month follow-up (Table 3).
The rate of restenosis in the dysglycemic group was 37.2% (16 of 43 lesions) versus 23.5% in the euglycemic group (8 of 34 lesions), but this 37% difference in restenosis
was not statistically significant (P = 0.299).
When we subdivided the dysglycemic patient group
Table 1. Baseline clinical characteristics of the patients studied.
Dysglycemic Euglycemic
Total 39 (55.7%) 31 (44.3%)
BMI (means ± SD) 27.3 ± 4.9 25.8 ± 3.0
Age [years (range)] 64 (47-78) 61 (40-85)
Male gender 29 (74.4%) 25 (80.6%)
Asymptomatic 7 (17.9%) 1 (3.2%)
Stable 9 (23.1%) 7 (22.6%)
ACS 23 (59.0%) 23 (74.2%)
Hypertension 34 (87.2%) 23 (74.2%)
Obesity 13 (33.3%) 3 (9.7%)
Dyslipidemia 26 (66.6%) 14 (45.2%)
Family history 17 (43.6%) 13 (41.9%)
Tobacco use 13 (33.3%) 8 (25.8%)
LVEF <0.50 12 (30.7%) 3 (9.7%)
1-Vessel disease 16 (41.0%) 16 (51.6%)
2-Vessel disease 17 (43.6%) 12 (38.7%)
3-Vessel disease 6 (15.4%) 3 (9.7%)
Data are reported as number with percent in parentheses unless otherwise indicated. ACS = acute coronary syndrome; LVEF = left ventricle eject fraction. There were no statistically significant differences between the groups for any parameter (chi-square and Mann-Whitney tests).
Table 2. Procedural characteristics and quantitative coronary angiographic parameters.
Dysglycemic Euglycemic
LAD/RCA/LCX (%) 37/35/28 58/35/7*
Maximal inflation pressure (atm) 15.3 ± 2.0 14.9 ± 2.0
Stent length (mm) 13.9 ± 4.8 12.5 ± 3.8
RVD - baseline (mm) 2.99 ± 0.50 2.82 ± 0.50
MLD - baseline (mm) 0.84 ± 0.26 0.80 ± 0.33
Stenosis (%) - baseline 71.4 ± 8.7 71.3 ± 10.5
Lesion length - baseline (mm) 11.8 ± 4.2 11.0 ± 3.3
RVD - post-PCI (mm) 3.24 ± 0.46 3.09 ± 0.39
MLD - post-PCI (mm) 2.74 ± 0.39 2.61 ± 0.36
Stenosis (%) - post-PCI 15.8 ± 6.1 15.1 ± 6.3
Restenosis and dysglycemia 575
according to the presence of DM or IGT we observed a restenosis rate of 44.4% (12 of 27 lesions) in diabetic patients versus 25% (4 of 16 lesions) in IGT patients, a
difference that was not statistically significant.
Comparison of restenotic versus non-restenotic groups
In an attempt to establish whether any metabolic,
angio-graphic or IVUS parameter would influence the incidence of
restenosis, we compared patients regarding the presence
or absence of restenosis. A statistically significant differ -ence was observed between restenotic and non-restenotic lesions in IVUS parameters correlated to vessel dimen-sions such as SV: 90.0 ± 50.5 vs 142.01 ± 67.29 mm3, P = 0.0003, and SA: 7.53 ± 2.23 vs 10.04 ± 2.65 mm2, P = 0.0003. Similarly, by QCA analysis, RVD was found to be
significantly smaller in the group with restenosis compared
to the group with non-restenotic lesions, 2.64 ± 0.46 vs 2.96 ± 0.51 mm, P = 0.0102.
It is interesting to note that the MLA at follow-up cor-related strongly with the SA (Figure 1). The patients with
restenosis had significantly higher rates of IR as determined
by HOMA-IR and more elevated values of postprandial glycemia. They also tended to have higher FPG and 2-h insulinemia (Table 4).
The predictors of coronary restenosis using bivariate analysis for the whole group were RVD: ≤2.93 mm (sample median), RR = 0.54 (95%CI = 0.05-0.78), P = 0.048; SA: <8.91 mm2 (sample median), RR = 0.66 (95%CI = 0.24-0.85), P = 0.006; SV: <119.75 mm3 (sample median), RR = 0.74 (95%CI = 0.38-0.89), P = 0.0005; HOMA-IR: >2.063 (sample median), RR = 0.44 (95%CI = 0.14-0.64),
P = 0.027, and FPG: ≤108.8 mg/dL (sample median), RR
= 0.53 (95%CI = 0.13-0.75), P = 0.046 (Table 5). Only SV remained as independent predictor of restenosis by the multiple linear regression analysis (Table 6).
Figure 1. Relation between minimum lumen area and stent area measured by intravascular ultrasound at 6 months of follow-up (FU).
Table 3. Intravascular ultrasound and quantitative coronary an-giographic parameters at 6-month follow-up.
Dysglycemic Euglycemic
Lumen area (mm2) 4.40 ± 2.72 4.15 ± 2.18
Stent area (mm2) 9.38 ± 2.97 9.06 ± 2.54
Neointimal hyperplasia area (mm2) 4.98 ± 1.94 4.90 ± 1.45
NHA/SA (%) 55.4 ± 16.8 56.0 ± 14.6
Lumen volume (mm3) 87.8 ± 61.3 67.5 ± 38.9
Stent volume (mm3) 137.3 ± 76.3 110.2 ± 48.9
Neointimal hyperplasia volume (mm3) 49.5 ± 28.3 42.7 ± 21.0
NHV/SV (%) 39.5 ± 18.1 41.1 ± 15.7
Reference vessel diameter (mm) 2.95 ± 0.58 2.75 ± 0.40
Minimum luminal diameter (mm) 1.71 ± 0.77 1.71 ± 0.62
Stenosis (%) 44.1 ± 19.6 38.7 ± 19.2
Late loss 0.91 ± 0.63 1.04 ± 0.65
Data are reported as means ± SD. NHA/SA = neointimal hyper -plasia area/stent area; NHV/SV = neointimal hyper-plasia volume/ stent volume. There were no statistically significant differences between the groups for any parameter (Student t-test).
Table 4. Comparison of the metabolic parameters of the groups with and without restenosis.
Restenosis No restenosis
HOMA-IR 3.7 ± 3.0 2.9 ± 3.4*
Insulin (µU/mL), fasting 11.5 ± 6.0 10.4 ± 8.2
Glycemia (mg/dL), fasting 125.7 ± 66.1 98.0 ± 31.0
Insulin (µU/mL), 120 min 110.8 ± 71.2 83.3 ± 63.9
Glycemia (mg/dL), 120 min 184.8 ± 90.2 147.2 ± 72.2*
Data are reported as means ± SD. HOMA-IR = homeostasis model assessment of insulin resistance. *P < 0.05 compared to restenosis (Student t-test).
Table 5. Predictors of restenosis - bivariate analysis.
Relative risk P
Fasting glycemia <108.0 mg/dLa 0.53 (0.13-0.75) 0.046
Glycemia - 120 min <183.5 mg/dLa 0.45 (0.04-0.71) 0.093
Fasting insulin <13.0 µU/mLa 0.28 (0.41-0.63) 0.679
Insulin - 120 min ≥78.0 µU/mLb 0.45 (0.04-0.71) 0.093
HOMA-IR <2.06a 0.44 (0.14-0.64) 0.027
RVD ≥2.82 mma 0.60 (0.15-0.81) 0.014
Stent volume ≥119.8 mm3a 0.74 (0.38-0.89) 0.0005
Stent area ≥8.91 mm2a 0.66 (0.24-0.85) 0.006
HOMA-IR = homeostasis model assessment of insulin resis-tance; RVD = reference vessel diameter. aMedian value; b75th
Discussion
Although DM, IGT and IFG are associated with increased cardiovascular risk, the assessment of glucose metabolism is commonly neglected in many patients treated with PCI (8,9). In a cohort of 1612 patients, 61% of them were found to have diabetes or pre-diabetes (20). Similarly, the present study showed that 55.7% of consecutive patients being treated with PCI had dysglycemia. However, our investi-gation differs from that seminal study by the fact that we performed an OGTT and the criterion for IFG was updated according to the last ADA Expert Document Consensus
(FPG ≥100 mg/dL) (21). The stricter criterion for defining patients with IFG used in our study was justified by the fact
that, although a tighter glycemic control has been shown to be effective in the prevention of microvascular disease in diabetic and pre-diabetic patients, no similar clear rela-tion has been established regarding the development of macrovascular atherosclerotic complications in this set of patients (22).
A correlation between glycated hemoglobin (HbA1c) levels and major adverse cardiac events after PCI has been shown in non-diabetic patients (23). However, in the cited study the patients were only considered diabetic if previously diagnosed or if they had HbA1c >7.0%, a crite-rion not consistent with current standards (21). The same group of investigators also found a relationship between glycemic control and rate of restenosis, considering a level of HbA1c >7.0% as a parameter of uncontrolled DM (24).
This observation was not confirmed by two recent studies
that did not show a direct relationship between target lesion revascularization and other cardiac events after PCI and HbA1c levels (25,26). The present study, in which we actively established the diagnosis of both DM and pre-diabetes
sta-tus using currently accepted methodology (21,27), confirms
and extends the results of these previous studies. Thus, by bivariate analysis, we observed a reduction in the risk
of restenosis as defined by the binary criteria, when FPG
≤108 mg/dL (median), RR = 0.53 (95%CI = 0.13-0.75), P
= 0.046. These results are similar to those of Muhlestein
et al.(20)who found a 3-fold increase in the risk of death during a follow-up of 2.8 ± 1.2 years after PCI when FPG
exceeded 109 mg/dL.
In dysglycemic patients with either microvascular or macrovascular disease, the postprandial glycemia has been considered a better predictor of mortality than FPG (8,9). In our study, we observed a trend to a reduction of restenosis
rate when the 120-min glycemia was <183.5 mg/dL.
No direct or independent relation of IR to coronary artery disease has been established (10,11,28,29). Moreover, the relation of IR to restenosis is even more elusive be-cause the few studies addressing this issue used different methodology, and the results were highly heterogeneous (13-16,30,31). For instance, an unexpected inverse relation-ship between insulinemia levels and restenosis rate was described following excimer laser coronary angioplasty (30). Since fasting hyperinsulinemia is an unquestionable parameter of IR (32), there is no logical explanation for this
finding. In our study, no differences in fasting insulinemia
levels were found between the restenotic and non-restenotic groups; only a trend toward higher 120-min insulinemia levels was observed in the restenotic group. In the bivariate
analysis, we observed that the degree of IR, as defined by
an HOMA-IR <2.06, decreased the risk of restenosis, but multivariable analysis did not show an independent rela-tionship between these variables. Our results agree with published data describing a relationship between greater neointimal index area (not measured with IVUS as in our study) and IR (16). Other studies also described a relation-ship between restenosis and IR, but in most of them diabetic patients were excluded and no IVUS measurements were performed (13,15,31). In the only published study in which diabetic patients were included and a direct relationship be-tween plasma insulin levels and restenosis was described, IVUS was not used, and, unexpectedly, QCA parameters related to vessel diameter were not considered to be pre-dictors of restenosis (14). In our study, as in previous trials,
RVD was a significant predictor of restenosis (4,33). We also observed that SA measured by IVUS was significantly
and inversely related to the rate of restenosis. A minimal
Table 6. Predictors of restenosis - multiple logistic regression analysis.
Beta coefficient Standard error Wald coeff./SE Prob Exp (beta)
HOMA-IR 2.71675 1.70828 1.59034 0.11 15.13
Fasting glycemia -2.1871 1.78436 -1.22571 0.22 0.1122
Stent volume 4.34938 1.76364 2.46615 0.013 77.43
Stent area 2.19828 1.87928 1.16975 0.24 9.01
RVD -0.85389 1.6749 -0.05982 0.96 0.9182
Constant -5.07521 2.4083 -2.10738 0.017
Restenosis and dysglycemia 577
stent area >6.5 mm2 determined by IVUS right after the procedure has been previously described to be associated with nearly 95% freedom from subsequent new target le-sion revascularization at 9-month follow-up (34). The same group of investigators emphasized the importance of stent expansion through a sub-study of DES in the SIRIUS trial
(35). The present findings fully agree with these data - the regression coefficient we observed lies exactly in the middle
between the DES and BMS groups analyzed in the SIRIUS sub-study, but the cut-off points of minimal stent area were different, 8.91 vs 6.5 mm2 as predictors of restenosis. This might be partially explained by the fact that we considered
the binary angiographic definition of restenosis, and those
studies considered the need of new target lesion revascu-larization (34) and an MLA <4.0 mm2 by IVUS follow-up
(35) for the definition of restenosis.
The present study is the first to show that SV is an
independent predictor of restenosis. IVUS parameters as predictors of restenosis were previously described in study with Palmaz-Schatz stents (36). In another study, a chart
based on IVUS data from five trials was constructed, and
by bivariate analysis SV was not considered to be a pre-dictor of restenosis. Interestingly, by multivariable logistic regression analysis with multiple models containing two IVUS parameters, the SV associated with stent length were considered to be predictors of restenosis (37). It is
impor-tant to point out that in our study there was no significant
difference between the groups with and without restenosis regarding stent length.
Among other characteristics, our study differs from the previous investigations in that we prospectively included consecutive patients, used eight different stent types, and eventually had more than 50% of our patients being at higher risk of restenosis based on their dysglycemic status.
Lesion length was similar in both groups, and the refer-ence vessel diameter of dysglycemics was higher than that
of the euglycemic group (without statistical significance).
Since more than one third of dysglycemic patients were
diabetics, these are unexpected findings, since diabetes
mellitus is generally associated with longer lesions and smaller vessels. We do not have an explanation for this
observation. But the same finding has been reported in
most studies showing no difference in terms of vessel diameter when comparing diabetics and non-diabetics.
Maybe this merely reflects screening bias since usually
diabetic patients with small vessels and long lesions are not referred for PCI.
Recently, a meta-analysis showed a direct relationship between C-reactive protein and angiographic restenosis after bare-metal stent implantation (38). Also, a recent study (39) showed that both diabetic and non-diabetic patients
exhibited an inflammatory response after PCI, expressed
by C-reactive protein levels, and that the intensity of this reaction was more pronounced in diabetic patients.
How-ever, we have no data on inflammatory markers from our
investigation.
Finally, although in some countries the mainstay of PCI currently lies in the use of DES for diabetic patients, this is not the case in our country, mainly because of economic limitations. Moreover, a recent study using data from the National Heart, Lung and Blood Institute of Health showed that, in comparison to BMS, the use of DES had a positive impact on cardiac events in diabetic patients not receiv-ing insulin, but not on those under insulin treatment (40). Hence, the present data are pertinent for the great majority of dysglycemic patients treated with bare-metal stents in this and other developing countries.
Clinical implications
With current difficulties for a more widespread use of
DES, the concept that larger reference and luminal diam-eters may protect against the physiological consequences of neointimal hyperplasia is still valid, even in patients at higher risk of restenosis because of a dysglycemic status. Although the biologic variability of neointimal hyperplasia
in the BMS restenosis process is influenced by metabolic
status, its clinical impact mostly depends on procedural and anatomical factors. The same amount of neointimal hyperplasia may produce different clinical outcomes, basi-cally depending on the vessel and stent diameters. Larger studies are necessary using new available technologies such as last generation DES in association with optimal medical therapy to resolve this issue.
Study limitations
This was a single-center study with a small sample. The metabolic parameters were evaluated only at baseline
and did not include measurement of HbA1c or anti-inflam -matory markers such as C-reactive protein levels. Hence, no information was obtained on how the glycemic status,
a factor potentially influencing the restenosis process,
was maintained during follow-up. In theory, the metabolic status of the patients could also have changed between the procedure and the time of the evaluation. However, the metabolic status of the patients was assessed within 2 weeks following the index procedure. In fact, most patients
were evaluated metabolically within the first week. Hence,
the IR was not evaluated using the gold-standard method, the hyperinsulinemic-euglycemic clamp technique, but this
limitation probably would not have influenced the results
of the study.
We conclude that dysglycemia is a common clinical condition in patients submitted to PCI. After PCI using BMS, coronary restenosis tended to be more frequent in patients with dysglycemia compared to euglycemic patients. The degree of IR and the FPG levels correlated with the
restenosis rate, but were not considered to be independent predictors of this complication. The stent dimensions, mea-sured by both IVUS and QCA, were inverse determinants of restenosis rates. SV by IVUS was independently related to restenosis.
Acknowledgments
Research supported by FAPESP (#99/07143-2).
References
1. Carrozza JP Jr, Kuntz RE, Fishman RF, Baim DS. Restenosis after arterial injury caused by coronary stenting in patients with diabetes mellitus. Ann Intern Med 1993; 118: 344-349. 2. Abizaid A, Kornowski R, Mintz GS, Hong MK, Abizaid AS,
Mehran R, et al. The influence of diabetes mellitus on acute and late clinical outcomes following coronary stent implanta-tion. J Am Coll Cardiol 1998; 32: 584-589.
3. Elezi S, Kastrati A, Pache J, Wehinger A, Hadamitzky M, Dirschinger J, et al. Diabetes mellitus and the clinical and angiographic outcome after coronary stent placement. J Am Coll Cardiol 1998; 32: 1866-1873.
4. Cutlip DE, Chauhan MS, Baim DS, Ho KK, Popma JJ, Car-rozza JP, et al. Clinical restenosis after coronary stenting: perspectives from multicenter clinical trials. J Am Coll Car-diol 2002; 40: 2082-2089.
5. Kornowski R, Mintz GS, Kent KM, Pichard AD, Satler LF, Bucher TA, et al. Increased restenosis in diabetes mellitus after coronary interventions is due to exaggerated intimal hyperplasia. A serial intravascular ultrasound study. Circula-tion 1997; 95: 1366-1369.
6. Aronson D, Bloomgarden Z, Rayfield EJ. Potential mecha -nisms promoting restenosis in diabetic patients. J Am Coll Cardiol 1996; 27: 528-535.
7. Levitan EB, Song Y, Ford ES, Liu S. Is nondiabetic hyper-glycemia a risk factor for cardiovascular disease? A meta-analysis of prospective studies. Arch Intern Med 2004; 164: 2147-2155.
8. Qiao Q, Pyorala K, Pyorala M, Nissinen A, Lindstrom J, Tilvis R, et al. Two-hour glucose is a better risk predictor for incident coronary heart disease and cardiovascular mortality than fasting glucose. Eur Heart J 2002; 23: 1267-1275. 9. Glucose tolerance and cardiovascular mortality: comparison
of fasting and 2-hour diagnostic criteria. Arch Intern Med
2001; 161: 397-405.
10. Ruige JB, Assendelft WJ, Dekker JM, Kostense PJ, Heine RJ, Bouter LM. Insulin and risk of cardiovascular disease: a meta-analysis. Circulation 1998; 97: 996-1001.
11. Despres JP, Lamarche B, Mauriege P, Cantin B, Dagenais GR, Moorjani S, et al. Hyperinsulinemia as an independent risk factor for ischemic heart disease. N Engl J Med 1996; 334: 952-957.
12. Reaven GM. Banting lecture 1988. Role of insulin resistance in human disease. Diabetes 1988; 37: 1595-1607. 13. Nishimoto Y, Miyazaki Y, Toki Y, Murakami R, Shinoda M,
Fukushima A, et al. Enhanced secretion of insulin plays a role in the development of atherosclerosis and restenosis of coronary arteries: elective percutaneous transluminal
coronary angioplasty in patients with effort angina. J Am Coll Cardiol 1998; 32: 1624-1629.
14. Nishio K, Fukui T, Tsunoda F, Kawamura K, Itoh S, Konno N, et al. Insulin resistance as a predictor for restenosis after coronary stenting. Int J Cardiol 2005; 103: 128-134. 15. Sekiguchi M, Kurabayashi M, Adachi H, Hoshizaki H,
Oshima S, Taniguchi K. Usefulness of insulin resistance measured by homeostasis model assessment in predicting restenosis after coronary stent placement in nondiabetic patients. Am J Cardiol 2004; 93: 920-922.
16. Takagi T, Yoshida K, Akasaka T, Kaji S, Kawamoto T, Honda Y, et al. Hyperinsulinemia during oral glucose tolerance test is associated with increased neointimal tissue proliferation after coronary stent implantation in nondiabetic patients: a serial intravascular ultrasound study. J Am Coll Cardiol 2000; 36: 731-738.
17. Matthews DR, Hosker JP, Rudenski AS, Naylor BA, Treacher DF, Turner RC. Homeostasis model assessment: insulin re-sistance and beta-cell function from fasting plasma glucose and insulin concentrations in man. Diabetologia 1985; 28: 412-419.
18. Reiber JH, Koning G, Goedhart B. The effect of DICOM on QCA and clinical trials. Int J Card Imaging 1998; 14 (Suppl 1): 7-12.
19. Mintz GS, Nissen SE, Anderson WD, Bailey SR, Erbel R, Fitzgerald PJ, et al. American College of Cardiology Clinical Expert Consensus Document on Standards for Acquisition, Measurement and Reporting of Intravascular Ultrasound Studies (IVUS). A report of the American College of Cardiol-ogy Task Force on Clinical Expert Consensus Documents.
J Am Coll Cardiol 2001; 37: 1478-1492.
20. Muhlestein JB, Anderson JL, Horne BD, Lavasani F, len Maycock CA, Bair TL, et al. Effect of fasting glucose levels on mortality rate in patients with and without diabetes mel-litus and coronary artery disease undergoing percutaneous coronary intervention. Am Heart J 2003; 146: 351-358. 21. Genuth S, Alberti KG, Bennett P, Buse J, Defronzo R, Kahn
R, et al. Follow-up report on the diagnosis of diabetes mel-litus. Diabetes Care 2003; 26: 3160-3167.
22. Intensive blood-glucose control with sulphonylureas or insulin compared with conventional treatment and risk of complications in patients with type 2 diabetes (UKPDS 33). UK Prospective Diabetes Study (UKPDS) Group. Lancet
1998; 352: 837-853.
Restenosis and dysglycemia 579
coronary revascularization. Am J Cardiol 2003; 92: 1282-1286.
24. Corpus RA, George PB, House JA, Dixon SR, Ajluni SC, Devlin WH, et al. Optimal glycemic control is associated with a lower rate of target vessel revascularization in treated type II diabetic patients undergoing elective percutaneous coronary intervention. J Am Coll Cardiol 2004; 43: 8-14. 25. Kauffman AB, Delate T, Olson KL, Cymbala AA, Hutka KA,
Kasten SL, et al. Relationship between haemoglobin A1C values and recurrent cardiac events: A retrospective, longi-tudinal cohort study. Clin Drug Investig 2008; 28: 501-507. 26. Lemesle G, Bonello L, de Labriolle A, Maluenda G, Syed AI,
Collins SD, et al. Prognostic value of hemoglobin A1C levels in patients with diabetes mellitus undergoing percutaneous coronary intervention with stent implantation. Am J Cardiol
2009; 104: 41-45.
27. World Health Organization. Definition, diagnosis and
clas-sification of diabetes mellitus and its complications: part 1: report of a WHO consultation: diagnosis and classification of diabetes mellitus. Geneva: World Health Organization; 1999.
28. Gaudet D, Vohl MC, Perron P, Tremblay G, Gagne C, Le-siege D, et al. Relationships of abdominal obesity and hy-perinsulinemia to angiographically assessed coronary artery disease in men with known mutations in the LDL receptor gene. Circulation 1998; 97: 871-877.
29. Reaven GM, Chen YD. Insulin resistance, its consequences, and coronary heart disease. Must we choose one culprit?
Circulation 1996; 93: 1780-1783.
30. Rabbani LE, Edelman ER, Ganz P, Selwyn AP, Loscalzo J, Bittl JA. Relation of restenosis after excimer laser an-gioplasty to fasting insulin levels. Am J Cardiol 1994; 73: 323-327.
31. Radke PW, Voswinkel M, Reith M, Kaiser A, Haager PK, Hanrath P, et al. Relation of fasting insulin plasma levels to restenosis after elective coronary stent implantation in patients without diabetes mellitus. Am J Cardiol 2004; 93: 639-641.
32. Kim SH, Reaven GM. Insulin resistance and hyperinsuline-mia: you can’t have one without the other. Diabetes Care
2008; 31: 1433-1438.
33. Suselbeck T, Latsch A, Siri H, Gonska B, Poerner T, Pfleger S, et al. Role of vessel size as a predictor for the occurrence of in-stent restenosis in patients with diabetes mellitus. Am J Cardiol 2001; 88: 243-247.
34. Morino Y, Honda Y, Okura H, Oshima A, Hayase M, Bonneau HN, et al. An optimal diagnostic threshold for minimal stent area to predict target lesion revascularization following stent implantation in native coronary lesions. Am J Cardiol 2001; 88: 301-303.
35. Sonoda S, Morino Y, Ako J, Terashima M, Hassan AH, Bon-neau HN, et al. Impact of final stent dimensions on long-term results following sirolimus-eluting stent implantation: serial intravascular ultrasound analysis from the SIRIUS trial. J Am Coll Cardiol 2004; 43: 1959-1963.
36. Hoffmann R, Mintz GS, Mehran R, Pichard AD, Kent KM, Satler LF, et al. Intravascular ultrasound predictors of an-giographic restenosis in lesions treated with Palmaz-Schatz stents. J Am Coll Cardiol 1998; 31: 43-49.
37. de Feyter PJ, Kay P, Disco C, Serruys PW. Reference chart derived from post-stent-implantation intravascular ultrasound predictors of 6-month expected restenosis on quantitative coronary angiography. Circulation 1999; 100: 1777-1783.
38. Ferrante G, Niccoli G, Biasucci LM, Liuzzo G, Burzotta F, Galiuto L, et al. Association between C-reactive protein and angiographic restenosis after bare metal stents: an updated and comprehensive meta-analysis of 2747 patients. Cardio-vasc ReCardio-vasc Med 2008; 9: 156-165.
39. Paiva MS, Serrano CV Jr, Nicolau JC, Jalbut BO, Fernandes JL, De Lemos JA, et al. Differences in the inflammatory response between patients with and those without diabetes mellitus after coronary stenting. J Interv Cardiol 2008; 21: 403-409.