BIOTIC AND ABIOTIC FACTORS ASSOCIATED WITH
SOIL SUPPRESSIVENESS TO
Rhizoctonia solani
Raquel Ghini*; Marcelo Augusto Boechat Morandi
Embrapa Meio Ambiente, C.P. 69 - 13820-000 - Jaguariúna, SP - Brasil. *Corresponding author <raquel@cnpma.embrapa.br>
ABSTRACT: Crop management may modify soil characteristics, and as a consequence, alter incidence of diseases caused by soilborne pathogens. This study evaluated the suppressiveness to R. solani in 59 soil samples from a microbasin. Soil sampling areas included undisturbed forest, pasture and fallow ground areas, annual crops, perennial crops, and ploughed soil. The soil samples were characterized according to abiotic variables (pH; electrical conductivity; organic matter content; N total; P; K; Ca; Mg; Al; H; S; Na; Fe; Mn; Cu; Zn; B; cation exchange capacity; sum of bases and base saturation) and biotic variables (total microbial activity evaluated by the CO2 evolution and fluorescein diacetate hydrolysis; culturable bacterial, fungal, actinomycetes, protozoa, fluorescent Pseudomonas and Fusarium spp. communities). The contribution and relationships of these variables to suppression to R. solani were assessed by path analysis. When all samples were analyzed together, only abiotic variables correlated with suppression of R. solani, but the entire set of variables explained only 51% of the total variation. However, when samples were grouped and analyzed by vegetation cover, the set of evaluated variables in all cases accounted for more than 90% of the variation in suppression of the pathogen. In highly suppressive soils of forest and pasture/ fallow ground areas, several abiotic variables and fluorescein diacetate hydrolysis correlated with suppression of R. solani and the set of variables explained more than 98% of suppressiveness.
Key words: soilborne pathogen, soil microorganisms, biological control, path analysis, suppressive soil
FATORES BIÓTICOS E ABIÓTICOS ASSOCIADOS À
SUPRESSIVIDADE DE SOLOS A
Rhizoctonia solani
RESUMO: As atividades agrícolas podem modificar as características do solo e, como conseqüência, alterar a incidência de patógenos veiculados pelo solo. Este trabalho avaliou a supressividade a R. solani em 59 amostras de solos de uma microbacia. As áreas amostradas foram selecionadas quanto à vegetação, incluindo mata, pasto/pousio, culturas anuais, culturas perenes e solo arado. As amostras de solo foram caracterizadas quanto às propriedades abióticas (pH, condutividade elétrica, teor de matéria orgânica, N total, P, K, Ca, Mg, Al, H, S, Na, Fe, Mn, Cu, Zn, B, capacidade de troca catiônica, soma de bases e saturação de bases) e bióticas (atividade microbiana do solo, avaliada pelo desprendimento de CO2 e hidrólise de diacetato de fluoresceína; comunidades de bactérias, fungos, actinomicetos, protozoários, Pseudomonas fluorescentes e Fusarium spp.). A contribuição e relação dessas variáveis para a supressividade a R. solani foram quantificadas por análise de coeficientes de trilha. Quando se avaliaram todas as amostras em conjunto, somente variáveis abióticas apresentaram correlação com a supressão a R. solani, mas o conjunto das variáveis explicou somente 51% da variação total. Entretanto, quando as amostras foram agrupadas e analisadas considerando o tipo de cobertura vegetal, o conjunto de variáveis explicou mais de 90% da variação da supressividade. Para as áreas de floresta e pasto/pousio, as quais foram classificadas como as mais supressivas, algumas variáveis abióticas e a hidrólise de diacetato de fluoresceína apresentaram correlação com a supressão de R. solani e o conjunto de variáveis explicou mais de 98% da supressividade nesses solos.
Palavras-chave: patógeno de solo, microrganismos do solo, controle biológico, análise de trilha, solo supressivo
INTRODUCTION
In suppressive soils (Baker & Cook, 1974), the development of diseases is suppressed even when pathogens are present and hosts are susceptible. Soil suppressiveness could result from biotic and abiotic factors, in a diverse and complex set of mechanisms.
informa-tion in other areas where the same pathogen is a prob-lem (Rodríguez-Kábana & Calvet, 1994).
Rhizoctonia solani has great importance among soilborne plant pathogens, and damages a wide range of hosts worldwide. Ghini & Zaroni (2001) evaluated and grouped statistically by Ward´s method (Everitt, 1981), soils inside a microbasin in categories of
sup-pressiveness against R. solani. The authors defined the
microbasin as the physiographic unit for the work based on its climatic homogeneity, convergent water drainage and diversity of vegetation. In general, the pasture and fallow ground areas, followed by undis-turbed forest covered areas, were correlated with sup-pressiveness, while ploughed soils and cultivated soils with annual (corn) or perennial (sugar cane and cof-fee) crops were most correlated with conducivity.
However, other factors besides vegetation were
involved in the suppressiveness to R. solani. The
lit-erature describes several factors that could influence the suppressiveness of soils to the pathogen,
includ-ing soil microbiota (Kobayashi & Ko, 1985), the
Tri-choderma community (Chet & Baker, 1980; Henis et al., 1979; Liu & Baker, 1980) and pH, moisture and type of soil (Henis et al., 1979; Liu & Baker, 1980).
The objective of the present work was to evaluate the contribution and relationships of abiotic (chemical properties) and biotic (microorganisms) fac-tors to the suppressiveness of soils from the Córrego
Taquara Branca microbasin to R. solani.
MATERIAL AND METHODS
Soil sampling
Sampling included 59 areas within the Córrego Taquara Branca microbasin (22º50’ to 22º55’S; 47º15’00" to 47º18’45"W), São Paulo state, Brazil. Ar-eas were selected based on vegetation cover, and in-cluded undisturbed forest (10), pasture and fallow ground areas (11), annual crops (18), perennial crops (16), and ploughed soil (4). From each area, seven soil
sub-samples (80 × 80 × 80 mm) were taken randomly,
homogenized and sieved (4 mm). Soil for microbiologi-cal analysis was processed within 24 h after sampling.
Biotic soil characteristics
The following biotic variables were evaluated on each soil sample: total microbial activity; culturable bacterial, fungal, actinomycetes and protozoa
commu-nities; and, populations of Fusarium spp. and
fluores-cent Pseudomonas spp. The total microbial activity of
the soil was evaluated by measuring the respiratory
ac-tivity (determination of CO2 evolution) and overall
en-zymatic activity (hydrolysis of fluorescein diacetate,
FDA). To evaluate the CO2 evolution, 200-g soil
samples (n = 3) were placed in plastic, hermetic flasks (2.5 L) containing 10 mL of KOH 0.5 N, and incubated at 25ºC in the dark. After seven, 14 and 21 days, the KOH solution was titrated with HCl (Grisi, 1978), for analysis of the total amount of CO2 (µg CO2 g-1 dry soil). For FDA hydrolysis, the method of Chen et al. (1988) was used. Soil samples (5 g; n = 5) were placed in 250 mL Erlenmeyer flasks and mixed with 20 mL of potassium phosphate buffer (60 mM; pH 7.6). The hydrolysis reaction was triggered by the addition of 0.2
mL of FDA stock solution (2 mg FDA mL-1 acetone)
and the flasks were incubated on a rotary shaker (200 rpm) at 25ºC for 20 min. The reaction was halted by the addition of 20 mL of acetone per flask, and the con-tent of each flask was filtered on Whatman nº 1 filter paper. The absorbance (490 nm) of the filtrate was de-termined spectrophotometrically. To determine the
con-centration of the hydrolyzed fluorescein (µg
hydro-lyzed FDA g-1 of dry soil), the absorbance of the
samples were compared against a standard curve, ob-tained by following the same methodology, except that a known concentration of FDA was added to the po-tassium phosphate buffer and the flasks were kept at 100ºC for 60 min to hydrolyze the FDA, before it was mixed with the soil samples.
All other variables, except protozoa communities, were assessed by counting colonies forming units (CFUs) on selective agar media, as follows: Martin’s medium for
fungi; agar-nutrients plus nistatine 42 mg L-1 for
bacte-ria; alkalinized water-agar medium (pH 10.5) for
actino-mycetes; King’s medium B for fluorescent Pseudomonas
spp.; and a selective medium for Fusarium spp. (Nash &
Snyder, 1962). For each soil sample, aliquots of 100 µL
from two dilutions (10-1 and 10-2 for general fungi and
Fusarium spp.; 10-2 and 10-3 for fluorescent Pseudomo-nas spp.; and 10-3 and 10-4 for bacteria and actinomycetes) were applied to Petri dishes (n = 3) containing the spe-cific medium, and incubated upside down at 25ºC until colonies were visible (after one day for bacteria; two days
for general fungi, Fusarium spp. and fluorescent
Pseudomonas; and five days for actinomycetes). Proto-zoan communities were assessed using the method de-scribed by Stotzky et al. (1993).
Abiotic soil characteristics
The following abiotic variables were esti-mated, for each soil sample: pH; electrical conductiv-ity (EC); organic matter content; N total; P; K; Ca; Mg; Al; H; S; Na; Fe; Mn; Cu; Zn; B; cation exchange ca-pacity (CEC); sum of bases (S value, sum of Ca, Mg, K, and Na); and base saturation (V%) (Silva, 1999).
Suppression of R. solani growth
The suppression of mycelial growth of R.
of common bean (Phaseolus vulgaris L.), was evalu-ated on 15-cm Petri dishes containing the soil samples (50 g of soil per dish) (Ko & Ho, 1983). Moisture of soil samples was adjusted to 70% of field capacity. Samples were then placed in the dishes and covered with a thin layer of water agar medium. One disk
(7 mm of diameter) of R. solani mycelium grown
on PDA was transferred to the center of each dish (n = 3). The dishes were kept at 25ºC in the dark
and perpendicular diameter of the R. solani colonies
were measured daily using a stereomicroscope
(12x). The Area Under Growth Curve (AUGC) of R.
solani from the first to the fourth day of incubation for each soil sample was calculated and used for analysis.
Data analysis
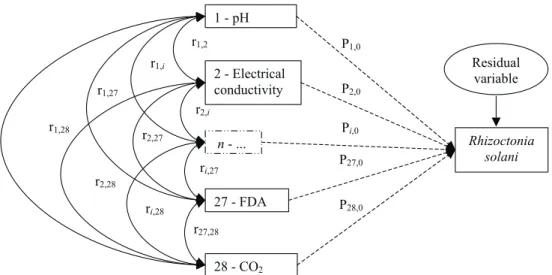
The relative importance of individual biotic
and abiotic factors on R. solani growth suppression and
their interactions were assessed by path coefficient analysis (Wright, 1921). Correlations between vari-ables were divided over direct and indirect influences along different paths in a system. The direct influences, or path coefficients, of a set of variables (causes) upon a certain variable (effect) indicate the degree to which variation of that effect is determined in each particu-lar cause. The assumption of path analysis is that re-lationships between variables can be causally
struc-tured (van Bruggen & Arneson, 1986). If variables are not completely explained by other variables in the sys-tem, an extra variable that contains residual influences and experimental error can be added. A general rela-tional diagram showing all the possible relationships between biotic and abiotic, explicative variables
mea-sured and the R. solani growth suppression (dependent
variable) is given (Figure 1).
Correlation matrices between data for growth
suppression of R. solani and the biotic and abiotic
vari-ables (independent varivari-ables) were generated for each sampled soil, grouped by plant cover (forest, pasture, annual crops, perennial crops, and ploughed soil).
An-other matrix correlating R. solani growth suppression
with all samples, independently of the soil coverage, was also generated. The path coefficient analysis was performed using Software ‘GENES’ (Quantitative Ge-netics and Experimental Statistics Analysis, vs. 0.1.0, http://www.ufv.br/dbg/home.htm) (Cruz, 2001), and the studied variables were grouped in a causal diagram
in-corporating possible pathways of influence on R. solani
growth suppression.
The results of the path analysis were inter-preted according to directives proposed by Singh & Chaudary (1979): 1. If the correlation coefficient (r) between the causal factor and the effect is almost the same as its direct effect, the correlation can explain the actual relation between them and a direct selection
based on this factor will be efficient; and, 2. If the cor-relation is positive (or negative) but the direct effect is negative, positive or can be ignored, the indirect ef-fects seem to be the cause of the correlation. In such situations, the indirect causal factors should be evalu-ated simultaneously. To select the major variable(s) and
its/their influence on R. solani suppressiveness, the
fol-lowing criteria were used: a) statistical significance on
correlation at α = 0.05 by t test; and b) the fulfillment
of the directives of Singh & Chaudary (1979).
RESULTS AND DISCUSSION
Ghini & Zaroni (2001) had previously grouped the same areas of the microbasin in categories of
sup-pressiveness, based on vegetation cover. The pasture, fallow ground and forest covered areas were classified as suppressive soils, while ploughed soils and culti-vated soils, with annual or perennial crops, as condu-cive soils. However, in that work it was not possible to determine the factors that contributed to the
gradi-ent of suppressiveness of the soils to R. solani.
In this study, biotic and abiotic characteristics of the soils were assessed (Table 1), and the
contribu-tion of each variable to the suppression of R. solani
growth was determined by path coefficient analysis. This analysis has rarely been used in plant pathology, but van Bruggen & Arneson (1986) indicate the po-tential use of this technique, such as to assess the rela-tive importance of certain factors contributing to
patho-Table 1 - Mean values of abiotic and biotic variables from soils of the Córrego Taquara Branca microbasin and the Area
Under Growth Curve (AUGC) of Rhizoctonia solani mycelial growth on Petri dishes containing soil samples
taken from different vegetation areas inside the microbasin.
e l b a i r a
V Unit
n o i t a t e g e V /
e r u t s a P
d n u o r g w o l l a
f Forest
l a u n n A
p o r c
l a i n n e r e P
p o r c
d e h g u o l P
l i o s H
( H
p 2O) 5.87 5.37 5.98 5.93 6.20
l a c i r t c e l
E conductivity µS cm-1 54.07 95.59 172.01 79.18 127.33
r e t t a m c i n a g r
O gkg-1 26.45 38.50 19.44 19.06 20.50
) l a t o t (
N % 0.13 0.19 0.10 0.10 0.11
P mgdm-3 49.67 12.46 77.76 83.56 98.43
K mmolcdm-3 5.98 3.74 5.04 6.34 7.18
a
C mmolcdm-3 31.64 19.20 50.28 33.75 40.25
g
M mmolcdm-3 8.00 5.20 10.06 8.31 10.50
l
A mmolcdm-3 0.64 6.20 1.28 1.56 0.00
H mmolcdm-3 25.27 36.30 23.94 23.69 17.50
S mgdm-3 11.47 14.92 42.88 14.15 20.65
a
N mgdm-3 27.55 44.80 44.22 28.13 48.00
e
F mgdm-3 321.03 74.24 133.49 129.95 119.78
n
M mgdm-3 105.67 132.29 59.04 59.12 74.70
u
C mgdm-3 4.44 1.18 8.24 10.79 13.48
n
Z mgdm-3 6.84 6.99 10.62 6.94 6.73
B mgdm-3 0.25 0.32 0.20 0.20 0.25
C E
C a mmol
cdm 3
- 71.45 70.60 91.00 73.56 75.75
Vb % 59.43 40.14 66.76 62.43 76.30
e u l a v
S c mmol
c.dm 3
- 45.5 28.1 65.3 48.3 58.3
a i r e t c a
B logCFUgofdrysoil-1 6.15 5.76 6.18 6.16 6.41
i g n u
F logCFUgofdrysoil-1 4.64 4.62 4.81 4.67 4.76
s e t e c y m o n i t c
A logCFUgofdrysoil-1 5.60 5.18 5.71 5.62 6.15
t n e c s e r o u l
F Pseudomonas logCFUgofdrysoil-1 4.22 4.03 4.01 3.67 4.60
m u i r a s u
F spp. logCFUgofdrysoil-1 4.22 4.19 4.49 4.18 4.47
a o z o t o r
P logcellgofdrysoil-1 4.43 3.21 3.84 4.55 3.86
A D
F µghydrolysedFDAgofdrysoil-1 41.00 75.06 18.25 23.22 36.31
O C l a t o
T 2evolution µgCO2gofdrysoil-1 734.28 890.52 337.96 283.33 454.07
n a l o s .
R id cmday-1 18.5± 2.4 20.5± 1.125.0± 1.024.6± 1.227.2±0.5
aCation exchange capacity. bSum of Ca, Mg, K, and Na. cBase saturation. dArea under growth curve (AUGC) of Rhizoctonia solani
gen growth and disease development. Path analysis is not just a multiple linear regression analysis, because it allows several diagrams to be drawn and the estab-lishment by the researcher of a cause-effect model ac-cording to one’s hypothesis. Furthermore, path analy-sis can generate more information than multiple regres-sion, and such is the case in this study.
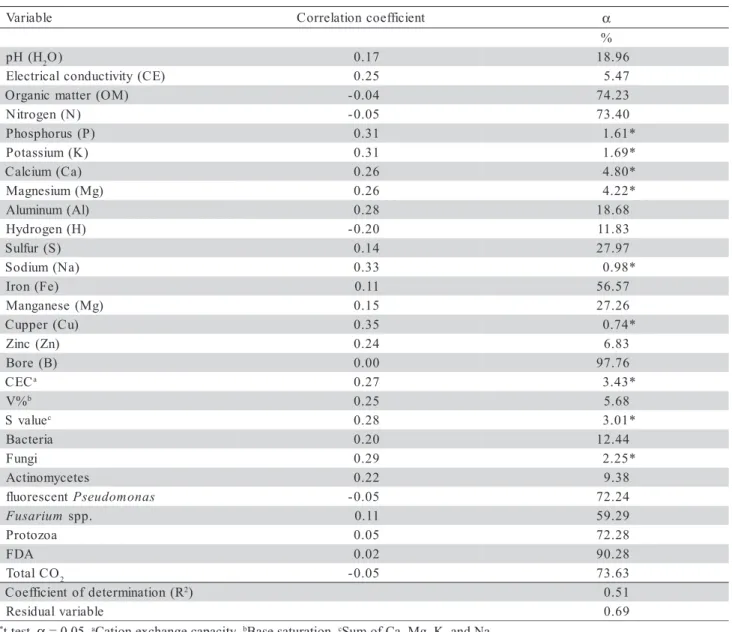
When all samples were analyzed together, in-dependently of the soil type and vegetation, only abi-otic variables (P, K, Ca, Mg, Na, Cu, CEC and S value)
were correlated (α≤ 0.05) with R. solani growth
sup-pression, and the entire set of variables explained only
51% of the total variation (R2 = 0.51; residual variable,
Rv = 0.69) (Table 2), which is not useful in predicting soil suppressiveness or the mechanism of suppression. However, when samples were grouped and analyzed
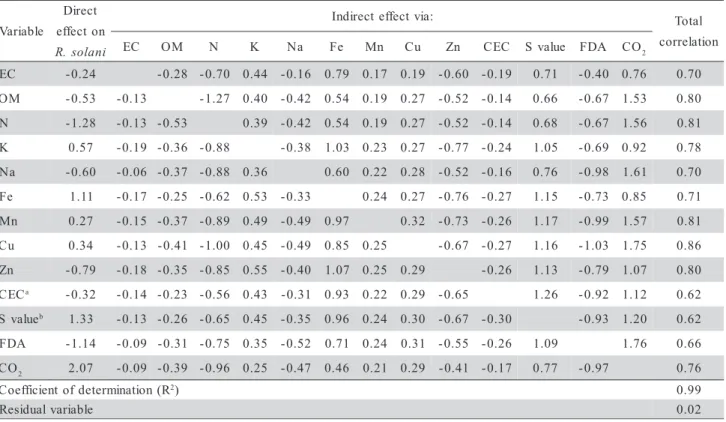
by vegetation cover, the set of evaluated variables in all instances explained more than 90% of the variation
in growth suppression of R. solani. In highly
suppres-sive forest soils and pasture/fallow ground areas, sev-eral abiotic variables and FDA hydrolysis correlated
with growth suppression of R. solani and the set of
variables explained more than 98% of suppressiveness (Tables 3 and 4, respectively). For less suppressive soils, no correlations of suppressiveness with the bi-otic variables were found. Several abibi-otic variables were correlated with suppressiveness of soils from an-nual crops (Table 5), but no correlations were found for ploughed soils and perennial crops. These findings stress the importance of the vegetation cover and soil management on soil supressiveness. To understand the nature of soil suppressiveness, the ecological context
e l b a i r a
V Correlationcoefficient α
% H
( H
p 2O) 0.17 18.96
) E C ( y t i v i t c u d n o c l a c i r t c e l
E 0.25 5.47
) M O ( r e t t a m c i n a g r
O -0.04 74.23
) N ( n e g o r t i
N -0.05 73.40
) P ( s u r o h p s o h
P 0.31 1.61*
) K ( m u i s s a t o
P 0.31 1.69*
) a C ( m u i c l a
C 0.26 4.80*
) g M ( m u i s e n g a
M 0.26 4.22*
) l A ( m u n i m u l
A 0.28 18.68
) H ( n e g o r d y
H -0.20 11.83
) S ( r u f l u
S 0.14 27.97
) a N ( m u i d o
S 0.33 0.98*
) e F ( n o r
I 0.11 56.57
) g M ( e s e n a g n a
M 0.15 27.26
) u C ( r e p p u
C 0.35 0.74*
) n Z ( c n i
Z 0.24 6.83
) B ( e r o
B 0.00 97.76
C E
C a 0.27 3.43*
%
V b 0.25 5.68
e u l a v
S c 0.28 3.01*
a i r e t c a
B 0.20 12.44
i g n u
F 0.29 2.25*
s e t e c y m o n i t c
A 0.22 9.38
t n e c s e r o u l
f Pseudomonas -0.05 72.24
m u i r a s u
F spp. 0.11 59.29
a o z o t o r
P 0.05 72.28
A D
F 0.02 90.28
O C l a t o
T 2 -0.05 73.63
R ( n o i t a n i m r e t e d f o t n e i c i f f e o
C 2) 0.51
e l b a i r a v l a u d i s e
R 0.69
Table 2 - Correlation coefficients between the biotic and abiotic variables measured on soil samples and the suppressiveness to Rhizoctonia solani.
within which the major players act must be considered, since the interactions among soil microorganism com-munities as well as the abiotic variables may influence both the structure and activities of populations, includ-ing those of pathogens and their antagonists (Weller et al., 2002).
Suppressive soils are common in ecologically balanced environments with ecosystems in climax, where the physico-chemical and microbiological
con-stituents of the soil are stabilized (Schneider, 1982). In theory, the greater the complexity of the biological community of the soil, the greater is the stability of the soil and, consequently, the level of natural biologi-cal control. Many soils possess similarities with regard to microorganisms involved in disease suppression, while other attributes are unique to specific pathogen-suppressive soil systems. The manipulation of micro-bial communities to induce a disease-suppressive soil
e l b a i r a
V Directeffect n
o R. solani
: a i v t c e f f e t c e r i d n
I Total
n o i t a l e r r o c H
p P Ca Mg H V%a Svalueb FDA
H
p -4.52 0.46 -0.09 0.17 2.24 1.57 0.71 -1.21 -0.68 P 0.86 -2.40 -0.08 0.11 1.29 0.99 0.56 -0.52 -0.68
a
C -0.10 -4.14 0.67 0.17 2.13 1.54 0.75 -1.12 -0.83 g
M 0.17 -4.44 0.55 -0.10 2.21 1.58 0.74 -1.22 -0.75 H -2.33 4.34 -0.48 0.09 -0.16 -1.56 -0.71 1.34 0.76
%
V 1.60 -4.44 0.54 -0.10 0.17 2.27 0.74 -1.24 -0.76 e
u l a v
S 0.76 -4.25 0.64 -0.10 0.17 2.17 1.57 -1.16 -0.82 A
D
F 1.84 2.96 -0.25 0.06 -0.11 -1.69 -1.08 -0.48 0.72 R ( n o i t a n i m r e t e d f o t n e i c i f f e o
C 2) 0.98
e l b a i r a v l a u d i s e
R 0.05
Table 3 - Path coefficient analysis of the relations between the suppressiveness to Rhizoctonia solani and the biotic and
abiotic correlated variables (α = 0.05) measured in soil samples from a forest-covered area.
aBase saturation. bSum of Ca, Mg, K, and Na.
e l b a i r a V t c e r i D n o t c e f f e i n a l o s . R : a i v t c e f f e t c e r i d n
I Total
n o i t a l e r r o c C
E OM N K Na Fe Mn Cu Zn CEC Svalue FDA CO2
C
E -0.24 -0.28 -0.70 0.44 -0.16 0.79 0.17 0.19 -0.60 -0.19 0.71 -0.40 0.76 0.70
M
O -0.53 -0.13 -1.27 0.40 -0.42 0.54 0.19 0.27 -0.52 -0.14 0.66 -0.67 1.53 0.80
N -1.28 -0.13 -0.53 0.39 -0.42 0.54 0.19 0.27 -0.52 -0.14 0.68 -0.67 1.56 0.81
K 0.57 -0.19 -0.36 -0.88 -0.38 1.03 0.23 0.27 -0.77 -0.24 1.05 -0.69 0.92 0.78
a
N -0.60 -0.06 -0.37 -0.88 0.36 0.60 0.22 0.28 -0.52 -0.16 0.76 -0.98 1.61 0.70
e
F 1.11 -0.17 -0.25 -0.62 0.53 -0.33 0.24 0.27 -0.76 -0.27 1.15 -0.73 0.85 0.71
n
M 0.27 -0.15 -0.37 -0.89 0.49 -0.49 0.97 0.32 -0.73 -0.26 1.17 -0.99 1.57 0.81
u
C 0.34 -0.13 -0.41 -1.00 0.45 -0.49 0.85 0.25 -0.67 -0.27 1.16 -1.03 1.75 0.86
n
Z -0.79 -0.18 -0.35 -0.85 0.55 -0.40 1.07 0.25 0.29 -0.26 1.13 -0.79 1.07 0.80
C E
C a -0.32 -0.14 -0.23 -0.56 0.43 -0.31 0.93 0.22 0.29 -0.65 1.26 -0.92 1.12 0.62
e u l a v
S b 1.33 -0.13 -0.26 -0.65 0.45 -0.35 0.96 0.24 0.30 -0.67 -0.30 -0.93 1.20 0.62
A D
F -1.14 -0.09 -0.31 -0.75 0.35 -0.52 0.71 0.24 0.31 -0.55 -0.26 1.09 1.76 0.66
O
C 2 2.07 -0.09 -0.39 -0.96 0.25 -0.47 0.46 0.21 0.29 -0.41 -0.17 0.77 -0.97 0.76 R ( n o i t a n i m r e t e d f o t n e i c i f f e o
C 2) 0.99
e l b a i r a v l a u d i s e
R 0.02
Table 4 - Path coefficient analysis of the relations between the suppressiveness to Rhizoctonia solani and the biotic and
abiotic correlated variables (α = 0.05) measured in soil samples from pasture and fallow ground areas.
environment is a potential tool in the management of soil borne plant diseases (Mazzola, 2002).
Colony counts of bacterial, fungal and actino-mycete communities on the selective media and the to-tal number of protozoan cells were not correlated with
soil supressiveness to R. solani. Considering that there
is no universal culture media, and that only a small per-centage (0.9 to 22%) of total microbial communities can be cultivated on available media (Herbert, 1990), the number of CFU obtained per group of microorgan-isms evaluated was not enough to detect differences among the analyzed soils. The potential of other or-ganisms, such as protozoa, to contribute to the suppres-siveness to plant pathogens in soils are poorly ex-plored. One of the few works on this topic was done by Homma & Ishii (1984), who observed perforation on R. solani hyphae by Arachnula impatiens (amoe-bae). Once the predominantly protozoan groups were not identified, it was not possible to determine their contribution to pathogen suppressiveness.
However, the total microbial activity, inferred by the amount of hydrolyzed FDA, was positively and highly correlated with the pathogen suppression at the pasture/fallow ground and forested areas. The
suppres-siveness to R. solani was mainly related to biotic soil
characteristics, represented by the total microbial ac-tivity of the soil (FDA hydrolysis), since this variable was correlated for the most suppressive soils (pasture/ fallow ground and forest areas). These results reinforce early reports that the pasture, fallow ground and for-est covered areas, which were classified as suppressive soils, became conducive after fumigation (Ghini & Zaroni, 2001). Positive relationships of total microbial activity and suppressiveness of soils to soilborne pathogens are well documented in the literature (Weller et al., 2002).
The two variables used to evaluate the total
microbial activity (CO2 evolution and FDA
hydroly-sis) were correlated (r = 0.71) when all samples were analyzed together, independently of the soil type and vegetation. However, when samples were grouped and analyzed by vegetation cover, the two variables were correlated (r = 0.85) only on the pasture/fallow ground
areas. In these soils, both FDA hydrolysis and CO2
evolution were correlated with suppressiveness to R.
solani. There was no correlation between the two vari-ables and only the FDA hydrolysis was correlated with suppressiveness in forested areas. The differences in contribution to suppressiveness between FDA
hydroly-sis and CO2 evolution probably reflect different
pro-cesses of microbial activity, influenced by different environmental conditions. The FDA is hydrolyzed by several enzymes (lipase, protease and esterase) from
live cells (Inbar et al., 1991), while CO2 evolution
de-pends on the total respiratory activity of the living cells.
Besides the FDA hydrolysis, the
suppressive-ness against R. solani of the two most suppressive soils
(pasture/fallow ground and forest areas) was correlated with different groups of abiotic variables. Although only the significantly correlated variables at 5% are shown, several other variables contributed to suppres-siveness at a low level of significance. These results reinforce the current knowledge that soil
suppressive-ness against R. solani could result from the biotic and
abiotic factors of the soil, in a complex set of interac-tions among the chemical, biological and physical properties of the soil (Chet & Baker, 1980; Henis et al., 1979; Kobayashi & Ko, 1985; Liu & Baker, 1980).
Suppressiveness to R. solani was measured
only by mycelial growth tests, where extension growth was measured on agar-covered soils. This separates the fungus from the soils and not all of the measured prop-erties are going to influence directly the mycelial growth. Sieved soil and physical orientation of the soil particles placed in Petri dishes also can influence the
Table 5 - Path coefficient analysis of the relations between the suppressiveness to Rhizoctonia solani and the biotic and
abiotic correlated variables (α = 0.05) measured in soil samples from annual crops areas.
aBase saturation.
e l b a i r a
V Directeffect n
o R. solani
: a i v t c e f f e t c e r i d n
I Total
n o i t a l e r r o c H
p K Mg H Mn V%
H
p -3.15 -2.46 -2.96 3.07 -2.53 -3.05 0.52 K 0.31 2.24 0.24 -0.25 0.29 0.25 0.60
g
M 1.40 1.32 1.06 -1.33 1.04 1.37 0.53 H -1.32 1.29 1.06 1.25 1.07 1.30 -0.64
n
M -1.90 -1.52 -1.76 -1.41 1.55 -1.53 0.55 %
V a 3.56 3.44 2.85 3.48 -3.50 2.86 0.58
R ( n o i t a n i m r e t e d f o t n e i c i f f e o
C 2) 0.99
e l b a i r a v l a u d i s e
growth of R. solani. Despite these methodology limi-tations, it has been used to study soil suppressiveness to several plant pathogens (De Boer et al., 1998; van Elsas et al., 2002). This study evaluated the major fac-tors in the analyzed soil samples that influence the growth of the pathogen, which is an important
suppres-siveness component but the infection of plants with R.
solani was not tested. Suppression of infection may show different results, since new variables of the plant growth should be included in the analysis. Future in-ground experiments in each vegetation type can evalu-ate more precisely pathogen-suppressive and disease-suppressive soils.
ACKNOWLEDGEMENTS
To Prof. Dr. Paulo Cézar Ceresine from UNESP/FEIS for the classification of the anastomosis
group of the R. solani isolates, and to CNPq for
re-search grant to first author.
REFERENCES
BAKER, R.; COOK, J. Biological control of plant pathogens. San Francisco: W.H. Freeman, 1974. 433p.
CHEN, W.; HOITINK, A.J.; SCHMITTHENNER, A.F.; TUOVINEN, O.H. The role of microbial activity in suppression of damping-off caused by Pythium ultimum. Phytopathology, v.78, p.314-322, 1988. CHET, H.; BAKER, R. Induction of suppressiveness to Rhizoctonia
solani in soil. Phytopathology, v.70, p.994-998, 1980.
CRUZ, C.D. Software Genes – Windows version – Computational system on Genetics and Statistics. Viçosa: Editora UFV, 2001. De BOER, W.; GUNNEWIEK, P.J.A.K.; WOLDENDORP, J.W.
Suppression of hyphal growth of soil-borne fungi by dune soils from vigorous and declining stands of Ammophila arenaria. New Phytologist, v.138, p.107-116, 1998.
EVERITT, B. Cluster analysis. 2.ed. New York: Wiley, 1981. GHINI, R.; ZARONI, M.M.H. Relação entre coberturas vegetais e
supressividade de solos a Rhizoctonia solani. Fitopatologia Brasileira, v.26, p.10-15, 2001.
GRISI, B.M. Método químico de medição da respiração edáfica: alguns aspectos técnicos. Ciência e Cultura, v.30, p.82-88, 1978. HENIS, Y.; GRAFFAR, A.; BAKER, R. Factors affecting
suppressiveness to Rhizoctonia solani in soil. Phytopathology, v.69, p.1164-1169, 1979.
HERBERT, R.A. Methods for enumerating microorganisms and determining biomass in natural environments. In: GRIGOROVA, R.; NORRIS, J.R. (Ed.) Techniques in microbial ecology. San Diego: Academic Press, 1990. p.1-39. (Methods in Microbiology, 22).
HOMMA, Y.; ISHII, M. Perforation of hyphae and sclerotia of
Rhizoctonia solani Kuhn by mycophagous soil amoebae from vegetable field soils in Japan. Annals of the Phytopathological Society of Japan, v.50, p.229-240, 1984.
INBAR, Y.; BOEHM, M.J.; HOITINK, H.A.J. Hydrolysis of fluorescein diacetate in sphagnum peat container media for predicting suppressiveness to damping-off caused by Pythium ultimum. Soil Biology and Biochemistry, v.23, p.479-483, 1991.
KO, W.; HO, W. Screening soils for suppressiveness to Rhizoctonia solani
and Pythium splendens. Annals of the Phytopathological Society of Japan, v.49, p.1-9, 1983.
KOBAYASHI, N.; KO, W.H. Nature of suppression of Rhizoctonia solani
in Hawaiian soils. Transactions of the British Mycological Society, v.84, p.691-694, 1985.
LIU, S.; BAKER, R. Mechanism of biological control in soil suppressive to Rhizoctonia solani. Phytopathology, v.70, p.404-412, 1980. MAZZOLA, M. Mechanisms of natural soil suppressiveness to soilborne
diseases. Antonie van Leeuwenhoek, v.81, p.557-564, 2002. NASH, S.M.; SNYDER, W.C. Quantitative estimations by plate counts
of propagules of the bean root rot Fusarium in field soils. Phytopathology, v.52, p.567-572, 1962.
RODRÍGUEZ-KÁBANA, R.; CALVET, C. Capacidad del suelo para controlar enfermidades de origen edafico. Fitopatologia Brasileira, v.19, p.129-138, 1994.
SCHNEIDER, R.W. Suppressive soils and plant disease. St. Paul: APS, 1982. 88p.
SILVA, F.C. Manual de análises químicas de solos, plantas e fertilizantes. Brasília: Embrapa Comunicação para Transferência de Tecnologia, 1999. 370p.
SINGH, R.K.; CHAUDARY, B.D. Biometrical methods in quantitative genetic analysis. New Delhi: Kalyani Publishers, 1979. 304p. STOTZKY, G.; BRODER, M.W.; DOYLE, J.D.; JONES, R.A. Selected
methods for the detection and assessment of ecological effects resulting from the release of genetically engineered microorganisms to the terrestrial environment. San Diego: Academic Press, 1993. 98p. (Advances in Applied Microbiology, 38).
Van BRUGGEN, A.H.C.; ARNESON, P.A. Path coefficient analysis of effects of Rhizoctonia solani on growth and development of dry beans. Phytopathology, v.76, p.874-878, 1986.
Van ELSAS, J.D.; GARBEVA, P.; SALLES, J. Effects of agronomical measures on the microbial diversity of soil as related to the suppression of soil-borne plant pathogens. Biodegradation, v.13, p.29-40, 2002.
WELLER, D.M.; RAAIJMAKERS, J.M.; GARDENER, B.B.M.; THOMASHOW, L.S. Microbial populations responsible for specific soil suppressiveness to plant pathogens. Annual Review of Phytopathology, v.40, p.309-348, 2002.
WRIGHT, S. Correlation and causation. Journal of Agricultural Research, v.20, p.557-585, 1921.