ORIGINAL ARTICLE
Family burden related to mental and physical disorders in
the world: results from the WHO World Mental Health
(WMH) surveys
Maria Carmen Viana,
1Michael J. Gruber,
2Victoria Shahly,
2Ali Alhamzawi,
3Jordi Alonso,
4Laura H. Andrade,
5Matthias C. Angermeyer,
6Corina Benjet,
7Ronny Bruffaerts,
8Jose Miguel Caldas-de-Almeida,
9Giovanni de Girolamo,
10Peter de Jonge,
11Finola Ferry,
12Silvia Florescu,
13Oye Gureje,
14Josep Maria Haro,
15Hristo Hinkov,
16Chiyi Hu,
17Elie G. Karam,
18Jean-Pierre Le´pine,
19Daphna Levinson,
20Jose Posada-Villa,
21Nancy A. Sampson,
2Ronald C. Kessler
21Department of Social Medicine, Universidade Federal do Espı´rito Santo (UFES), Vito´ria, ES, Brazil.2Department of Health Care Policy,
Harvard Medical School, Boston, MA, USA.3Al-Qadisia University, College of Medicine, Diwania, Iraq.4IMIM-Hospital del Mar Research Institute, Parc de Salut Mar, Pompeu Fabra University (UPF), and CIBER en Epidemiologı´a y Salud Pu´blica (CIBERESP), Barcelona, Spain.
5Section of Psychiatric Epidemiology - LIM-23, Department/Institute of Psychiatry, School of Medicine, Universidade de Sa˜o Paulo (USP), Sa˜o
Paulo, SP, Brazil.6Center for Public Mental Health, Go¨sing am Wagram, Austria.7Department of Epidemiologic and Psychosocial Research,
National Institute of Psychiatry Ramo´n de la Fuente, Mexico City, Mexico.8Universitair Psychiatrisch Centrum, Katholieke Universiteit Leuven
(UPC-KUL), campus Gasthuisberg, Leuven, Belgium.9Chronic Diseases Research Center (CEDOC) and Department of Mental Health,
Faculdade de Cieˆncias Me´dicas, Universidade Nova de Lisboa, Lisbon, Portugal.10IRCCS Centro S. Giovanni di Dio Fatebenefratelli, Brescia,
Italy.11University Medical Center Groningen, Groningen, The Netherlands.12Bamford Centre for Mental Health and Wellbeing, MRC Trial
Methodology Hub, University of Ulster, Londonderry, United Kingdom.13Health Services Research and Evaluation Center, National School of
Public Health Management and Professional Development, Bucharest, Romania.14Department of Psychiatry, University College Hospital, Ibadan, Nigeria.15Parc Sanitari Sant Joan de De´u, Centro de Investigacio´n Biome´dica en Red de Salud Mental (CIBERSAM), Sant Boi de Llobregat, Barcelona, Spain.16National Center for Public Health Protection, Sofia, Bulgaria.17Shenzhen Institute of Mental Health & Shenzhen Kangning Hospital, Shenzhen, PRC.18St. George Hospital University Medical Center, University of Balamand, Faculty of Medicine, Institute for Development, Research, Advocacy & Applied Care (IDRAAC), Medical Institute for Neuropsychological Disorders (MIND), Beirut, Lebanon.
19Hoˆpital Lariboisie`re Fernand Widal, Assistance Publique Hoˆpitaux de Paris, INSERM U 705, CNRS UMR 7157, University Paris Diderot and
Paris Descartes Paris, France.20Research & Planning, Mental Health Services Ministry of Health, Jerusalem, Israel.21Colegio Mayor de Cundinamarca, Bogota, Colombia.
Objective:To assess prevalence and correlates of family caregiver burdens associated with mental and physical conditions worldwide.
Methods: Cross-sectional community surveys asked 43,732 adults residing in 19 countries of the WHO World Mental Health (WMH) Surveys about chronic physical and mental health conditions of first-degree relatives and associated objective (time, financial) and subjective (distress, embarrassment) burdens. Magnitudes and associations of burden are examined by kinship status and family health problem; population-level estimates are provided.
Results:Among the 18.9-40.3% of respondents in high, upper-middle, and low/lower-middle income countries with first-degree relatives having serious health problems, 39.0-39.6% reported burden. Among those, 22.9-31.1% devoted time, 10.6-18.8% had financial burden, 23.3-27.1% reported psychological distress, and 6.0-17.2% embarrassment. Mean caregiving hours/week was 12.9-16.5 (83.7-147.9 hours/week/100 people aged 18+). Mean financial burden was 15.1% of median family income in high, 32.2% in upper-middle, and 44.1% in low/lower-middle income countries. A higher burden was reported by women than men, and for care of parents, spouses, and children than siblings.
Conclusions:The uncompensated labor of family caregivers is associated with substantial objective and subjective burden worldwide. Given the growing public health importance of the family caregiving system, it is vital to develop effective interventions that support family caregivers.
Keywords: Caregiver burden; family caregiver; cross-national; population-based; epidemiol-ogy; mental health
Introduction
Family caregivers shoulder the vast majority of long-term care responsibilities worldwide without pay or
compensa-tion.1 Widespread health trends such as greater life
expectancy and prolonged survival with severely disabling
Correspondence: Maria Carmen Viana, Departamento de Medicina Social, Universidade Federal do Espı´rito Santo (UFES), Av. Marechal Campos, 1468, Maruı´pe, CEP 29040-090, Vito´ria, ES, Brazil. E-mail: [email protected]
Submitted 27 Jun 2012, accepted 08 Aug 2012.
115–125
ß2013 Associac¸a˜o Brasileira de Psiquiatria
conditions2,3 are steadily increasing the demand for
informal care. On the other hand, socio-demographic trends such as delayed childbearing, smaller families, more divorce and remarriage, more female employment and dual-earner households, higher migration and globa-lization, and less inter-generational co-residency are
reducing the supply of family caregivers.4,5 Changing
healthcare policies (e.g., limiting hospital beds for chronic physical conditions, psychiatric deinstitutionalization) and escalating healthcare costs compound the demand for
informal caregiving.6,7 While this shift toward community
care has enormous positive value from a societal perspec-tive by sparing professional and economic resources, it presumably has negative consequences for the caregivers, including opportunity costs or foregone income, reduced
quality of life, and increased stress-related conditions.1,8,9
Indeed, considerable research over the past several decades has documented numerous adverse impacts on
caregivers, ranging from financial strain4,10 and
depres-sion11,12 to excess mortality.13 Such impacts may sig-nificantly undermine the daily functioning of the caregivers themselves, and might also predict worse prognosis and
costly institutionalization for care recipients.14
Given the dual importance of caregiving for both caregivers and care recipients, it is especially important to monitor or benchmark broad patterns in caregiver burden. However, most available research focuses narrowly on particular family conditions such as demen-tia,15,16 stroke,10 or schizophrenia7 in geographically homogeneous samples. Such focused studies are invalu-able resources on condition- or region-specific caregiver burdens, but cannot be used to generate reliable population-level estimates of total burden associated with the fuller range of mental and physical conditions occurring throughout the world population.
We extend prior epidemiologic research on caregiving by describing the prevalence and correlates of burden associated with a wide range of family mental and physical conditions in a culturally diverse and geographi-cally heterogeneous sample, hopefully providing a broader perspective on the total magnitude of caregiver burden than previously available. Specifically, we analyze large-scale community epidemiological data on caregiver burden collected from 42,732 adults residing in 19 participant countries of the WHO World Mental Health
(WMH) Survey Initiative.17
Methods
Sample
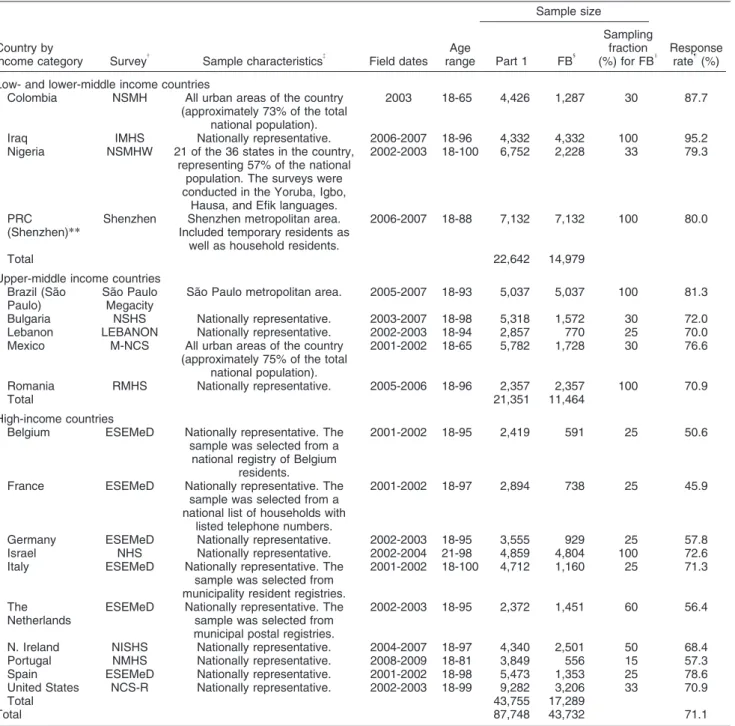
The WMH surveys consist of community-based epidemio-logical surveys conducted in countries worldwide. This report is based on data obtained from the 19 WMH surveys that assessed family burden (Table 1). Ten of these
countries are classified by the World Bank18 as
high-income countries (Belgium, France, Germany, Israel, Italy, the Netherlands, Northern Ireland, Portugal, Spain, United States), five as upper-middle income countries (Sa˜o Paulo in Brazil, Bulgaria, Lebanon, Mexico, Romania), and four as low or lower-middle income countries (Colombia, Iraq,
Nigeria, Shenzhen in the People’s Republic of China) (World Bank, 2009). All surveys were based on multi-stage, clustered-area probability household samples that were nationally representative, with the exception of two samples of only urban areas (Colombia, Mexico) and two of specific Metropolitan areas (Sa˜o Paulo, Brazil; Shenzhen, People’s Republic of China). Sample sizes ranged from 2,357 (Romania) to 9,282 (U.S.), with a total of 87,748 participating adults. The family burden-related questions were administered to random sub-samples of respondents, depending on allocation and availability of resources in each country. They were administered to a random 15% of respondents in Portugal, and to random proportions ranging from 25% (in six surveys) to 100% (in five surveys). A total of 43,732 respondents were assessed for family burden across all the countries. This is the sample included in the analyses reported in the present paper. Included here are 17,289 respondents from high-income countries; 11,464 from upper-middle income countries; and 14,979 from low/lower-middle income countries. Response rates ranged from 45.9% (France) to 95.2% (Iraq), with a weighted average of 71.1%. Weights were utilized to adjust for differential probabilities of selection within households and to match samples with population socio-demographic distributions in all countries. More details about WMH sampling and weighting
proce-dures are presented elsewhere.19
All respondents were assessed face-to-face in their homes by trained lay interviewers using the WMH Survey version of the Composite International Diagnostic
Interview (CIDI 3.0)20. Standardized WHO translation,
back-translation, and harmonization procedures were used to translate the instruments and other study materials into the different languages used in the surveys so as to maximize comparability of assessment across
countries.21 Consistent field quality control procedures,
described in more detail elsewhere,22were implemented
in all countries. Interviews were conducted after informed consent was given by respondents. All surveys were carried out strictly in compliance with procedures approved by local institutional review boards or ethical committees. These procedures are described more fully elsewhere (http://www.hcp.med.harvard.edu/wmh/ftpdir/ national sample Ethics_statement.pdf).
Measures
Table 1 WMH sample characteristics by World Bank income categories*
Country by
income category Survey{
Sample characteristics{
Field dates Age range
Sample size
Response rate"(%) Part 1 FB1
Sampling fraction (%) for FBI
Low- and lower-middle income countries
Colombia NSMH All urban areas of the country (approximately 73% of the total
national population).
2003 18-65 4,426 1,287 30 87.7
Iraq IMHS Nationally representative. 2006-2007 18-96 4,332 4,332 100 95.2 Nigeria NSMHW 21 of the 36 states in the country,
representing 57% of the national population. The surveys were conducted in the Yoruba, Igbo,
Hausa, and Efik languages.
2002-2003 18-100 6,752 2,228 33 79.3
PRC (Shenzhen)**
Shenzhen Shenzhen metropolitan area. Included temporary residents as
well as household residents.
2006-2007 18-88 7,132 7,132 100 80.0
Total 22,642 14,979
Upper-middle income countries Brazil (Sa˜o
Paulo)
Sa˜o Paulo Megacity
Sa˜o Paulo metropolitan area. 2005-2007 18-93 5,037 5,037 100 81.3
Bulgaria NSHS Nationally representative. 2003-2007 18-98 5,318 1,572 30 72.0 Lebanon LEBANON Nationally representative. 2002-2003 18-94 2,857 770 25 70.0 Mexico M-NCS All urban areas of the country
(approximately 75% of the total national population).
2001-2002 18-65 5,782 1,728 30 76.6
Romania RMHS Nationally representative. 2005-2006 18-96 2,357 2,357 100 70.9
Total 21,351 11,464
High-income countries
Belgium ESEMeD Nationally representative. The sample was selected from a
national registry of Belgium residents.
2001-2002 18-95 2,419 591 25 50.6
France ESEMeD Nationally representative. The sample was selected from a national list of households with
listed telephone numbers.
2001-2002 18-97 2,894 738 25 45.9
Germany ESEMeD Nationally representative. 2002-2003 18-95 3,555 929 25 57.8 Israel NHS Nationally representative. 2002-2004 21-98 4,859 4,804 100 72.6 Italy ESEMeD Nationally representative. The
sample was selected from municipality resident registries.
2001-2002 18-100 4,712 1,160 25 71.3
The Netherlands
ESEMeD Nationally representative. The sample was selected from municipal postal registries.
2002-2003 18-95 2,372 1,451 60 56.4
N. Ireland NISHS Nationally representative. 2004-2007 18-97 4,340 2,501 50 68.4 Portugal NMHS Nationally representative. 2008-2009 18-81 3,849 556 15 57.3 Spain ESEMeD Nationally representative. 2001-2002 18-98 5,473 1,353 25 78.6 United States NCS-R Nationally representative. 2002-2003 18-99 9,282 3,206 33 70.9
Total 43,755 17,289
Total 87,748 43,732 71.1
FB = family burden; PCR = People’s Republic of China.
*World Bank (2008). Data and Statistics. Accessed May 12, 2009 at: http://go.worldbank.org/D7SN0B8YU0
{NSMH (Colombian National Study of Mental Health); WMHI (World Mental Health India); IMHS (Iraq Mental Health Survey); NSMHW
(Nigerian Survey of Mental Health and Wellbeing); NSHS (Bulgaria National Survey of Health and Stress); LEBANON (Lebanese Evaluation of the Burden of Ailments and Needs of the Nation); M-NCS (Mexico National Comorbidity Survey); RMHS (Romania Mental Health Survey); ESEMeD (European Study of the Epidemiology of Mental Disorders); NHS (Israel National Health Survey); NISHS (Northern Ireland Study of Health and Stress); NMHS (Portugal National Mental Health Survey); NCS-R (U.S. National Comorbidity Survey Replication).
{
Most WMH surveys are based on stratified multistage clustered-area probability household samples in which samples of areas equivalent to counties or municipalities in the U.S. were selected in the first stage followed by one or more subsequent stages of geographic sampling (e.g., towns within counties, blocks within towns, households within blocks) to arrive at a sample of households, in each of which a listing of household members was created and one or two people were selected from this listing to be interviewed. No substitution was allowed when the originally sampled household resident could not be interviewed. These household samples were selected from Census area data in all countries other than France (where telephone directories were used to select households) and the Netherlands (where postal registries were used to select households). Several WMH surveys (Belgium, Germany, Italy) used municipal resident registries to select respondents without listing households. Of the 19 surveys, 14 are based on nationally representative household samples.
1
Sample size of individuals asked family burden section of the instrument.
I
The section was administered to a probability subsample of respondents, with the sampling fraction varying across surveys from a low of 15% (in Portugal) to a high of 100% (in Iraq, Romania, Sa˜o Paulo, and Shenzhen).
"The response rate is calculated as the ratio of the number of households in which an interview was completed to the number of households
originally sampled, excluding from the denominator households known not to be eligible either because of being vacant at the time of initial contact or because the residents were unable to speak the designated languages of the survey. The weighted average response rate is 71.1%.
**For the purposes of cross-national comparisons, we limit the sample to those aged 18+.
disorder; any other serious chronic mental problem). It is important to note that the final entry in each of these two sets asked about ‘‘any other serious’’ illness or problem. The logic here was to use the more concrete examples to help provide a nominal definition of the word ‘‘serious’’ in the final question in each series, while using the final question to obtain data about the great many other types of serious family member health problems that we could not capture in a condition checklist of reasonable length.
Research on caregiving traditionally distinguishes between subjective burden (e.g., distress, embarrass-ment) and objective burden (most notably, time and
money). We follow that custom in the current report.23,24
Once the conditions experienced by each first-degree relative were recorded, the burden associated with caregiving was assessed by asking respondents with at least one family member with at least one health problem: ‘‘Taking into consideration your time, energy, emotions, finances, and daily activities, would you say that (his/her/ their) health problems affect your life a lot, some, a little, or not at all?’’. Only respondents who answered ‘‘a lot’’ or ‘‘some’’ were administered further questions about burden. The first two such questions asked about subjective burden: if their relatives’ health problems caused them to be psychologically distressed (worried, anxious, or depressed) and if it caused them embarrass-ment (response options to both questions were: a lot, some, a little, not at all). Objective burden was then assessed, initially exploring the type of help required (self-care such as washing, dressing or eating; practical things like paperwork, getting around, housework, or taking medications; spending more time keeping them company or giving them emotional support than they would otherwise; or spending any time doing other things) and inquiring the amount of time spent with such help (number of hours spent currently in an average week). Respondents were also asked whether they had any financial burden (either money spent or earnings lost) due to their relatives’ health problems and, if so, the average monthly amount spent during the past year. All financial expenses reported were converted to median monthly national household income and expressed as a propor-tion of average income within the country. This transfor-mation allowed results to be pooled across countries for purposes of cross-national comparisons.
It is important to note that the questions about subjective and objective burden were all asked ‘‘in the aggregate’’; that is, with regard to all the health problems of all the relatives reported. No attempt was made to have respondents with multiple family members having multi-ple health problems estimate the amount of distress or time or financial loss associated uniquely with Condition X of Family member Y. Instead, we asked respondents to report the overall levels of subjective and objective burden associated with providing informal caregiving for all the health problems experienced by all their first-degree relatives. However, as described below, we did carry out statistical analyses aimed as sorting out the relative effects of the different health problems of different family members on these measures of overall burden.
Demographic variables
Demographic variables, including respondent age, gen-der, marital status and education, were analyzed as predictors of family burden. Age, in years, was combined into four age groups: age 18-34; age 35-49; age 50-64; and age 65 +. Marital status was categorized as never married, married and previously married. Level of educa-tional attainment was coded in the range 1-7 (where 1 = no education; 7 = college education).
Statistical analysis
All analyses were carried out in samples pooled across countries and were disaggregated only into the three World Bank categories of high-, upper-middle, and low/
lower-middle income countries.18Five dichotomous
out-come variables were included in the analysis (any burden, any time burden, any financial burden, a lot/ some psychological distress, and a lot/some embarrass-ment), and two continuous variables (amount of time in hours spent and amount of financial burden as a proportion of median household income in the country).
Regression analysis was used to sort out the relative importance of different types of health problems experi-enced by different types of family member in accounting for each outcome in the sub-sample of respondents who reported having at least one first-degree relative with at least one of the health problems assessed. Predictors included: count variables (coded 0-4) for number of types of relatives with each of the 12 health problems (i.e., 12 separate variables, each coded in the range 0-4); three count variables, each coded 0-12, for the number of types of health problems experienced by each of three types of relatives (parents, spouse, children, compared to the contrast category of siblings), and demographic controls (respondent age, sex, marital status, and education). All equations were estimated in all 19 countries combined and then separately in high-, upper-middle, and low/ lower-middle income countries.
Logistic regression analysis was used to predict dichotomous outcomes. Coefficients and standard errors were exponentiated to produce odds-ratios (OR) with 95% confidence intervals (95%CI). Generalized Linear Models (GLMs) with a log link function and Poisson error variance structure were used to predict continuous outcomes. We explored a number of different model specifications and selected the log link/Poisson model on the basis of standard fit comparisons. Coefficients and standard errors were exponentiated to produce incidence density ratios (IDR) with 95%CI. IDRs can be interpreted as ratios of expected scores on the continuous outcomes among respondents who differ by one point on the predictors.
coefficients represent causal effects.25PARP was
calcu-lated with simulation methods described elsewhere.26
The design-based jack-knife repeated replications
method27 was used to adjust standard errors for the
weighting and clustering of WMH data. Statistical significance was consistently evaluated using 0.05-level, two-sided design-based tests.
Results
Prevalence of family caregiving burden
Any serious physical or mental health problem among first-degree relatives was reported by 18.9-40.3% of respondents across country groups in the total sample (Table 2). More respondents reported serious health problems affecting their parents (12.8-22%) than spouses (1.9-5.7%), children (1.5-5.3%), or siblings (5.3-16.5%). Frequency was higher in more developed countries. Mean number of problems among those reporting any was 1.5-1.8 across country income groups, with an overall mean of 1.7 (standard error 0.015). Family physical conditions were reported by more respondents (15.2-30.6%) than mental health problems (6.3-19.0%) in the total sample. Among those with family health problems, serious physical conditions were reported by 67.7-80.4% and serious mental health problems by 33.1-53.5% of respondents. It is noteworthy that these results do not account for the number of family members a respondent actually had or for the number of family members with serious health problems a respondent had at the time of interview.
Among respondents who had ill relatives, almost 40% reported any burden in all country income groups. Objective burden was reported by 22.0-31.1% who devoted time and 10.6-18.8% who reported financial burden. Regarding subjective burden, 23.3-27.1% of
respondents with an ill relative experienced psychological distress and 6.0-17.2% reported embarrassment due to their family health problems.
Despite the likely conservative estimates of burden, as only serious health conditions affecting only first-degree relatives were assessed, mean caregiving hours/week among those devoting any time are considerable: 13.9 hours/week across all countries, slightly less in low/lower-middle income countries (12.9) than other (13.3-16.5) countries (Table 3). Population-level equivalents are 83.7-147.9 hours/week/100 people aged 18+ in the general population (which includes in the denominator those who do not have ill relatives and those with ill relatives who reported that this did not affect their life). Mean financial burden among those reporting any is also substantial: equivalent to 24.0% of the median within-country family income, with lower estimates in high (15.1%) than in upper-middle (32.2%) income countries, and up to almost half (44.1%) of the median family income in low/lower-middle income countries. Population-level equivalents are 0.50-1.81% of total sample-wide median family income among all people aged 18+ in the countries (which again includes in the denominator those who do not have ill relatives and those with ill relatives who reported that this did not affect their life). The resulting estimates can be interpreted as the total financial costs of first-degree relative serious health problems imposed on family caregivers as a percentage of total median household income in the country.
Demographic correlates of family caregiving-associated burden
With the exception of amount of financial burden, which showed no gender differences, women reported signifi-cantly more burden than men on all indicators of family burden associated with caregiving, with OR ranging from
Table 2 Prevalence and reported burden of family health problems according to country income level
Total sample, % (SE) Sub-sample with family health problems, Est (SE)*
High-income
Upper-middle
Low/lower-middle Total High income
Upper-middle
Low/lower-middle Total
Prevalence of family health problems
Parent 22.0 (0.4) 17.2 (0.4) 12.8 (0.4) 17.5 (0.2) 54.5 (0.7) 55.0 (0.9) 68.0 (1.1) 57.7 (0.5) Spouse 5.7 (0.2) 4.0 (0.2) 1.9 (0.2) 3.9 (0.1) 14.0 (0.6) 12.7 (0.6) 10.3 (0.8) 12.9 (0.4) Child 5.3 (0.2) 3.3 (0.2) 1.5 (0.1) 3.4 (0.1) 13.1 (0.5) 10.7 (0.6) 8.0 (0.6) 11.4 (0.3) Sibling 16.5 (0.4) 12.9 (0.4) 5.3 (0.3) 11.6 (0.2) 40.8 (0.7) 41.2 (1.0) 28.4 (1.2) 38.1 (0.5) Any physical 30.6 (0.5) 21.1 (0.4) 15.2 (0.4) 22.9 (0.3) 75.9 (0.6) 67.7 (1.0) 80.4 (1.0) 74.6 (0.5) Any mental 19.0 (0.4) 16.7 (0.4) 6.3 (0.3) 14.0 (0.2) 47.1 (0.7) 53.5 (1.2) 33.1 (1.2) 45.9 (0.5) Any physical or mental 40.3 (0.5) 31.2 (0.5) 18.9 (0.4) 30.6 (0.3) - - - -Mean number* 0.744 (0.015) 0.532 (0.009) 0.280 (0.009) 0.530 (0.007) 1.845 (0.024) 1.704 (0.020) 1.476 (0.020) 1.730 (0.015) Burden of family health problems
Any burden 15.9 (0.4) 12.2 (0.4) 7.5 (0.3) 12.1 (0.2) 39.0 (0.7) 39.0 (1.0) 39.6 (1.3) 39.1 (0.5) Any time 11.3 (0.3) 6.9 (0.3) 5.9 (0.3) 8.3 (0.2) 27.6 (0.6) 22.0 (0.8) 31.1 (1.2) 26.8 (0.4) Any financial 4.3 (0.2) 4.1 (0.2) 3.6 (0.2) 4.0 (0.1) 10.6 (0.4) 13.1 (0.7) 18.8 (0.9) 13.0 (0.3) Distress{ 9.5 (0.3) 8.4 (0.3) 5.1 (0.3) 7.7 (0.2) 23.3 (0.6) 27.0 (0.8) 27.1 (1.2) 25.1 (0.5) Embarrassment{
2.4 (0.1) 5.4 (0.3) 1.6 (0.2) 2.9 (0.1) 6.0 (0.3) 17.2 (0.8) 8.6 (0.8) 9.5 (0.3)
n 17,289 11,464 14,979 43,732 7,080 3,792 3,027 13,899
Est = estimate; SE = standard error.
*Mean number of family health problems out of 48 (12 types of problems for each of four types of family members).
{
A lot or some distress or embarrassment reported in response to questions about intensity of these feelings.
1.2 to 2.0. These gender differences were relatively consistent across country income groups. The highest female-to-male OR were related to reporting significantly more distress (1.6 [95%CI 1.4-1.8] to 2.0 [95%CI 1.6-2.5]), any burden (1.2 [95%CI 1.0-1.5] to 1.8 [95%CI 1.4-2.1]), and any time (1.2 [95%CI 1.0-1.4] to 1.8 [95%CI 1.4-2.2]) due to family health conditions. Older cohorts (age 50-64) were more likely to spend any time and report any financial burden in caring for ill family members than younger cohorts (age 18-49) or the oldest respondents (65 +), but all younger age groups reported spending less time on family health problems than older respondents (65 +), with OR in the range 0.5-0.7. There were no consistent patterns related to marital status predicting burden, although those never married reported more embarrassment (OR 1.7 (95%CI 1.1-2.6) in low/lower-middle income countries and financial expenditure (OR 1.9 (95%CI 1.2-3.2) in upper-middle income countries than married respondents; and those previously married reported devoting less time (OR 0.6 (95%CI 0.5-0.8) in high-income countries and higher financial expenditure (OR 2.2 (95%CI 1.0-4.8) in upper-middle income coun-tries compared to married respondents. Education was significantly related to time and financial burden only in high income countries, but with quite small odds-ratios (OR 1.1). (Tables with these results from total-sample multivariate models are available on request.)
Variations in burden by type of ill relative and health problem
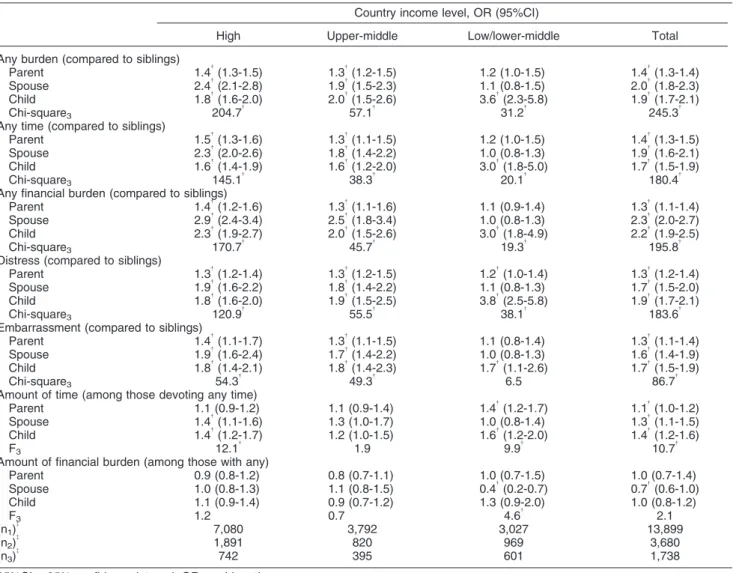
Total-sample multivariate models show spouse and child health problems are associated with highest burden, parents’ health problems with intermediate burden, and sibling problems with lowest burden across all indicators of burden associated with caregiving (Table 4). The only
exception is amount of financial expenditure, where type of ill relative is not significant. This pattern is consistent for high- and upper-middle country income groups, while for low/lower-middle income countries, only children’s health problems are consistently associated with all burden outcomes.
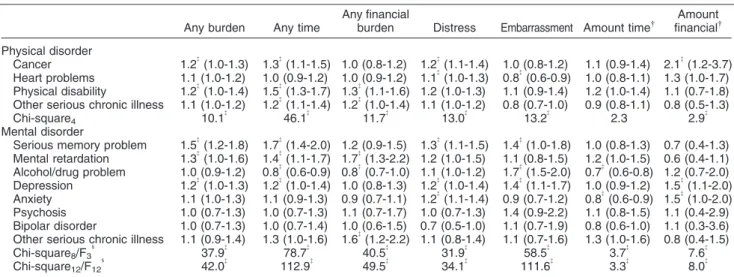
Significant variation in family burden was also related to type of health problems (Table 5). Physical conditions, overall, were not related to reporting embarrassment. Cancer and physical disability were the conditions associated with more family burden indicators, with OR in the range of 1.2-1.5. Regarding mental disorders, serious memory problem, mental retardation, depression, and anxiety were associated with increased odds of several burden outcomes, with OR in the range of 1.2-1.7. Family alcohol/drug-related problems were the only conditions associated with reduced odds of devoting any time (0.8; 95%CI 0.6-0.9), and reporting financial burden (0.8; 95%CI 0.7-1.0) and reduced magnitude of time devoted (0.7; 95%CI 0.6-0.8), but also with elevated odds for reporting embarrassment (1.7; 95%CI 1.5-2.0). Furthermore, family member alcohol/drug problems (0.7; 0.6-0.8) and anxiety (0.8; 0.6-0.9) were the only two problems consistently associated with significantly lower amounts of time spent among people who devote any time. The conditions significantly associated with reporting any burden were cancer (1.2; 95%CI 1.0-1.3), physical disability (1.2; 95%CI 1.0-1.4), serious memory problem (1.5; 95%CI 1.2-1.8), mental retardation (1.3; 95%CI 1.0-1.6), and depression (1.2; 95%CI 1.0-1.3). The health conditions associated with devoting any time were cancer (1.3; 95%CI 1.1-1.5), physical disability (1.5; 95%CI 1.3-1.7), other serious chronic physical illness (1.2; 95%CI 1.1-1.4), serious memory problem (1.7; 95%CI 1.4-2.0), mental retardation (1.4; 95%CI 1.1-1.7), and depression (1.2; 95%CI 1.0-1.4). Having a family
Table 3 Individual-level and population-level time and financial burdens of family health problems
Country income level, Est (SE)
High Upper-middle Low/lower-middle Total
Time (hours per week)
Individual level (mean)* 13.3 (0.7) 16.5 (1.6) 12.9 (0.9) 13.9 (0.6) Per 100 in the population (total){
147.9 (2.2) 117.8 (1.6) 83.7 (2.8) 118.0 (1.2) Financial (mean percent of median household income)
Individual level{
15.1 (0.9) 32.2 (2.1) 44.1 (5.3) 24.0 (1.1) Per 100 in the population1
0.50 (0.02) 1.09 (0.04) 1.81 (0.07) 1.01 (0.03) (n1)
I
(1,891) (820) (969) (3,680)
(n2)
I
(742) (395) (601) (1,738)
(n3)
I
(17,289) (11,464) (14,979) (43,732)
Est = estimate; SE = standard error.
*Individual-level reports of hours per week spent with or doing things for ill family members
{The population-level estimate was obtained by multiplying the individual-level estimate by the proportion of respondents who reported
spending any time. {
Individual-level reports of financial burden were converted to percentages of median household income in the country. The means of these transformed scores among respondents who reported any financial burden are reported here. For example, the mean monthly financial impact of family illness (due either to out-of-pocket expenses or foregone income) across countries among respondents who reported such costs was equal to 24.0% of the median monthly household income in the country.
1The population-level estimate of financial burden was obtained by multiplying the individual-level estimate by the proportion of respondents
who reported such burdens. The resulting estimate can be interpreted as the total financial costs of family health problems as a percentage of total household income in the country.
I
n1= sub-sample of respondents who devoted any time to family health problems; n2= sub-sample of respondents with any financial burden
member with heart problems was the only condition associated with lower embarrassment than the other health problems assessed (0.8; 95%CI 0.6-0.9). Together with cancer (2.1; 95%CI 1.2-3-7), depression (1.5; 95%CI 1.1-2.0) and anxiety (1.5; 95%CI 1.0-2.0) were the only problems associated with greater amount of financial burden among those having any.
Population attributable risk proportions (PARPs)
As noted above, PARP can be interpreted as the percentage of all burden of a particular type in the population that can be attributed to a particular condition
or set of conditions. PARPS are consistently highest for caring for parent health problems in all country income groups, for both amount of time (26.9-31.4%) and financial resources (31.0-35.2%) devoted (Table 6). It is noteworthy that this is true despite the fact that parent health problems were not found to be associated with the highest levels of burden at the individual level. The reason for the discrepancy is that PARP takes into consideration both individual-level strength of associa-tions and distribuassocia-tions of the predictors. Parent health problems have the highest PARPs because they are both commonly occurring compared to the health problems of other relatives (see Table 2) and impactful (see Table 4).
Table 4 Differential burdens of family health problems by type of relative*
Country income level, OR (95%CI)
High Upper-middle Low/lower-middle Total
Any burden (compared to siblings)
Parent 1.4{(1.3-1.5) 1.3{(1.2-1.5) 1.2 (1.0-1.5) 1.4{(1.3-1.4)
Spouse 2.4{
(2.1-2.8) 1.9{
(1.5-2.3) 1.1 (0.8-1.5) 2.0{
(1.8-2.3) Child 1.8{(1.6-2.0) 2.0{(1.5-2.6) 3.6{(2.3-5.8) 1.9{(1.7-2.1)
Chi-square3 204.7
{
57.1{
31.2{
245.3{
Any time (compared to siblings)
Parent 1.5{
(1.3-1.6) 1.3{
(1.1-1.5) 1.2 (1.0-1.5) 1.4{
(1.3-1.5)
Spouse 2.3{
(2.0-2.6) 1.8{
(1.4-2.2) 1.0 (0.8-1.3) 1.9{
(1.6-2.1) Child 1.6{(1.4-1.9) 1.6{(1.2-2.0) 3.0{(1.8-5.0) 1.7{(1.5-1.9)
Chi-square3 145.1
{
38.3{
20.1{
180.4{
Any financial burden (compared to siblings)
Parent 1.4{
(1.2-1.6) 1.3{
(1.1-1.6) 1.1 (0.9-1.4) 1.3{
(1.1-1.4) Spouse 2.9{(2.4-3.4) 2.5{(1.8-3.4) 1.0 (0.8-1.3) 2.3{(2.0-2.7)
Child 2.3{
(1.9-2.7) 2.0{
(1.5-2.6) 3.0{
(1.8-4.9) 2.2{
(1.9-2.5)
Chi-square3 170.7
{
45.7{ 19.3{ 195.8{
Distress (compared to siblings)
Parent 1.3{
(1.2-1.4) 1.3{
(1.2-1.5) 1.2{
(1.0-1.4) 1.3{
(1.2-1.4) Spouse 1.9{(1.6-2.2) 1.8{(1.4-2.2) 1.1 (0.8-1.3) 1.7{(1.5-2.0)
Child 1.8{
(1.6-2.0) 1.9{
(1.5-2.5) 3.8{
(2.5-5.8) 1.9{
(1.7-2.1)
Chi-square3 120.9
{
55.5{ 38.1{ 183.6{
Embarrassment (compared to siblings)
Parent 1.4{(1.1-1.7) 1.3{(1.1-1.5) 1.1 (0.8-1.4) 1.3{(1.1-1.4)
Spouse 1.9{
(1.6-2.4) 1.7{
(1.4-2.2) 1.0 (0.8-1.3) 1.6{
(1.4-1.9) Child 1.8{(1.4-2.1) 1.8{(1.4-2.3) 1.7{(1.1-2.6) 1.7{(1.5-1.9)
Chi-square3 54.3
{
49.3{
6.5 86.7{
Amount of time (among those devoting any time)
Parent 1.1 (0.9-1.2) 1.1 (0.9-1.4) 1.4{
(1.2-1.7) 1.1{
(1.0-1.2)
Spouse 1.4{
(1.1-1.6) 1.3 (1.0-1.7) 1.0 (0.8-1.4) 1.3{
(1.1-1.5) Child 1.4{(1.2-1.7) 1.2 (1.0-1.5) 1.6{(1.2-2.0) 1.4{(1.2-1.6)
F3 12.1
{
1.9 9.9{
10.7{
Amount of financial burden (among those with any)
Parent 0.9 (0.8-1.2) 0.8 (0.7-1.1) 1.0 (0.7-1.5) 1.0 (0.7-1.4) Spouse 1.0 (0.8-1.3) 1.1 (0.8-1.5) 0.4{(0.2-0.7) 0.7{(0.6-1.0) Child 1.1 (0.9-1.4) 0.9 (0.7-1.2) 1.3 (0.9-2.0) 1.0 (0.8-1.2)
F3 1.2 0.7 4.6
{
2.1 (n1)
{
7,080 3,792 3,027 13,899
(n2)
{
1,891 820 969 3,680
(n3)
{
742 395 601 1,738
95%CI = 95% confidence interval; OR = odds ratio.
*Based on multivariate models (logistic for dichotomous outcomes; GLM for continuous outcomes with log link function and Poisson error distribution) with predictors that included a separate count variable (coded 0-4) for the number of types of relatives with each of the 12 health problems, a separate count variable for (coded 0-12) for the number of types of health problems experienced by each of 3 types of relatives (parents, spouse, children, compared to the implicit contrast category of siblings), and demographic controls (respondent age, sex, marital status, and level of educational attainment). All equations were estimated in a pooled dataset across either the entire set of 19 countries or in the high, upper-middle, and low/lower-middle income countries. Romania was removed from the models for financial burden, as this aspect of burden was not assessed in Romania.
Coefficient estimates (Est) are odds-ratios for the first five outcomes (I-V), all of which are dichotomies, and incidence density ratios for the last two outcomes (VI-VII), which are continuous.
{
Significant at the 0.05 level, two-sided test. {
n1= total sub-sample of respondents with family health problems; n2= sub-sample of respondents who devoted any time to family health
problems; n3= sub-sample of respondents with any financial burden due to family health problems.
Similarly, sibling health problems were associated with smallest PARPs in all country groups, less for time devoted (1.8-3.0%) than for financial burden (9.7-10.6%). This reflects the joint occurrence of low prevalence and low individual-level effects of sibling health problems. In high- and upper-middle income countries, PARPs related to time devoted to health problems of spouses (18.6-18.7%) and children (17.6-17.7%) were similar, but were greater for children (15.8-16.7%) than for spouses (10.3-13-6%) when financial burden is concerned. In low/lower-middle income coun-tries, PARPs associated with both time and financial resources are greater for children (16.9; 13.2%) com-pared to spouses (11.5; 9.3%). Despite these
between-relative differences in PARPs, the health problems of parents, spouses, and children all have meaningful PARPs with time and/or financial burden for these sets of relatives, accounting for meaningful components of burden in all three country groups.
Another consistent pattern is that PARPs associated with physical disorders are higher than those associated with mental disorders in all country income groups (44.0-47.8% vs. 20.7-36.8%). However, the comparative importance of mental disorders is much higher than that expected from relative prevalence (Table 2), which might be explained by the generally higher individual-level associations of mental disorders (especially mental retardation, serious memory problems, and depression)
Table 5 Differential burdens of family health problems by type of problem in the total sample (n = 13,899), OR (95%CI)*
Any burden Any time
Any financial
burden Distress Embarrassment Amount time{ financialAmount{
Physical disorder
Cancer 1.2{
(1.0-1.3) 1.3{
(1.1-1.5) 1.0 (0.8-1.2) 1.2{
(1.1-1.4) 1.0 (0.8-1.2) 1.1 (0.9-1.4) 2.1{
(1.2-3.7) Heart problems 1.1 (1.0-1.2) 1.0 (0.9-1.2) 1.0 (0.9-1.2) 1.1{
(1.0-1.3) 0.8{
(0.6-0.9) 1.0 (0.8-1.1) 1.3 (1.0-1.7) Physical disability 1.2{(1.0-1.4) 1.5{(1.3-1.7) 1.3{(1.1-1.6) 1.2 (1.0-1.3) 1.1 (0.9-1.4) 1.2 (1.0-1.4) 1.1 (0.7-1.8) Other serious chronic illness 1.1 (1.0-1.2) 1.2{
(1.1-1.4) 1.2{
(1.0-1.4) 1.1 (1.0-1.2) 0.8 (0.7-1.0) 0.9 (0.8-1.1) 0.8 (0.5-1.3) Chi-square4 10.1
{
46.1{ 11.7{ 13.0{ 13.2{ 2.3 2.9{ Mental disorder
Serious memory problem 1.5{(1.2-1.8) 1.7{(1.4-2.0) 1.2 (0.9-1.5) 1.3{(1.1-1.5) 1.4{(1.0-1.8) 1.0 (0.8-1.3) 0.7 (0.4-1.3) Mental retardation 1.3{
(1.0-1.6) 1.4{
(1.1-1.7) 1.7{
(1.3-2.2) 1.2 (1.0-1.5) 1.1 (0.8-1.5) 1.2 (1.0-1.5) 0.6 (0.4-1.1) Alcohol/drug problem 1.0 (0.9-1.2) 0.8{(0.6-0.9) 0.8{(0.7-1.0) 1.1 (1.0-1.2) 1.7{(1.5-2.0) 0.7{(0.6-0.8) 1.2 (0.7-2.0) Depression 1.2{
(1.0-1.3) 1.2{
(1.0-1.4) 1.0 (0.8-1.3) 1.2{
(1.0-1.4) 1.4{
(1.1-1.7) 1.0 (0.9-1.2) 1.5{
(1.1-2.0) Anxiety 1.1 (1.0-1.3) 1.1 (0.9-1.3) 0.9 (0.7-1.1) 1.2{
(1.1-1.4) 0.9 (0.7-1.2) 0.8{
(0.6-0.9) 1.5{
(1.0-2.0) Psychosis 1.0 (0.7-1.3) 1.0 (0.7-1.3) 1.1 (0.7-1.7) 1.0 (0.7-1.3) 1.4 (0.9-2.2) 1.1 (0.8-1.5) 1.1 (0.4-2.9) Bipolar disorder 1.0 (0.7-1.3) 1.0 (0.7-1.4) 1.0 (0.6-1.5) 0.7 (0.5-1.0) 1.1 (0.7-1.9) 0.8 (0.6-1.0) 1.1 (0.3-3.6) Other serious chronic illness 1.1 (0.9-1.4) 1.3 (1.0-1.6) 1.6{(1.2-2.2) 1.1 (0.8-1.4) 1.1 (0.7-1.6) 1.3 (1.0-1.6) 0.8 (0.4-1.5) Chi-square8/F3
1
37.9{
78.7{
40.5{
31.9{
58.5{
3.7{
7.6{
Chi-square12/F12
1
42.0{ 112.9{ 49.5{ 34.1{ 111.6{ 3.3{ 8.0{
95%CI = 95% confidence interval; IDR = incidence density ratio; OR = odds ratio.
*Based on multivariate models (logistic for dichotomous outcomes; GLM for continuous outcomes with log link function and Poisson error distribution) with predictors that included a separate count variable (coded 0-4) for the number of types of relatives with each of the 12 health problems, a separate count variable for (coded 0-12) for the number of types of health problems experienced by each of 3 types of relatives (parents, spouse, children, compared to the implicit contrast category of siblings), and demographic controls (respondent age, sex, marital status, and level of educational attainment). All equations were estimated in a pooled dataset across the entire set of 19 countries. Romania was removed from the models for financial burden, as this aspect of burden was not assessed in Romania. Parallel tables for high, upper-middle, and low/lower-middle income countries are not presented but are available on request.
{Significant at the 0.05 level, two-sided test.
1
Chi-square tests were used for the first five (dichotomous) outcomes and F tests for the last two (continuous) outcomes.
Table 6 Significant population attributable risk proportions of time and financial burdens due to family health problems
Country income level, time / financial
High Upper-middle Low/lower-middle Total
Time Financial Time Financial Time Financial Time Financial
Type of relative
Parent 27.8 35.2 26.9 31.6 31.4 31.0 28.4 31.9
Spouse 18.7 10.3 18.6 13.6 11.5 9.3 17.0 10.4
Child 17.6 15.8 17.7 16.7 16.9 13.2 17.5 14.5
Sibling 2.6 10.6 1.8 9.7 3.0 10.2 2.5 10.2
Type of health problem
Physical* 44.1 47.6 44.0 45.8 46.0 47.8 44.5 47.3
Mental{
29.6 35.5 28.7 36.8 22.4 20.7 27.7 26.9
(n) 7,080 3,792 3,027 13,899
Numbers presented represent the % increase in time/money spent when the given conditions are present (for example, there is a 28.4 increase in time spent when parent burdens are accounted for vs. when they are taken completely out).
*All physical conditions include cancer, heart problems, physical disability, other physical illness (four total).
{All mental conditions include alcohol/drug, depression, memory problem, mental retardation, anxiety, schizophrenia, manic depression,
than physical disorders with most burden dimensions (Table 5). In other words, physical disorders are more important than mental disorders in terms of PARP due to their higher prevalence, not to their higher individual-level effects.
It is noteworthy that the sums of PARP estimates across types of relative are consistently less than 100 (varying from 62.8 to 71.9) and the sums of PARP estimates across types of illness vary from 72.2 to 83.1. This is due to the fact that PARP estimates were calculated one at a time for individual conditions that in many cases overlapped in their occurrence with other conditions. This pattern indicates that the joint effects of compound caregiving on burden are not completely captured in the disorder-specific and relative-specific PARP estimates computed here.
Discussion
The results reported here indicate that the caregiving burdens associated with serious family mental and physical conditions are substantial in the 19 countries considered. Although the magnitude and characteristics of burden are broadly consistent with the previous reports on burden associated with more specific health
condi-tions,7,10,16our results are unique in providing
population-level estimates of subjective and objective burden associated with the full range of health problems affecting first-degree relatives that people considered to be serious. The magnitudes of these population-level esti-mates are stunning. Concerning financial burden, the 3.6% of people in low/lower-middle income countries who report financial burden associated with caregiving for ill relatives devote up to 44% of median household income to these activities, as do 32% of those in upper-middle income countries (among those 4.1% reporting this burden). The population-level equivalent financial burden of informal family caregiving is estimated to be of 1.8% and 1.1% of total household income in the country respectively. To put these percentages into perspective, they would translate into R$ 12.1 billion (Reais) per year in Brazil alone (considering 134 million population aged 18+, 57% economically active, R$ 1,202.00 average
monthly income).28
Again considering Brazil alone, the total of 117.8 hours/ week per 100 population aged 18+ in the burden of informal caregiving in terms of time would translate into over 3.9 million Brazilian adults (18+) involved full-time (40 hours/week) in family caregiving, producing an estimation of potential foregone wages of over R$ 56 billion per year. These population-level estimates are helpful in assessing the magnitude of the objective burden associated with informal family caregiving. An earlier analysis of family caregiver burden among older caregivers (50+) assessed within part of the same
sampling frame29found that older family caregivers were
more likely to devote time and less likely to spend money on individual-level analyses across country income groups, possibly as a result of their age-related condition, i.e., being retired and having grown children.
As noted in the introduction, women have traditionally been responsible for caring for ill family members in most
cultures.30-32 It is notable in this regard that we found
women are more burdened than men with family caregiv-ing demands regardcaregiv-ing time, and experience the greatest subjective burdens associated with caregiving. These findings are consistent with previous more focused studies of caregivers of relatives with one particular type of
condition.15,33,34 It is interesting that we found higher
psychological distress related to family caregiving among women than men, with higher OR than for other dimen-sions of burden. This means that it is not merely that women devote more time and that the time itself is the key determinant of the distress and other psychological burdens experienced by female caregivers. Instead, we find implicitly that female caregivers are more likely to experience subjective burden than male caregivers who devote the same amounts of time and money to their ill relatives. The only exception to this pattern is the magnitude of financial expenditure, as, compared with men, women are less likely to be employed and more likely
to earn less on the same jobs and raise children alone.35,36
As reported in previous studies, there was evidence that family mental health conditions were associated with higher family burden than were physical conditions ‘‘at the
individual level’’37,38; that is, in comparing the likelihood of
a given caregiver experiencing burden as a function of whether their relative’s illness was a mental disorder or a physical disorder. This finding is especially striking given that the analysis was biased against finding between-condition differences in burden (as we asked respondents to tell us only about ‘‘serious’’ relative health problems), and we would expect this truncation of the severity distribution to reduce evidence of between-condition differences in burden. However, the results were different at the societal level, where we found that physical health problems were more important than mental health problems in the aggregate due to a much higher prevalence of the former.
Likewise, although we found that the individual-level burden of the health conditions of spouses and children was higher than that of the health conditions of parents
or siblings, which is consistent with previous
research,38,39 societal-level burden was most strongly
associated with the conditions of parents. This higher importance of parents at the population level reflects the fact that parent illnesses requiring assistance are more common than those of other first-degree relatives. It is worth emphasizing that family alcohol and drug-related problems were the only conditions associated with reduced objective burden and with higher embarrass-ment, possibly reflecting the common sense view of substance abuse as a stigmatized social problem rather than as a health-related condition.
These results must be interpreted in the context of several study limitations. People with the greatest caregiver burden might have been less likely than others to participate in the survey due to the demands on their time, in which case our estimates of caregiver burden would be conservative. As respondents were asked to
report only on self-defined ‘‘serious’’ family health problems that occurred only to first-degree relatives, some unknown proportion of overall caregiver burden was excluded from analysis. Finally, the broader focus of this study design did not allow in-depth explorations of other important aspects of family caregiving and asso-ciated burden, such as impact on caregiver quality of life, physical health, or stress-buffering supports, which have
been the focus of other studies.11,12,15,40 Finally, the
WMH surveys did not collect data on the number of family members a respondent had and/or lived with, the extent of relatives that were encompassed within the core family in different countries, or the number of family members of a given type with a particular type of illness, imposing restrictions on the extent to which we could carry out fine-grained analyses of complex caregiving situations.
The foregoing limitations notwithstanding, this study provides robust evidence for the existence of substantial burden imposed on informal family caregivers of first-degree relatives having serious health problems across a wide range of countries. Such uncompensated family caregiving has tremendous value from a public health perspective by offsetting the costs and services of expensive and critically shorthanded healthcare profes-sionals. It is consequently vital from a societal perspec-tive to maintain the functional integrity of the informal family caregiving system. Nevertheless, results such as those presented here, documenting as they do high-and, perhaps, ultimately unsustainable—levels of caregiver burden, should raise serious concerns among policy-makers. This is all the more true given widespread demographic trends persistently moving in a direction predictive of increased demands on the world’s informal family caregivers. It is therefore crucial that we continue to refine our understanding of the correlations and magnitude of caregiver burden, and develop, implement, evaluate, and sustain effective interventions to reduce these burdens in an effort to guarantee the continued integrity of the informal family caregiving system.
Acknowledgments
The World Health Organization World Mental Health (WMH) Survey Initiative activities were supported by the United States National Institute of Mental Health (R01MH070884), NIMH - Mental Health Burden Study: Contract number HHSN271200700030C, the John D. and Catherine T. MacArthur Foundation, the Pfizer Foundation, the US Public Health Service (R13-MH066849, R01-MH069864, and R01 DA016558), the Fogarty International Center (FIRCA R03-TW006481), the Pan American Health Organization, the Eli Lilly & Company Foundation, Ortho-McNeil Pharmaceutical, Inc., GlaxoSmithKline, Bristol-Myers Squibb, and Shire. We thank the WMH staff for assistance with instrumentation, fieldwork, and data analysis. A complete list of WMH publications can be found at http://www.hcp.med.harvard. edu/wmh/. The Sa˜o Paulo Megacity Mental Health Survey is supported by the State of Sa˜o Paulo Research Foundation (FAPESP) Thematic Project Grant 03/00204-3. The
Bulgarian Epidemiological Study of common mental dis-orders EPIBUL is supported by the Ministry of Health and the National Center for Public Health Protection. The Chinese World Mental Health Survey Initiative is supported by the Pfizer Foundation. The Shenzhen Mental Health Survey is supported by the Shenzhen Bureau of Health and the Shenzhen Bureau of Science, Technology, and Information. The Colombian National Study of Mental Health (NSMH) is supported by the Ministry of Social Protection. The ESEMeD project is funded by the European Commission (Contracts
QLG5-1999-01042; SANCO 2004123, and EAHC
Development, Bucharest), with technical support from Metro Media Transilvania, the National Institute of Statistics -National Centre for Training in Statistics, SC. Cheyenne Services SRL, and Statistics Netherlands, and were funded by the Ministry of Public Health (former Ministry of Health) with supplemental support from Eli Lilly Romania SRL. The U.S. National Comorbidity Survey Replication (NCS-R) is supported by the National Institute of Mental Health (NIMH; U01-MH60220) with supplemental support from the National Institute of Drug Abuse (NIDA), the Substance Abuse and Mental Health Services Administration (SAMHSA), the Robert Wood Johnson Foundation (RWJF; Grant 044708), and the John W. Alden Trust.
Disclosure
The authors report no conflicts of interest.
References
1 Carter R. Addressing the caregiving crisis. Prev Chronic Dis. 2008;5:A02.
2 Lee R. The outlook for population growth. Science. 2011;333:569-73. 3 Wiener J. Chapter 1. The role of informal support in long-term care. In: World Health Organization. Key policy issues in long-term care [Internet]. 2003 [cited 2011 Nov 9]. http://whqlibdoc.who.int/publica-tions/2003/9241562250.pdf
4 Heitmueller A, Inglis K. The earnings of informal carers: wage differentials and opportunity costs. J Health Econ. 2007;26:821-41. 5 Lamura G, Mnich E, Nolan M, Wojszel B, Krevers B, Mestheneos L,
et al. Family carers’ experiences using support services in Europe: empirical evidence from the EUROFAMCARE study. Gerontologist. 2008;48:752-71.
6 Dosman D, Keating N. Cheaper for whom? Costs experienced by formal caregivers in adult family living programs. J Aging Soc Policy. 2005;17:67-83.
7 Awad AG, Voruganti LN. The burden of schizophrenia on caregivers: a review. Pharmacoeconomics. 2008;26:149-62.
8 Sales E. Family burden and quality of life. Qual Life Res. 2003;12:33-41.
9 Jacobzone S. Coping with aging: international challenges. Health Aff (Millwood). 2000;19:213-25.
10 Hickenbottom SL, Fendrick AM, Kutcher JS, Kabeto MU, Katz SJ, Langa KM. A national study of the quantity and cost of informal caregiving for the elderly with stroke. Neurology. 2002;58:1754-9. 11 Opree SJ, Kalmijn M. Exploring causal effects of combining work and
care responsibilities on depressive symptoms among middle-aged women. Ageing Soc. 2012;32:130-46.
12 Pinquart M, So¨rensen S. Differences between caregivers and noncaregivers in psychological health and physical health: a meta-analysis. Psychol Aging. 2003;18:250-67.
13 Christakis NA, Allison PD. Mortality after the hospitalization of a spouse. N Engl J Med. 2006;354:719-30.
14 Lauber C, Keller C, Eichenberger A, Ro¨ssler W. Family burden during exacerbation of schizophrenia: quantification and determi-nants of additional costs. Int J Soc Psychiatry 2005;51:259-64. 15 Torti FM Jr, Gwyther LP, Reed SD, Friedman JY, Schulman KA. A
multinational review of recent trends and reports in dementia caregiver burden. Alzheimer Dis Assoc Disord. 2004;18:99-109. 16 Wimo A, Winblad B, Jo¨nsson L. An estimate of the total worldwide
societal costs of dementia in 2005. Alzheimers Dement. 2007;3:81-91. 17 Kessler RC, U¨ stu¨n TB, editors. The WHO World Mental Health Surveys: global perspectives on the epidemiology of mental disorders. New York: Cambridge University Press; 2008.
18 World Bank. [Internet]. Data: countries and economies. 2009 [cited 2011 Nov 9]. http://data.worldbank.org/country
19 Heeringa SG, Wells EJ, Hubbard F, Mneimneh ZN, Chiu WT, Sampson NA, et al. Sample designs and sampling procedures. In: RC Kessler and TB U¨ stu¨n, editors. The WHO World Mental Health
Surveys: global perspectives on the epidemiology of mental disorders. New York: Cambridge University Press; 2008. p. 14-32. 20 Kessler RC, U¨ stu¨n TB. The World Mental Health (WMH) survey
initiative version of the World Health Organization (WHO) Composite International Diagnostic Interview (CIDI). Int J Methods Psychiatr Res. 2004;13:93-121.
21 Harkness J, Pennell BE, Villar A, Gebler N, Aguilar-Gaxiola S, Bilgen I. Translation procedures and translation assessment in the World Mental Health survey initiative. In: Kessler RC, U¨ stu¨n TB, editors. The WHO World Mental Health Surveys: global perspectives on the epidemiology of mental disorders. New York: Cambridge University Press; 2008. p. 91-113.
22 Pennell B-E, Mneimneh Z, Bowers A, Chardoul S, Wells JE, Viana MC, et al. Implementation of the World Mental Health Surveys. In: Kessler RC, U¨ stu¨n TB, editors. The WHO World Mental Health Surveys: global perspectives on the epidemiology of mental disorders. New York: Cambridge University Press; 2008. p. 33-57. 23 Hudson PL, Trauer T, Graham S, Grande G, Ewing G, Payne S, et al.
A systematic review of instruments related to family caregivers of palliative care patients. Palliat Med. 2010;24:656-68.
24 Idstad M, Røysamb E, Tambs K. The effect of change in mental disorder status on change in spousal mental health: the HUNT study. Soc Sci Med. 2011;73:1408-15.
25 Northridge ME. Public health methods--attributable risk as a link between causality and public health action. Am J Public Health. 1995;85:1202-4.
26 Levinson D, Lakoma MD, Petukhova M, Schoenbaum M, Zaslavsky AM, Angermeyer M, et al. Associations of serious mental illness with earnings: results from the WHO World Mental Health Surveys. Br J Psychiatry. 2010;197:114-21.
27 Wolter KM. Introduction to variance estimation. New York: Springer-Verlag; 1985.
28 Instituto Brasileiro de Geografia e Estatı´stica (IBGE). [Internet]. Indicadores IBGE: Pesquisa mensal de emprego. 2012 May [cited 2013 May 21]. http://www.ibge.gov.br/home/estatistica/indicadores/ trabalhoerendimento/pme_nova/pme_201205pubCompleta.pdf 29 Shahly VS, Chatterji S, Gruber M, Al-Hamzawi A, Alonso J, Andrade
LH, et al. Cross-national differences in the prevalence and correlates of burden among older family caregivers in the WHO World Mental Health (WMH) Surveys. Psychol Med. 2013;43:865-79.
30 Mendez-Luck CA, Kennedy DP, Wallace SP. Concepts of burden in giving care to older relatives: a study of female caregivers in a Mexico City neighborhood. J Cross Cult Gerontol. 2008;23:265-82. 31 Javadpour A, Ahmadzadeh L, Bahredar MJ. An educative support
group for female family caregivers: impact on caregivers psycholo-gical distress and patient’s neuropsychiatry symptoms. Int J Geriatr Psychiatry. 2009;24:469-71.
32 Wells JN, Cagle CS, Marshall D, Hollen ML. Perceived mood, health, and burden in female Mexican American family cancer caregivers. Health Care Women Int. 2009;30(7):629-54.
33 Navaie-Waliser M, Spriggs A, Feldman PH. Informal caregiving: differential experiences by gender. Med Care. 2002;40:1249-59. 34 Pinquart M, So¨rensen S. Gender differences in caregiver stressors,
social resources, and health: an updated meta-analysis. J Gerontol B Psychol Sci Soc Sci. 2006;61:33-45.
35 Ju¨tting JP, Morrisson C, Dayton-Johnson J, Drechsler D. OECD Development Centre [Internet]. Measuring gender (in)equality: introducing the gender, institutions and development data base (GID). 2006 Mar [cited 2013 May 21]. http://www.oecd.org/dataoecd/ 17/49/36228820.pdf
36 World Bank. [Internet]. Data: gender equality data and statistics. [cited 2011 Nov 9]. http://datatopics.worldbank.org/gender/ 37 Hastrup LH, Van Den Berg B, Gyrd-Hansen D. Do informal caregivers
in mental illness feel more burdened? A comparative study of mental versus somatic illnesses. Scand J Public Health. 2011;39:598-607. 38 Pinquart M, Sorensen S. Spouses, adult children, and children-in-law
as caregivers of older adults: a meta-analytic comparison. Psychol Aging. 2011;26:1-14.
39 Chumbler NR, Grimm JW, Cody M, Beck C. Gender, kinship and caregiver burden: the case of community-dwelling memory impaired seniors. Int J Geriatr Psychiatry. 2003;18:722-32.
40 Knight BG, Sayegh P. Cultural values and caregiving: the updated sociocultural stress and coping model. J Gerontol B Psychol Sci Soc Sci. 2010;65B:5-13.