Growth curves and dietary profile of preterm newborns with
appropriate weight for gestational age during hospital stay
Curvas de crescimento e perfil dietético de recém-nascidos pré-termo com peso adequado para a idade gestacional durante a hospitalização
Curvas de crecimiento y perfil dietético de recién nacidos pretérmino con peso adecuado para la edad gestacional durante hospitalización
Mayla Paula T. Simplício1, Andréia Queiroz Ribeiro2, Luciana Ferreira R. Sant’Ana3, Juliana Farias de Novaes4, Silvia Eloiza Priore5,
Sylvia do Carmo C. Franceschini5
Instituição: Departamento de Nutrição e Saúde da Universidade Federal de Viçosa (UFV), Viçosa, MG, Brasil
1Mestre em Ciência da Nutrição pela UFV; Bolsista de Apoio Técnico à Pesquisa Nível I da Fundação de Amparo à Pesquisa do Estado de Minas Gerais (FAPEMIG) vinculada ao Departamento de Nutrição e Saúde da UFV, Viçosa, MG, Brasil
2Doutora em Ciências Farmacêuticas pela Universidade Federal de Minas Gerais (UFMG); Professora Adjunta do Departamento de Nutrição e Saúde da UFV, Viçosa, MG, Brasil
3Doutora em Ciência e Tecnologia de Alimentos pela UFV; Professora Adjunta do Departamento de Nutrição e Saúde pela UFV, Viçosa, MG, Brasil 4Doutora em Ciências da Saúde pela UFMG; Professora Adjunta do Departamento de Nutrição e Saúde pela UFV, Viçosa, MG, Brasil 5Doutora em Nutrição pela Universidade Federal de São Paulo (Unifesp); Professora-Associada do Departamento de Nutrição e Saúde da UFV, Viçosa, MG, Brasil
ABSTRACT
Objective:To develop growth curves and to establish the dietary profile of preterm newborn infants with appropriate wei-ght for gestational age (AGA) during hospital stay after birth. Methods: This retrospective and descriptive study en-rolled AGA preterm newborn infants born from January 2006 to December 2007, admitted to one NICU in Southeast Brazil. The following data were collected: anthropometric measures at birth (daily weight and length, weakly measures of head and chest circumference); as well as information on daily diet. Based on the collected anthropometric data, growth curves were built according to gestational age and they were compared to the main international and national intrauterine growth references. Third-degree polynomial functions were used for modeling growth curves.
Results: The study included 68 AGA preterm newborn infants, with a mean gestational age of 33.2±2.6 weeks. The median of the four anthropometric variables measured at birth were similar to the 50th percentile of the same
meas-ures in the intra-uterine growth reference curves. However,
the 50th percentile of postnatal growth curves for the same
variables were similar to the 10th percentile or -2 standard
deviations of the intra-uterine reference growth curves. During hospital stay, 84.6% of the infants received breast milk; however, the median percentage of days of breast milk use in relation to the length of hospital stay was only 50% (variation: 2-100%).
Conclusions: The anthropometric gains during hospital stay do not reproduce intrauterine growth. There is a need to increase breast milk offer during the entire period of hospitalization.
Key-words:infant, premature; growth; child nutrition; anthropometry; milk, human; child health.
RESUMO
Objetivo: Elaborar curvas de crescimento e estabelecer o perfil dietético de recém-nascidos pré-termo com peso ade-quado para a idade gestacional (AIG) durante a internação após o nascimento.
Endereço para correspondência: Mayla Paula T. Simplício
Avenida Peter Henry Rolfs, s/n – Campus Universitário CEP 36570-000 – Viçosa/MG
E-mail: [email protected]
Fontes financiadoras: Conselho Nacional de Desenvolvimento Científico e Tecnológico (CNPq), pela concessão de bolsas, e Fundação de Amparo à Pesquisa do Estado de Minas Gerais (FAPEMIG/ Processo nº CDS--APQ-01630-10)
Conflito de interesse: nada a declarar
Métodos: Estudo coorte retrospectivo e descriti-vo de recém-nascidos pré-termo AIG, nascidos entre janeiro de 2006 e dezembro de 2007, internados em um hospital de Viçosa, Minas Gerais, Brasil. Foram coletadas informações sobre as medidas antropométricas ao nascer e sua evolução (peso diário e comprimento, perímetro cefálico e torácico semanal) e sobre a evolução diária da dieta. A partir dos dados coletados foram construídas curvas de crescimento referentes às medidas ao nascer e àquelas no pós-natal, em função da idade gestacional, as quais foram comparadas às referências nacionais e internacionais. Além da análise descritiva, foram feitos ajustes por funções polinomiais de terceiro grau para modelação das curvas de crescimento.
Resultados: Foram incluídos no estudo 68 recém--nascidos pré-termo AIG, com idade gestacional média de 33,2±2,6 semanas. Observou-se uma grande concor-dância entre as curvas do percentil 50 das quatro medi-das antropométricas ao nascer em estudo e as curvas do percentil 50 de crescimento intrauterino. Entretanto, as curvas do percentil 50 das medidas antropométricas no período pós-natal foram similares às curvas do percentil 10 ou -2 desvios-padrão de crescimento intrauterino. Durante a internação, 84,6% das crianças receberam leite materno; entretanto, a mediana encontrada do percentual dos dias de uso do leite materno em função do tempo de internação foi de somente 50% (2 a 100%).
Conclusões:Os ganhos antropométricos durante o pe-ríodo de internação não reproduzem o ganho intrauterino. Observou-se a necessidade de maior oferta do leite materno durante o período de internação.
Palavras-chave: recém-nascido prematuro; crescimento; nutrição da criança; antropometria; leite materno; saúde da criança.
RESUMEN
Objetivo: Elaborar curvas de crecimiento y establecer el perfil dietético de recién nacidos pretérmino adecuados para la edad gestacional durante internación después del nacimiento.
Métodos: Estudio de cohorte retrospectivo y descriptivo de recién nacidos pretérmino adecuados para la edad gesta-cional, nacidos entre enero de 2006 y diciembre de 2007, internados en un hospital de Viçosa, Minas Gerais, Brasil. Fueron recogidas informaciones sobre las medidas antropo-métricas al nacer a lo largo del periodo de internación (peso
diario, longitud, perímetro cefálico y torácico semanal) y sobre la evolución diaria de la dieta. A partir de los datos re-cogidos, fueron construidas curvas de crecimiento referentes a las medidas al nacer y a aquellas post-natales, en función de la edad gestacional, las que fueron comparadas a las refe-rencias nacionales e internacionales. Además de los análisis descriptivos, se hicieron ajustes por funciones polinominales de tercer grado para modelación de las curvas de crecimiento. Resultados: Fueron incluidos en el estudio a 68 recién nacidos pretérmino adecuados para la edad gestacional con edad gestacional mediana de 33,2±2,6 semanas. Se observó una gran concordancia entre las curvas del percentil 50 de las cuatro medidas antropométricas al nacer en estudio y las curvas del percentil 50 de crecimiento intrauterino. Sin em-bargo, las curvas del percentil 50 de las medidas antropomé-tricas post-natales fueron similares a las curvas del percentil 10 o -2 de desviación estándar de crecimiento intrauterino. Durante la internación, 84,6% de los niños recibieron la leche materna; sin embargo, la mediana encontrada en el porcentaje de los días de uso de leche materna, en función del tiempo de internación, fue de solamente 50% (2,2 a 100%).
Conclusiones: Las ganancias antropométricas durante el periodo de internación no reproducen las intrauterinas. Se observó la necesidad de mayor oferta de la leche materna durante el periodo de internación.
Palabras clave: recién nacido prematuro; crecimiento; nutrición del niño; antropometría; leche materna; salud del niño.
Introduction
Infant growth is one of the best child health indicators(1).
Children born prematurely, i.e., with gestational age (GA) <37 weeks or 259 days(2), and with low birth weight (LBW), i.e.,
<2500g(3), have a higher risk of growth deicits during
child-hood compared to children born at term(4). It is estimated that
nearly 2/3 of children born with LBW are preterm(5) and have
a 29 times greater chance of presenting a weight-for-age index below the 10th percentile at 12 months of age(6) and a nine
times greater chance of presenting a deicit in their weight-for-age index at the end of the second year of life(7), when
compared to children with normal birth weight. However, despite this evident risk for growth deicit, the outcome of preterm newborns (PTNs), compared to that of full-term new-borns (FTNs), shows conlicting results in the literature(8-10).
According to Rugolo(11), several factors inluence the growth
Although some problems caused by prematurity can be mitigated over time, others, when underdiagnosed at early ages, represent an important concern and may lead to the development of chronic diseases in adulthood(12-14).
Cross-sectional curves of intrauterine growth have become essential instruments in Pediatrics, because they allow, besides the cross-sectional evaluation of anthropometric measures at birth, to estimate whether PTNs grow during hospital stay as if they were still in the uterus(15). The study of growth in
infancy helps to foresee situations that can be preventable. In this context, it is necessary to understand the growth pat-tern of PTNs in hospital units, evaluate their dietary proile in this setting, and infer its possible health consequences.
Therefore, the present study aimed to develop growth curves for appropriate-for-GA (AGA) PTNs during hospital-ization after birth through the study of the variables weight, length, head circumference, and chest circumference and the comparison of these variables with four cross-sectional curves of intrauterine growth from the international(16-18) and
national(19) literature; and to establish the dietary proile of
AGA-PTNs during hospitalization after birth at Hospital São Sebastião, in Viçosa, state of Minas Gerais, Southern Brazil.
Method
The present work is part of the case-control study Inluence of gestational age on clinical and nutritional conditions in children from the city of Viçosa – MG, which has a home and ambulatory approach. This study was a secondary data analysis based on an overall retrospective and descriptive cohort study design. Between May 2010 and January 2011, retrospective data of AGA-PTNs from the municipality of Viçosa born between January 2006 and December 2007 were collected, referring to the hospitalization after birth at Hospital São Sebastião. Children were born between 26 and 36 weeks of GA.
The study population included infants who met the fol-lowing inclusion criteria: residence in Viçosa; birth between January 2006 and December 2007; admission to Hospital São Sebastião on the irst day of life; GA <37 weeks; and AGA birth weight, according to the curves proposed by Williams et al(18).
Research exclusion criteria were death during hospital-ization after birth and having information on GA that does not meet the following criteria: 1) GA reported by at least two techniques, conirming prematurity (last menstrual period – LMP,, ultrasound – US, or clinical evaluation – CE by the technique of Capurro(20) or New Ballard(21)); 2)
GA <36 weeks, reported by LMP (in an attempt to prevent the inclusion of false-positives in the study); or 3) GA <36 weeks, reported by US.
When GA was determined by more than one technique, the following priority criteria were established: 1st, LMP; 2nd,
US; and 3rd, CE. The degrees of prematurity were subdivided
into moderate preterm, for children born between 32 and 36 weeks’ gestation; very preterm, for those born between 28 and 31 weeks’ gestation; and extreme preterm, for those born at less than 28 weeks’ gestation(22).
Information for the present work (dependent and indepen-dent variables) was obtained using a semi-structured question-naire, which was completed based on information provided by the medical records of the mother and the baby (if the latter existed). In cases where children were hospitalized and had speciic records, the admission diagnoses were identiied. According to the report of professionals, anthropometric measures (weight, length, head circumference, and chest cir-cumference) were taken by qualiied nurses and doctors and followed the standardized protocol adopted by the hospital sector(23). Weight was measured daily, whereas length and
head and chest circumferences were measured weekly. Curves for the measures obtained at birth (cross-sectional curves) and postnatally (longitudinal curves, referring to the hospi-talization after birth) were built, based on the data of weekly anthropometric development. Birth weight was classiied as recommended by the World Health Organization (WHO)(3).
To evaluate diet, the number of days during which each infant stayed on a given feeding modality (type of diet, food/ formula, route of administration, and breast milk [BM] offer), was obtained; in addition, the permanence percent-age for each feeding modality was calculated, based on the number of hospitalized days. To do so, we divided the number of days during which each modality was offered by the total number of days the infant was hospitalized. The milk-based formulas were named A, B and C, emphasizing that A represents a semi-elemental and hypoallergenic diet; B, a diet for PTNs; and C, a diet for FTNs.
The study was approved by the Human Research Ethics Committee of Universidade Federal de Viçosa (UFV).
Results
A total of 141 AGA-PTNs were identiied, coming from the municipality of Viçosa, born in 2006 or 2007, and that were hospitalized in the hospital. Among those, 68 were considered eligible to participate in the study, after the exclusion of 67 infants who did not have GA compatible with the established criteria and of six children who died.
It was observed that the majority of the 68 AGA-PTNs was female (52%); was Caucasian (60%); had married moth-ers (48%); went to at least four prenatal visits (70%); had weight below 2500g (74%); was admitted to the Neonatal Intensive Care Unit (NICU) (71.6%); was treated by the Brazilian Uniied Health System (SUS, Sistema Único de Saúde) (72%); was born by cesarean delivery (57%); and was a moderate preterm infant (78%). Additionally, 18% were twins, 10% lived in the rural area, and 4% were extreme preterm infants. None of the children had a congenital mal-formation and/or chromosomal anomaly detected.
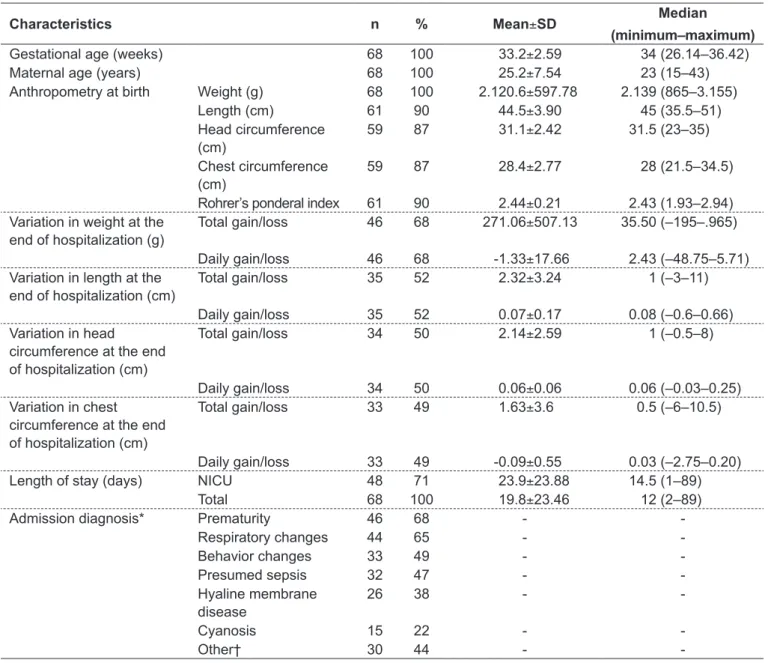
Table 1 - Characteristics of the study population: Hospital São Sebastião, Viçosa, state of Minas Gerais, Brazil, 2006–2007
Characteristics n % Mean±SD Median
(minimum–maximum)
Gestational age (weeks) 68 100 33.2±2.59 34 (26.14–36.42)
Maternal age (years) 68 100 25.2±7.54 23 (15–43)
Anthropometry at birth Weight (g) 68 100 2.120.6±597.78 2.139 (865–3.155)
Length (cm) 61 90 44.5±3.90 45 (35.5–51)
Head circumference (cm)
59 87 31.1±2.42 31.5 (23–35)
Chest circumference (cm)
59 87 28.4±2.77 28 (21.5–34.5)
Rohrer’s ponderal index 61 90 2.44±0.21 2.43 (1.93–2.94) Variation in weight at the
end of hospitalization (g)
Total gain/loss 46 68 271.06±507.13 35.50 (–195–.965)
Daily gain/loss 46 68 -1.33±17.66 2.43 (–48.75–5.71) Variation in length at the
end of hospitalization (cm)
Total gain/loss 35 52 2.32±3.24 1 (–3–11)
Daily gain/loss 35 52 0.07±0.17 0.08 (–0.6–0.66) Variation in head
circumference at the end of hospitalization (cm)
Total gain/loss 34 50 2.14±2.59 1 (–0.5–8)
Daily gain/loss 34 50 0.06±0.06 0.06 (–0.03–0.25) Variation in chest
circumference at the end of hospitalization (cm)
Total gain/loss 33 49 1.63±3.6 0.5 (–6–10.5)
Daily gain/loss 33 49 -0.09±0.55 0.03 (–2.75–0.20)
Length of stay (days) NICU 48 71 23.9±23.88 14.5 (1–89)
Total 68 100 19.8±23.46 12 (2–89)
Admission diagnosis* Prematurity 46 68 -
-Respiratory changes 44 65 -
-Behavior changes 33 49 -
-Presumed sepsis 32 47 -
-Hyaline membrane disease
26 38 -
-Cyanosis 15 22 -
-Other† 30 44 -
-*% ∑ different from 100%, because a child could have more than one diagnosis for admission; % values calculated based on the 68 AGA-PTNs,
According to the information obtained regarding GA, 60% (n=41) conirmed prematurity by at least two techniques (LMP, US, and/or CE – criterion 1), 17% (n=12) had GA <36 weeks according to LMP (criterion 2) and 22% (n=15) had GA <36 weeks according to US (criterion 3). GA could not be determined by LMP in 27% (n=18) of the cases; in such instances, US was considered. Other information on GA, maternal age, length of stay, admission diagnosis, anthro-pometry at birth, as well as total and daily gains and losses in anthropometric measures during hospitalization, are shown in Table 1. Adolescent mothers (10 to <20 years) corresponded to 29% of the population. From the total of AGA-PTNs, it was observed that 29% (n=20) did not require hospitaliza-tion together with their mothers, and the main admission diagnoses were prematurity and respiratory changes.
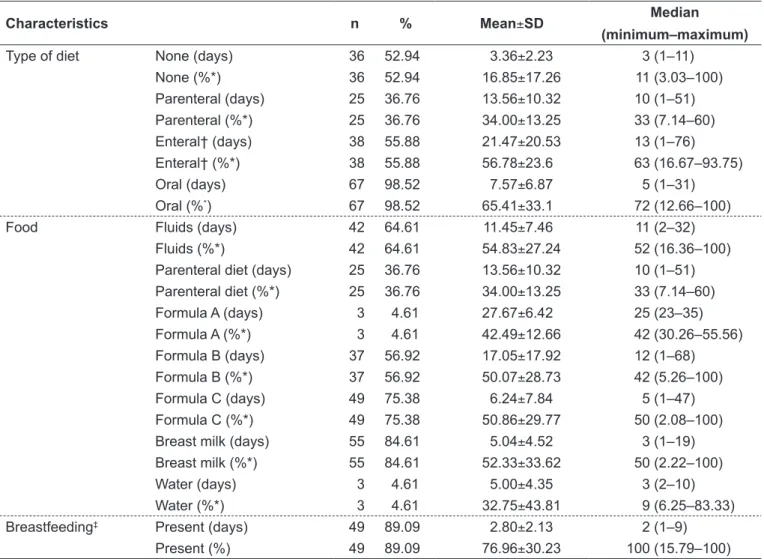
Enteral and parenteral nutrition were identiied as the main feeding modalities among these infants. BM was part of the diet, although in a limited way, but it was usually of-fered by suckling of maternal breast, which can be considered a positive factor (Table 2).
Comparisons between intrauterine growth curves and those observed at birth and postnatally are shown in Graphs 1 and 2. Table 3 exhibits the number of children/measures used for building the curves, stratiied by GA. In Graph 1 it can be observed that the medians of the four anthropometric variables measured at birth were similar to the 50th percentile
of the same measures in the reference intrauterine growth curves. The growth channel presented by the children from this study was above that of Lubchenco et al(16) and Usher
and McLean(17) but below that of Margotto(19) at almost all
Table 2 - Dietary proile of the study population during postnatal hospitalization: Hospital São Sebastião, Viçosa, state of Minas Gerais, Brazil, 2006–2007
Characteristics n % Mean±SD Median
(minimum–maximum)
Type of diet None (days) 36 52.94 3.36±2.23 3 (1–11)
None (%*) 36 52.94 16.85±17.26 11 (3.03–100)
Parenteral (days) 25 36.76 13.56±10.32 10 (1–51) Parenteral (%*) 25 36.76 34.00±13.25 33 (7.14–60) Enteral† (days) 38 55.88 21.47±20.53 13 (1–76) Enteral† (%*) 38 55.88 56.78±23.6 63 (16.67–93.75)
Oral (days) 67 98.52 7.57±6.87 5 (1–31)
Oral (%*) 67 98.52 65.41±33.1 72 (12.66–100)
Food Fluids (days) 42 64.61 11.45±7.46 11 (2–32)
Fluids (%*) 42 64.61 54.83±27.24 52 (16.36–100)
Parenteral diet (days) 25 36.76 13.56±10.32 10 (1–51) Parenteral diet (%*) 25 36.76 34.00±13.25 33 (7.14–60)
Formula A (days) 3 4.61 27.67±6.42 25 (23–35)
Formula A (%*) 3 4.61 42.49±12.66 42 (30.26–55.56) Formula B (days) 37 56.92 17.05±17.92 12 (1–68) Formula B (%*) 37 56.92 50.07±28.73 42 (5.26–100)
Formula C (days) 49 75.38 6.24±7.84 5 (1–47)
Formula C (%*) 49 75.38 50.86±29.77 50 (2.08–100) Breast milk (days) 55 84.61 5.04±4.52 3 (1–19) Breast milk (%*) 55 84.61 52.33±33.62 50 (2.22–100)
Water (days) 3 4.61 5.00±4.35 3 (2–10)
Water (%*) 3 4.61 32.75±43.81 9 (6.25–83.33)
Breastfeeding‡ Present (days) 49 89.09 2.80±2.13 2 (1–9)
Present (%) 49 89.09 76.96±30.23 100 (15.79–100)
moments. However, the 50th percentile of postnatal curves
for the same variables was similar to the 10th percentile or
-2 of standard deviation (SD) of the reference intrauterine growth curves (Graph 2). The lower channel of the weight curve was even more remarkable when considered from 37th
week of GA on.
Discussion
Currently, there is an increasing trend of prematurity both in Brazil(24) and in other countries(25). In the last
de-cades, studies on postnatal growth of PTNs were hampered mainly by the barriers of inadequate enteral and parenteral feeding and inadequate perinatal care(9). With the current
development, PTNs are expected to grow in the extrauterine environment with similar gains to those observed in the intrauterine environment.
Cross-sectional curves of intrauterine growth have become an essential instrument in the NICU and are presented by several authors, who used representative
sample sizes for their respective populations. The intra-uterine growth curve of Lubchenco et al(16) was produced in
Denver (Colorado, USA), far from sea level, and included the weight of 5,635 Caucasian children between 24 and 42 weeks of GA, not excluding those with diseases that affect intrauterine growth. Usher and McLean(17) assessed
seven anthropometric measures in 300 Caucasian children born with 25 to 44 weeks of GA from Montreal (Quebec, Canada), a city situated at sea level. The curve of Williams
et al(18) was built in California (USA), with a population
of 2,288,806 children of different races and ethnic groups between 22 and 44 weeks of GA. Margotto(19), in turn,
included three anthropometric measures (weight, length, and head circumference at birth) of 4,413 children from Brasília (Distrito Federal, Brazil) with GA between 29 and 44 weeks, considering the exclusion of interfering factors of fetal growth. Additionally, although it was not included in this study, the curve of Alexander et al(26) stands out for
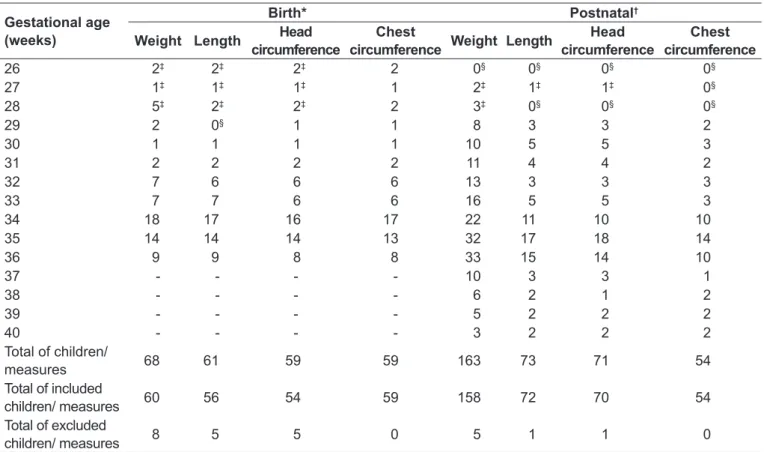
being broadly adopted in the United States and includes the weight of singe live births in 1991 (n=3,134,879) Table 3 - Sample number for the development of birth and postnatal curves for weight, length, head circumference, and chest circumference, from both genders, stratiied by gestational age of the study population
Gestational age (weeks)
Birth* Postnatal†
Weight Length Head
circumference
Chest
circumference Weight Length
Head circumference
Chest circumference
26 2‡ 2‡ 2‡ 2 0§ 0§ 0§ 0§
27 1‡ 1‡ 1‡ 1 2‡ 1‡ 1‡ 0§
28 5‡ 2‡ 2‡ 2 3‡ 0§ 0§ 0§
29 2 0§ 1 1 8 3 3 2
30 1 1 1 1 10 5 5 3
31 2 2 2 2 11 4 4 2
32 7 6 6 6 13 3 3 3
33 7 7 6 6 16 5 5 3
34 18 17 16 17 22 11 10 10
35 14 14 14 13 32 17 18 14
36 9 9 8 8 33 15 14 10
37 - - - - 10 3 3 1
38 - - - - 6 2 1 2
39 - - - - 5 2 2 2
40 - - - - 3 2 2 2
Total of children/
measures 68 61 59 59 163 73 71 54
Total of included
children/ measures 60 56 54 59 158 72 70 54
Total of excluded
children/ measures 8 5 5 0 5 1 1 0
*Number of children included for each gestational age; †number of measures included for each gestational age; ‡data excluded due to the lack of
Graph 1 - Comparison between intrauterine growth curves and weight, length, head circumference, and chest circumference measured at birth, for both genders, stratiied by gestational age of the study population
Polynomial - Present study (Mean) (At birth) Polynomial - Present study (P50) (At birth)
Polynomial - Lubchenco et al (1963) (P50) Polynomial - Margotto (1995) (P50)
Polynomial - Usher e McLean (1969) (Mean)
Gestational age Gestational age
Gestational age Gestational age
3000
2500
1500
500 1000 2000
29 30 31 32 33 34 35 36 30
30 31 32
32 33 34
34 35 36
36 29
28
26
24
22
30 30
31 32 32
33 34 34
35 36 36
25
26 28
23
21
19 27 29 31 33 38
35
32 41 44 47 50
Chest circumference at birth
Weight at birth
Head circumference at birth
Length at birth
A
C D
B
Graph 2 - Comparison between intrauterine growth curves and postnatal weight, length, head circumference, and chest circumference, for both genders, stratiied by gestational age of the study population
3000
2500
1500
500 1000 2000
28
26
24
22 30 32 34 36
Weight
Head circumference
A
C
25
23
21
19 27 29 31 33 38
35
32 41 44 47 50
Chest circumference
Length
D B
Gestational age Gestational age
29 30 31 32 33 34 35 36 37 38 39 40
Gestational age Gestational age
33 35 37 39
29 31 33 35 37 39 29 31
33 35 37 39
29 31
with GA between 20 and 44 weeks, children of mothers living in the country.
PTNs are expected to present maximal growth rate between 36 and 40 weeks of post-conceptional age, as well as catch-upgrowth by the age of two or three years, more speciically in the irst six months, reaching the normal percentiles for full-term infants(10). However, Graph 2
does not show a growth recovery dynamic similar to that described in catch-up growth, with regard to reference intrauterine growth curves, which suggests that this event tends to occur after the period covered in our study. Children’s clinical conditions are inferred as a possible factor associated with the non-occurrence of catch-up in the present study: PTNs in better health conditions were possibly discharged and did not contribute to the data of this survey as much as children who required a longer hospital stay did. Therefore, these results should be interpreted with caution, bearing in mind that this is the discharge proile of PTNs and not their growth pro-ile. In addition, it bears emphasizing that the adopted gold-standard (intrauterine growth curves) uses measures obtained at birth as a reference instead of postnatal mea-sures referring to the development of preterm children.
Xavier et al(9) followed 141 AGA-PTNs with GA at
birth between 26 and 36 weeks from birth until the postmenstrual age of 42 weeks. The average postnatal growth curves (weight, length, and head circumference) obtained in this study, when compared with intrauterine growth curves, showed to be similar to the 10th percentile
of Lubchenco et al(16) for the 29th to 37th week, reaching
average/median values between 40th and 42th
postmen-strual weeks, which indicates a dynamic that characterizes growth recovery.
According to Rugolo(10), postnatal growth is
charac-terized by an initial weight loss, followed by a recovery, whose intensity and duration are inversely related to GA, birth weight, and severity of newborn’s clinical condition. Moreover, it is stated that extreme preterm infants admit-ted to the NICU present cumulative protein and energy deiciency in the irst weeks of life and that in general, at the moment of hospital discharge, the anthropometric pa-rameters of PTNs are below the lower normal percentile of the intrauterine growth curves, corroborating the indings of the present study(11,27).
An adequate environment is essential for a good prog-nosis for PTNs, allowing them to reach growth conditions similar to those of FTNs in the short term(9). Unavoidably,
nutrition and the identiied pattern of growth become related. Besides the physiological and metabolic stress that directly affects nutritional needs, PTNs have a lower nutrient reserve at birth compared to FTNs. There is still controversy regarding the most appropriate diet for PTNs, with different information on their nutritional needs. However, such needs are not usually met, resulting in important nutritional deicits(27).
In general, healthy PTNs with GA >34 weeks are able to coordinate suckling, swallowing, and breathing, which allows the effective establishment of breastfeeding. This practice is not considered safe before that age because of neurological immaturity and respiratory compromise(27).
Bicalho-Mancini and Velásquez-Meléndez(28) found that,
during hospital stay at a NICU, 77% of children were fed enterally and 20% parenterally. On the other hand, a lower use of enteral feeding (56%; n=38) and a higher use of parenteral feeding (37%; n=25) were observed in our study population compared with that of the above mentioned investigation.
In the present study, 85% of children received BM at some point during hospital stay, a similar value to that found at discharge from a NICU in Belo Horizonte, state of Minas Gerais, Brazil, before the implementation of the Baby Friendly Hospital Initiative policies (83%), and a lower value to that observed after their implementation (92%)(28). Mean length of stay of the children analyzed
in Belo Horizonte (before and after implementation) was 23.4±19.5 days, against a mean of 19.8±23.5 days in the present study. It bears stressing that the present study also included children who did not require hospitaliza-tion separated from their mothers. However, the pre-sented data indicate that the median percentage of days of BM use calculated as a function of the length of stay was only 50% (2.2 to 100%), considering the children who received it at some point during hospitalization. PTNs admitted to the NICU and deprived of BM can therefore have intestinal colonization with an unbalanced microbiota, made up with resistant bacteria from that unit(29). The WHO and the United Nations Children’s
Fund (Unicef) state that there is a duty to teach moth-ers how to begin or maintain lactation if separated from their children(28).
or from a donor from the Human Milk Bank (HMB)(27).
PTNs may not receive protective levels of antibodies, which are transferred mostly after 34 weeks’ gestation. Therefore, preterm infants are highly susceptible to infec-tion, with a risk for sepsis inversely proportional to GA. The possibilities of intervention in this system are still very limited, but BM is composed of immunoglobulins, which are passively transferred from mothers to children and protects the latter while the maturation of their im-mune system is underway(29). Hospital São Sebastião, in
a partnership with UFV, has been developing, through the Breastfeeding Support Program (Programa de Apoio à Lactação, PROLAC), intervention protocols aiming at advising mothers and promoting breastfeeding by means of a maternity and outpatient approach. The building of the hospital’s HMB began in December 2004; however, the effective beginning of its activities occurred only in July 2008, meaning that it was not fully working during the period of the present study.
The need of adopting a more critical and scientiic approach to growth patterns and nutrition of preterm children should be reinforced, recognizing the importance and need of short-term and long-term follow-up of the growth of PTNs and allowing the implementation of follow-up care at the public health level(9).
The extrapolation of the present results and discussions warrants caution, because both are related to a study with a limited sample number that refers to characteristics of preterm infants treated at Hospital São Sebastião, in the city of Viçosa, selected by non-probabilistic sampling, and describes the proile of these children during postnatal hospitalization. However, we emphasize the importance of conducting studies in municipalities characterized as “small”, considering that almost 90% of Brazilian munici-palities have less than 50,000 inhabitants, according to the Brazilian Geography and Statistics Institute (Instituto Brasileiro de Geograia e Estatística, IBGE)(30).
Moreover, it bear emphasizing that 71% of the chil-dren from the present study required hospitalization at the NICU, and 72% were treated by the SUS, a fact that represents an important cost for the public health system, taking into account that great part of these expenses could be possibly avoidable with the reduction in preterm births. By means of the evaluation of a small sample of medical records of AGA-PTNs (n=7) and AGA-FTNs (n=5) born in the study period, the mean daily expenses
from the moment of maternal admission until child’s discharge are estimated to be R$ 323.47 for full-term infants and R$ 1,159.09 for preterm infants who needed NICU care. Therefore, the mean expenses are 3.58 times higher with the birth of a preterm child, who requires NICU admission, compared to those of full-term chil-dren. This analysis considered only the period before the children were discharged after birth, not considering thus essential expenses after this point.
Morley and Lucas(4), in an epidemiologic study, provided
evidence that low weight until one year of age is associ-ated with an increased risk for cardiovascular disease in adulthood, which suggests that growth in infancy may have a long-term inluence. Moreover, other authors(12-14)
demonstrated that prematurity is associated with the most prevalent chronic diseases of today. Therefore, besides the evident concern with the quality of life of these children, it is necessary to consider the long-term cost of prematu-rity, questioning: who will pay for this burden? How to pay for it?
In conclusion, the children evaluated in this study were born presenting anthropometric measures as expected by four intrauterine growth curves. However, further gains were insuficient and can affect the health prognosis of these patients. There is a need of greater inclusion of BM during the entire period of hospitalization, and it is nec-essary to evaluate the associations of dietary, medication and clinical proiles with the identiied pattern of growth. In addition, the inluence of these indings on the main health indicators of these children should be evaluated in the long-term. We emphasize the need of follow-up and care for preterm infants after discharge by basic care units, which are responsible for their place of living. The community health agents could act as an important bridge between prematurity and health.
Acknowledgements
1. Romani SA, Lira PI. Determinant factors of infant growth. Rev Bras Saude Mater Infant 2004;4:15-23.
2. World Health Organization. Public health aspects of low birth weight. Technical Report Series, n. 217. Geneva: WHO; 1961.
3. World Health Organization. An evaluation of infant growth: the use and interpretation of anthropometry in infants. WHO Working Group on Infant Growth. Bull World Health Organ 1995;73:165-74.
4. Morley R, Lucas A. Randomized diet in the neonatal period and growth performance until 7.5-8 y of age in preterm children. Am J Clin Nutr 2000;71:822-8.
5. Tucker J, McGuire W. ABC of preterm birth: Epidemiology of preterm birth. BMJ 2004;329:675-8.
6. Motta ME, Silva GA, Araújo OC, Lira PI, Lima MC. Does birth weight affect nutritional status at the end of irst year of life? J Pediatr (Rio J) 2005;81:377-82.
7. Olinto MT, Victora CG, Barros FC, Tomasi E. Determinants of malnutrition in a low-income population: hierarchical analytical model. Cad Saude Publica 1993;9 (Suppl 1):S14-27.
8. Casey PH, Kraemer HC, Bernbaum J, Yogman MW, Sells JC. Growth status and growth rates of a varied sample of low birth weight, preterm infants: a longitudinal cohort from birth to three years of age. J Pediatr 1991;119:599-605.
9. Xavier CC, Abdallah VO, Silva BR, Mucillo G, Jorge SM, Barbieri MA. Growth of preterm infants. J Pediatr (Rio J) 1995;71:22-7.
10. Robertson C. Catch-up growth among very-low-birth-weight preterm infants: a historical perspective. J Pediatr 2003;143:145-6.
11. Rugolo LM. Growth and developmental outcomes of the extremely preterm infant. J Pediatr (Rio J) 2005;81 (Suppl 1):S101-10.
12. Barker DJ, Winter PD, Osmond C, Margetts B, Simmonds SJ. Weight in infancy and death from ischaemic heart disease. Lancet 1989;2:577-80.
13. Silveira PP, Portella AK, Goldani MZ, Barbieri MA. Developmental origins of health and disease (DOHaD). J Pediatr (Rio J) 2007;83:494-504.
14. Simmons RA. Developmental origins of adult disease. Pediatr Clin North Am 2009;56:449-66.
15. Lopes JM. Crescimento fetal e neonatal. Por que não utilizar curvas nacionais? J Pediatr (Rio J) 1995;72:3-4.
16. Lubchenco LO, Hansman C, Dressler M, Boyd E. Intrauterine growth as
estimated from liveborn birthweight data at 24 to 42 weeks of gestation. Pediatrics 1963;32:793-800.
17. Usher R, McLean F. Intrauterine growth of live-born Caucasian infants at sea level: standards obtained from measurements in 7 dimensions of infants born between 25 and 44 weeks of gestation. J Pediatr 1969;74:901-10. 18. Williams RL, Creasy RK, Cunningham GC, Hawes WE, Norris FD, Tashiro M.
Fetal growth and perinatal viability in California. Obstet Gynecol 1982;59:624-32. 19. Margotto PR. Intrauterine growth curves: study of 4413 single live births of
normal pregnancies. J Pediatr (Rio J) 1995;71:11-21.
20. Capurro H, Konichezky S, Fonseca D, Caldeyro-Barcia R. A simpliied method for diagnosis of gestational age in the newborn infant. J Pediatr 1978;93:120-2. 21. Ballard JL, Khoury JC, Wedig K, Wang L, Eilers-Walsman BL, Lipp R. New
Ballard score, expanded to include extremely premature infants. J Pediatr 1991;119:417-23.
22. Moutquin JM. Classiication and heterogeneity of preterm birth. BJOG 2003;110 (Suppl 20):30-3.
23. Euclydes MP. Nutrição do lactente: base cientíica para uma alimentação saudável. 3rd ed. Viçosa: UFV; 2005.
24. Silveira MF, Santos IS, Barros AJ, Matijasevich A, Barros FC, Victora CG. Increase in preterm births in Brazil: review of population-based studies. Rev Saude Publica 2008;42:957-64.
25. Tucker J, McGuire W. ABC of preterm birth: epidemiology of preterm birth. BMJ 2004;329:675-8.
26. Alexander GR, Himes JH, Kaufman RB, Mor J, Kogan M. A United States national reference for fetal growth. Obst Gynecol 1996;87:163-8.
27. McGuire W, Henderson G, Fowlie PW. ABC of preterm birth: feeding the preterm infant. BMJ 2004;329:1227-30.
28. Bicalho-Mancini PG, Velásquez-Meléndez G. Exclusive breastfeeding at the point of discharge of high-risk newborns at a neonatal intensive care unit and the factors associated with this practice. J Pediatr (Rio J) 2004;80: 241-8.
29. Mussi-Pinhata MM, Rego MA. Immunological peculiarities of extremely preterm infants: a challenge for the prevention of nosocomial sepsis. J Pediatr (Rio J) 2005;81 (Suppl 1):S59-68.
30. Brasil. Ministério do Planejamento, Orçamento e Gestão. Instituto Brasileiro de Geograia e Estatística. Pesquisa de informações básicas municipais: peril dos municípios brasileiros. Rio de Janeiro: IBGE; 2009.