Relationship between anthropometric and biochemical proiles in
children and adolescents with type 1 diabetes
Relação entre o peril antropométrico e bioquímico em crianças e adolescentes com diabetes melito tipo 1 Relación entre periles antropométrico y bioquímico en niños y adolescentes con diabetes mellitus tipo 1
Sheylle Almeida S. Teles1, Nélida Schmid Fornés2
Instituição: Ambulatório de Endocrinologia do Hospital das Clínicas da Universidade Federal de Goiás (UFG), Goiânia, GO, Brasil
1Mestre em Ciências da Saúde pela Faculdade de Medicina da UFG, Goiânia, GO, Brasil
2Pós-doutora em Medicina Preventiva e Saúde Pública pela Universidad Autónoma de Madri, Espanha; Professora da Faculdade de Nutrição da UFG, Goiânia, GO, Brasil
ABSTRACT
Objective: To evaluate the relationship between anthro-pometric and biochemical variables in children and adoles-cents with type 1 diabetes mellitus (DM1).
Methods: This was a cross-sectional study of 11 children and 43 adolescents with DM1. The following data were collected: socioeconomic and demographic (age, sex, edu-cation, income), clinical (insulin therapy), anthropometric (weight, height, skinfolds, waist circumference – WC) and biochemical variables (glycated hemoglobin – HbA, casual blood glucose – CBG, post-prandial blood glucose – PPBG, and lipid proile). Statistical analysis included Student’s t test (p<0.05) and Pearson’s correlation (p<0.05).
Results: The average income per capita was 0.58±0.39 times the monthly minimum wage and 72.2% of the sample were on insulin therapy consisting of three doses per day. Most individuals had adequate height (92.6%) and BMI (87.0%) for their ages. Subjects with an adequate HbA index (inHbA) had lower CBG (p=0.002) and PPBG (p<0.001). There were positive correlations between inHbA and WC (p=0.013), CBG (p=0.014), PPBG (p<0.001), triglycerides and VLDL-cholesterol (p<0.001).
Conclusions: Poorer glycemic control is related to higher serum lipids levels and larger WC.
Key-words: adolescent; anthropometry; waist circumfer-ence; child; diabetes mellitus, type 1; blood glucose.
RESUMO
Objetivo: Avaliar a relação entre o peril antropométrico e bioquímico de crianças e adolescentes com diabetes melito tipo 1 (DM1).
Métodos: Estudo transversal com 11 crianças e 43 adolescentes com DM1. Coletaram-se dados socioeconô-micos e demográficos (idade, sexo, escolaridade, renda), clínicos (insulinoterapia), antropométricos (peso, esta-tura, dobras cutâneas, circunferência da cintura – CC) e bioquímicos (hemoglobina glicada – HbA, glicemias casual – GLC, pós-prandial – GLPP, e perfil lipídico). Foram utilizados o teste t de Student (p<0,05) e a cor-relação de Pearson (p<0,05).
Resultados: A renda média per capita foi de 0,58±0,39 salário-mínimo e predominou o esquema de três apli-cações de insulina/dia em 72,2% da amostra. A maioria apresentou estatura (92,6%) e IMC (87%) adequados para a idade. Aqueles com índice da HbA (inHbA) adequado apresentaram menores GLC (p=0,002) e GLPP (p<0,001). O inHbA correlacionou-se positivamente com CC (p=0,013), GLC (p=0,014), GLPP (p<0,001), TG e VLDL (p<0,001).
Conclusões: O pior controle glicêmico relaciona-se a maiores níveis de lipídeos séricos e CC mais elevada.
Palavras-chave: adolescente; antropometria; circunferên-cia da cintura; criança; diabetes mellitus tipo 1; glicemia.
Endereço para correspondência: Sheylle Almeida S. Teles
Rua I 3, quadra 05, lote 02 – Bairro Itamaraty, IV Etapa CEP 75050-015 – Anápolis/GO
E-mail: [email protected]
Fonte financiadora: Conselho Nacional de Desenvolvimento Científico e Tecnológico (CNPq) – bolsa de mestrado, processo nº579392/2008-2 Conflito de interesse: nada a declarar
RESUMEN
Objetivo: Evaluar la relación entre peril antropométrico y bioquímico de niños y adolescentes con diabetes mellitus tipo 1 (DM1).
Métodos: Estudio transversal con 11 niños y 43 ado-lescentes con DM1. Se recogieron datos socioeconómicos y demográicos (edad, sexo, escolaridad, ingresos), clínicos (insulinoterapia), antropométricos (peso, estatura, pliegues cutáneos, circunferencia de la cintura-CC) y bioquímicos (hemoglobina glicada – HbA, glucemias casual – GLC, pos-tprandial – GLPP y peril lipídico). Se utilizaron la prueba t de Student y la correlación de Pearson (p<0,05).
Resultados: El ingreso mediano per capita fue de 0,58±0,39 salario mínimo y predominó el esquema de tres aplicaciones de insulina/día en el 72,2% de la mues-tra. La mayoría presentó estatura (92,6%) e IMC (87%) adecuados a la edad. Aquellos con índice de HbA (inHbA) adecuado presentaron menores GLC (p=0,002) y GLPP (p<0,001). El inHbA se correlacionó positivamente con CC (p=0,013), GLC (p=0,014), GLPP (p<0,001), TG y VLDL (p<0,001).
Conclusiones: El peor control glucémico se relaciona a mayores niveles de lípidos séricos y CC más elevada.
Palabras clave: adolescente; antropometría; circunferen-cia de la cintura; niño; diabetes mellitus tipo 1; glucemia.
Introduction
Diabetes mellitus type 1 (DM1) is the most common childhood endocrine disease and is associated with increased cardiovascular risk(1). Hyperglycemia, hypertension and
dyslipidemia are all involved in the development of the complications of DM1(1), accelerating different phases of
atherogenesis(2). The early manifestations of vascular
dysfunc-tion in people with DM1 are hardening and thickening of the artery walls(3,4).
Brazil is one of the ten countries with the greatest num-bers of DM cases worldwide(5). No population based studies
have been conducted in Brazil that have speciically identiied DM1 cases. It is estimated that the prevalence and incidence of the disease in the under-14s are 4/10,000 and 8/100,000 inhabitants respectively(6).
Intensive glycemic control helps prevent complications because it acts directly on serum concentrations of total cholesterol (TC), low density lipoproteins (LDL) and
triglycerides (TG)(7). However, it also tends to lead to
greater weight gain and increases in percentage body fat (BF) than conventional treatment(8). Ineffective glycemic
control, manifest in elevated glycated hemoglobin (HbA) levels, is associated with an increased tendency towards overweight. Furthermore, number of insulin doses has been identiied as the most important independent pre-dictor of body mass index (BMI) in subjects aged from 12 to 17(9).
On the basis of this evidence of a link between metabolic control and nutritional status in people with diabetes type 1, the objective of this study was to investigate the relation-ship between the anthropometric and biochemical proiles of children and adolescents with DM1.
Method
This was a cross-sectional study of children and ado-lescents with DM1 seen at the endocrinology clinic of the Hospital das Clínicas, Universidade Federal de Goiás (UFG). When the study was conducted the total population with DM1 registered at the clinic comprised 240 people, 31 of whom were children (12.0%), with 79 adolescents (32.2%) and 135 adults (55.8%). The sample of 54 vol-unteers equated to 49% of the children and adolescents registered.
For the purposes of this study, participants aged 4 to 9 years were deined as “children” and those aged 10 to 18 were termed “adolescents”(10). The criteria for inclusion in
the study were as follows: diagnosis of DM1 conirmed at least 5 months previously and insulin treatment. The exclusion criteria were: amputation of limbs, diagnosis of dyslipidemia, celiac disease, nephropathy, thyroid diseases or cardiovascular diseases.
(HDL), very low density lipoprotein (VLDL) and LDL. Anthropometric data were measured cyclically by a single examiner; i.e. each measurement was taken once before replicate measurements were taken in the same order. Weight, height and WC were each measured twice and the skin folds were measured three times and then means were calculated.
Height was measured using a 200cm portable stadiom-eter (Sanny®) with divisions in millimeters. Patients were
weighed using a stand-on balance (Kratos®), with maximum
capacity of 150kg and sensitivity of 50 grams. Waist cir-cumference was measured with an inextensible tape measure. Skin folds were measured with an adipometer (Lange®).
Data for weight and height were analyzed and classiied using the WHO software Antro(11) on the basis of z score
for height/age (Z H/A) and z score for BMI/age (Z BMI/A). After the software had performed the classiication, H/A was deined as low if Z<-2 and appropriate if Z≥-2. For BMI/A, Z<-2 was deined as underweight, -2≥Z<+1 as healthy weight and Z≥+1 as obesity(12).
Cutoff points proposed by McCarthy, Jarrett and Crawley(13) were used to classify WC data. Tricipital skin
folds classiied using percentiles proposed by Frisancho(14)
the Slaughter et al(15) were used to calculate estimated body
composition for participants aged 8 to 18. The equation could not be used for six participants because they were less than 8 years old. The sample was classiied using the body fat percentage adiposity categories proposed by Lohman(16), stratifying by sex and adiposity categories.
For the boys, <10% was deined as low adiposity, from 10 to 20% as good adiposity and >20% was deined as moderately high and high adiposity; for the girls, <15% was deined as low adiposity, from 15 to 25% as good adiposity and >25% was deined as moderately high and high adiposity. In order to make data presentation clearer, the sample was stratiied as “children” or “adolescents” and grouped into the categories “low”, “good” and “ex-cessive” adiposity.
Data on lipid proiles and HbA were obtained from medical records, always taking the most recent results. New tests were requested for participants whose most recent lipid proile was more than 3 months old, as part of routine outpatients follow-up. Patients brought new HbA test results to every new consultation, so these data were less than 2 weeks old. Casual glycemia tests were conducted in the reception area using a blood glucose meter (Accu-chek Advantage).
The lipid proile was assessed on the basis of igures recommended by the American Academy of Pediatrics(17).
Since the HbA tests had been conducted using a variety of methods, a glycated hemoglobin index (inHbA) was used to classify glycemic control (GC) as adequate or inadequate. The inHbA is calculate by dividing the HbA test result by the upper limit of normality for the test method used, as described by Chase et al(18). For the purposes of this study,
inHbA <1.33 was deined as adequate GC and inHbA ≥1.33 as inadequate GC.
This study was approved by the Human and Animal Medical Research Ethics Committee at the UFG Hospital das Clínicas under protocol number 128/08. Free and informed consent forms were signed voluntarily by all participants and their guardians after all procedures involved had been explained in detail.
The database was constructed in a Microsoft Excel spreadsheet (version 2003) and analyzed using the Sta-tistical Package for the Social Sciences (version 17.0). Socioeconomic and demographic data are described in frequencies and percentages for categorical variables and measure of central tendency for numerical variables. The distribution of continuous variables was analyzed using the Kolmogorov-Smirnov test and distribu-tions with results of p≥0.05 were considered normal. Comparisons between groups with adequate GC and inadequate GC were conducted using Student’s t test and the chi-square test. Pearson’s correlation coefficient was used to analyze relationships between biochemical and anthropometric variables.
Results
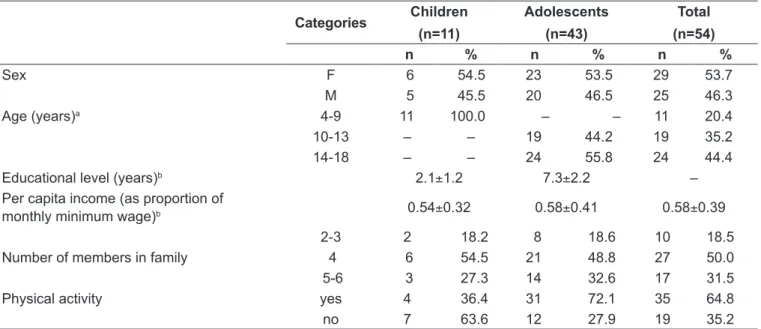
Table 1 lists the socioeconomic, demographic and an-thropometric characteristics of the sample. The sample comprised 11 children and 43 adolescents, totaling 54 patients, 29 (54%) of whom were female and 25 (46%) of whom were male. Note that 83.3% were over 9 years old. Mean per capita income was 0.58±0.39 times the monthly minimum wage, and the majority of families comprised up to four members (68.5%).
Table 2 - Clinical and anthropometric characteristics of children and adolescents with diabetes mellitus type 1
Categories
Children (n=11)
Adolescents (n=43)
Total (n=54)
n % n % n %
Insulin regimea I/R 5 45.5 31 72.1 36 66.7
I/UR 4 36.4 4 9.3 8 14.8
LD/UR 1 9.1 5 11.6 6 11.1
LD or I 1 9.1 3 7.0 4 7.4
Number of times insulin administered per day
1-2 3 27.3 6 14.0 9 16.7
3 8 72.7 31 72.1 39 72.2
4 – – 6 14.0 6 11.1
Z H/A Low – – 4 9.3 4 7.4
Appropriate 11 100 39 90.7 50 92.6
Z BMI/A Underweight 1 9.1 2 4.7 3 5.6
Healthy weight 8 72.7 39 90.7 47 87.0
Obese 2 18.2 2 4.7 4 7.4
WC p10-p90 8 72.7 32 74.4 40 74.1
>p90 3 27.3 11 25.6 14 25.9
TSF <p10 1 9.1 – – 1 1.9
p10-p90 8 72.7 39 90.7 47 87.0
>p90 2 18.2 4 9.3 6 11.1
BF Low 1 9.1 1 2.3 2 3.7
Good 3 27.3 22 51.2 25 46.3
Excessiveb 1 9.1 20 46.5 21 38.9
<8 yearsc 6 54.5 – – 6 11.1
I: intermediate; R: rapid; UR: ultra rapid; LD: long duration.Z H/A: standard deviation score for height for age. Z BMI/A: standard deviation score for
body mass index for age. WC: waist circumference (in percentiles) TSF: triceps skinfold; BF: body fat, classiied as per Lohman(16). amean insulin
dose of 0.8 U/kg; bexcessive includes the categories moderately high and high; cpercentage BF could not be estimated for these children
Table 1 - Socioeconomic and demographic characteristics of children and adolescents with diabetes mellitus type 1
Categories Children (n=11)
Adolescents (n=43)
Total (n=54)
n % n % n %
Sex F 6 54.5 23 53.5 29 53.7
M 5 45.5 20 46.5 25 46.3
Age (years)a 4-9 11 100.0 – – 11 20.4
10-13 – – 19 44.2 19 35.2
14-18 – – 24 55.8 24 44.4
Educational level (years)b 2.1±1.2 7.3±2.2 –
Per capita income(as proportion of
monthly minimum wage)b 0.54±0.32 0.58±0.41 0.58±0.39
Number of members in family
2-3 2 18.2 8 18.6 10 18.5
4 6 54.5 21 48.8 27 50.0
5-6 3 27.3 14 32.6 17 31.5
Physical activity yes 4 36.4 31 72.1 35 64.8
no 7 63.6 12 27.9 19 35.2
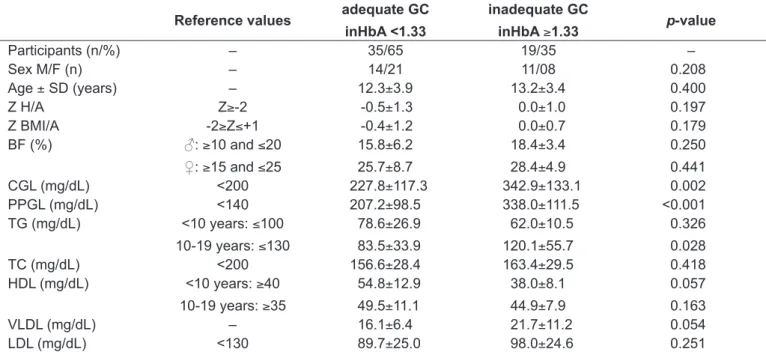
Table 3 - Means and standard deviations for anthropometric and biochemical characteristics against glycemic control
Reference values adequate GC inHbA <1.33
inadequate GC
inHbA ≥1.33 p-value
Participants (n/%) – 35/65 19/35 –
Sex M/F (n) – 14/21 11/08 0.208
Age ± SD (years) – 12.3±3.9 13.2±3.4 0.400
Z H/A Z≥-2 -0.5±1.3 0.0±1.0 0.197
Z BMI/A -2≥Z≤+1 -0.4±1.2 0.0±0.7 0.179
BF (%) ♂: ≥10 and ≤20
♀: ≥15 and ≤25
15.8±6.2
25.7±8.7
18.4±3.4
28.4±4.9
0.250
0.441
CGL (mg/dL) <200 227.8±117.3 342.9±133.1 0.002
PPGL (mg/dL) <140 207.2±98.5 338.0±111.5 <0.001
TG (mg/dL) <10 years: ≤100
10-19 years: ≤130
78.6±26.9
83.5±33.9
62.0±10.5
120.1±55.7
0.326
0.028
TC (mg/dL) <200 156.6±28.4 163.4±29.5 0.418
HDL (mg/dL) <10 years: ≥40
10-19 years: ≥35
54.8±12.9
49.5±11.1
38.0±8.1
44.9±7.9
0.057
0.163
VLDL (mg/dL) – 16.1±6.4 21.7±11.2 0.054
LDL (mg/dL) <130 89.7±25.0 98.0±24.6 0.251
Z H/A: standard deviation score for height for age. Z BMI/A: standard deviation score for body mass index for age; BF: body fat. ♂: males. ♀:
females. CGL: casual glycemia. PPGL: postprandial glycemia. TG: triglycerides. TC: total serum cholesterol. HDL: high density lipoprotein. VLDL: very low density lipoprotein. LDL: low density lipoprotein
WC over the 90th percentile. With regard to adipos-ity, approximately half of the participants (46.3%) had good BF percentage, but 38.9% had higher than recom-mended adiposity.
Table 3 contains the anthropometric and biochemical data stratiied by GC, which was inadequate in 35% of cases, the majority males (58%). The group with inadequate GC had sig-niicantly higher CGL levels (p<0.05), although both groups had maximum values over 500mg/dL; and the inadequate group also had signiicantly higher PPGL (p<0.001) with the lowest result in the group being 150mg/dL. Triglycerides were signiicantly higher in the group of 10 to 19-year-olds with inadequate GC (p<0.05). Children under ten in the adequate GC group had higher HDL levels, but the difference was on the threshold of signiicance (p=0.057).
The results for the analysis of relationships between variables are shown in Table 4. There were signiicant correlations between inHbA and the following variables: WC (r=0.336; p=0.013), CGL (r=0.332; p=0.014), PPGL (r=0.49; p<0.001), TG (r=0.422; p=0.001) and VLDL (r=0.443; p=0.001). There was a signiicant correlation between LDL and TC (r=0.85; p<0.001). Triglycerides correlated with WC (r=0.313; p=0.021) and with VLDL (r=0.97; p<0.001).
Discussion
There were signiicant correlations between inHbA and WC, CGL, PPGL, TG and VLDL, indicating that glycemia and the lipid proile affect metabolic control in DM1 pa-tients. The relationship between hyperglycemia and develop-ment of cardiovascular complications has been shown in an experimental study with diabetic mice. A group of mice fed a cholesterol free diet had signiicantly larger atherosclerotic lesions than non diabetic mice(2).
Table 4 - Correlations between anthropometric and biochemical variables in children and adolescents with DM1
inHbA LDL TC TG
r p-value r p-value r p-value r p-value
inHbA 1.000 – 0.160 0.249 – – – –
WC (cm) 0.336 0.013* 0.030 0.830 0.134 0.335 0.313 0.021*
TSF (mm) -0.061 0.664 0.066 0.633 0.114 0.413 0.017 0.902
SSF (mm) 0.175 0.206 0.061 0.661 0.153 0.271 0.239 0.082
BF (%) -0.029 0.844 0.069 0.639 0.124 0.403 0.046 0.754
CGL (mg/dL)k 0.332 0.014* 0.075 0.587 -0.003 0.982 0.128 0.356
PPGL (mg/dL) 0.490 <0.001*** 0.092 0.507 0.009 0.949 0.196 0.155
TG (mg/dL) 0.422 0.001** 0.149 0.283 0.478 <0.001*** 1.000 –
TC (mg/dL) 0.201 0.146 0.854 <0.001*** 1.000 – – –
HDL (mg/dL) -0.196 0.155 -0.091 0.513 0.344 0.011* 0.142 0.307
VLDL (mg/dL) 0.443 0.001** 0.093 0.503 0.431 0.001** 0.975 <0.001***
inHbA: glycated hemoglobin index. LDL: low density lipoprotein. TC: total cholesterol. TG: triglycerides. WC: waist circumference. TSF: triceps skinfold. SSF: subscapular skinfold. BF: body fat. CGL: casual glycemia. PPGL: postprandial glycemia. TG: triglycerides. TC: total serum cho-lesterol. HDL: high density lipoprotein. VLDL: very low density lipoprotein. Student’s t test: *p<0.05; **p<0.01; ***p<0.001
This study did not analyze short stature, but it is known that DM1 is associated with a reduction in the inal height of patients, compromising growth in children and adolescents(20,21). The anthropometric proile identiied in
this study is satisfactory, since the majority were at a healthy weight, with appropriate height for age, at the time of assessment.
With regard to BF, it is considered worrying that 38.9% of the sample had undesirably high adiposity. However, it should be remembered that fat mass percentages can be overestimated using skin folds when compared with dual-emission X-ray (DEXA), especially in diabetics with high fat percentages. Collagen glycation in subcutaneous tissues can contribute to these tissues hardening and, in common with early indings of reduced joint mobility, may be an early consequence of DM1, preceding other long term complications(22). On the other hand, one study that
com-pared diabetic children, aged 1 to 11 years, with non-diabetic children found no difference in body fat percentage or lean mass(21). Therefore, in this study it has not been possible to
determine whether the number of subjects with undesir-ably high adiposity is a consequence of DM1 or an inherent feature of childhood and adolescence.
Waist circumference is a measure of central obesity and relects visceral fat that is metabolically active(23). The inHbA
correlated signiicantly with WC, which is in line with the ind-ings of the Diabetes Control and Complications Trial(24).
Sev-eral studies have demonstrated the relationship between WC and vascular rigidity, early stages of atherosclerosis(25),
cardio-vascular mortality(26), the development of microalbuminuria(24)
and emergence of the metabolic syndrome in DM1(27). There
is evidence for the relationship between insulin treatment, increase in WC and weight gain, especially among patients on intensive GC, suggesting that the increase in WC is inluenced by the insulin treatment(8).
Elevated inHbA indicates ineffective metabolic control and has been correlated with increased PPGL. An in vitro study showed that one of the consequences of chronic hyper-glycemia is increased LDL glycation, making it more suscep-tible to the oxidative process(28). These results provide more
evidence that inadequate GC increases cardiovascular risk in DM1. Data from Epidemiology of Diabetes Complica-tions indicate a relaComplica-tionship between HbA and weight gain, where people with worse GC had greater weight gain(29). In
this study, there was a correlation between Z BMI/A and inHbA, but this was not signiicant, possibly because of the restricted sample size.
It was found that increases in BMI, WC, TSF, SSF and BF all increased insulin resistance proportionally among DM1 patients aged 8 to 18. Higher HbA levels were also associ-ated with insulin resistance. The consequent incapacity to take up glucose has been linked with increased TC, LDL and TG concentrations and reduced HDL levels(30).
References
1. Lachica LA, García MC. Diabetic nephropathy and cardiovascular risk. Aten Primaria 2010;42:173-5.
2. Renard CB, Kramer F, Johansson F, Lamharzi N, Tannock LR, von Herrath MG et al. Diabetes and diabetes-associated lipid abnormalities have distinct effects on initiation and progression of atherosclerotic lesions. J Clin Invest 2004;114:659-68.
3. Rönnback M, Fagerudd J, Forsblom C, Pettersson-Fernholm K, Reunanen A et al. Altered age-related blood pressure pattern in type 1 diabetes. Circulation 2004;110:1076-82.
4. Giannattasio C, Failla M, Piperno A, Grappiolo A, Gamba P, Paleari F et al. Early impairment of large artery structure and function in type I diabetes mellitus. Diabetologia 1999;42:987-94.
5. Wild S, Roglic G, Green A, Sicree R, King H. Global prevalence of diabetes: estimates for the year 2000 and projections for 2030. Diabetes Care 2004;27:1047-53. 6. Collado-Mesa F, Barceló A, Arheart KL, Messiah SE. An ecological analysis of
childhood-onset type 1 diabetes incidence and prevalence in Latin America. Rev PanamSaludPublica 2004;15:388-94.
7. No authors listed. Effect of intensive diabetes management on macrovascular events and risk factors in the Diabetes Control and Complications Trial. Am J Cardiol 1995;75:894-903.
8. No authors listed. Inluence of intensive diabetes treatment on body weight
and composition of adults with type 1 diabetes in the Diabetes Control and Complications Trial. Diabetes Care 2001;24:1711-21.
9. Holl RW, Grabert M, Sorgo W, Heinze E, Debatin KM. Contributions of age, gender and insulin administration to weight gain in subjects with IDDM. Diabetologia 1998;41:542-7.
10. Organização Pan-Americana de Saúde. La salud del adolescente y el joven en las Américas. Washington: OPS; 1985.
11. WorldHealth Organization. WHO Anthro for personal computers manual: software for assessing growth and development of the world’s children. Geneva: WHO; 2010.
12. Brasil. Ministério da Saúde. Secretaria de Atenção à Saúde – Departamento de Atenção Básica. Protocolos do Sistema de Vigilância Alimentar e Nutricional – SISVAN na assistência à saúde. Brasília: Ministério da Saúde, 2008. 13. McCarthy HD, Jarrett KV, Crawley HF. The development of waist
circumference percentiles in British children aged 5.0-16.9 y. Eur J ClinNutr 2001;55:902-7.
14. Frisancho AR. New norms of upper limb fat and muscle areas for assessment of nutritional status. Am J ClinNutr 1981;34:2540-5.
15. Slaughter MH, Lohman TG, Boileau RA, Horswill CA, Stillman RJ, Van Loan MD et al. Skinfold equations for estimation of body fatness in children and youth. Hum Biol 1988;60:709-23.
16. Lohman TG. The use of skinfolds to estimate body fatness on children and youth. JOPERD 1987;58:98-102.
17. No authors listed. National Cholesterol Education Program (NCEP): highlights of the report of the expert panel on blood cholesterol levels in children and adolescents. Pediatrics 1992;89:495-501.
18. Chase HP, Jackson WE, Hoops SL, Cockerman RS, Archer PG, O’Brien D. Glucose control and the renal and retinal complications of insulin-dependent diabetes. JAMA 1989;261:1155-60.
19. Conget I, Giménez M. Glucose control and cardiovascular disease: is it important? No. Diabetes Care 2009;32 (Suppl 2):S334-6.
20. Meira SO, Morcillo AM, Lemos-Marini SH, Paulino MF, Minicucci WJ,
Guerra-Júnior G. Pubertal growth and inal height in 40 patients with type 1 diabetes
mellitus. Arq Bras Endocrinol Metab 2005;49:396-402.
21. Paulino MF, Lemos-Marini SH, Guerra-Júnior G, Minicucci WJ, Mendes CT, Morcillo AM. Growth and body composition in children with type 1 diabetes mellitus. Arq Bras Endocrinol Metab 2006;50:490-8.
22. Ingberg CM, Särnblad S, Palmér M, Schvarcz E, Berne C, Aman J. Body composition in adolescent girls with type 1 diabetes. Diabet Med 2003;20:1005-11.
23. Nieves DJ, Cnop M, Retzlaff B, Walden CE, Brunzell JD, Knopp RH et al. The
atherogenic lipoprotein proile associated with obesity and insulin resistance
is largely attributable to intra-abdominal fat. Diabetes 2003;52:172-9. 24. De Boer IH, Sibley SD, Kestenbaum B, Sampson JN, Young B, Cleary PA et al.
Central obesity, incident microalbuminuria, and change in creatinine clearance in the epidemiology of diabetes interventions and complications study. J Am Soc Nephrol 2007;18:235-43.
25. Wadwa RP, Urbina EM, Anderson AM, Hamman RF, Dolan LM, Rodriguez BL et al. Measures of arterial stiffness in youth with type 1 and type 2 diabetes: the SEARCH for diabetes in youth study. Diabetes Care 2010;33:881-6.
26. Conway B, Miller RG, Costacou T, Fried L, Kelsey S, Evans RW et al. Adiposity and mortality in type 1 diabetes. Int J Obes (Lond) 2009;33:796-805. 27. Nádas J, Putz Z, Fövényi J, Gaál Z, Gyimesi A, Hídvégi T et al. Cardiovascular
risk factors characteristic for the metabolic syndrome in adult patients with type 1 diabetes. Exp Clin Endocrinol Diabetes 2009;117:107-12.
28. De Castro SH, Castro-Faria-Neto HC, Gomes MB. Association of postprandial hyperglycemia with in vitro LDL oxidation in non-smoking patients with type 1 diabetes – a cross-sectional study. Rev Diabet Stud 2005;2:157-64.
29. Williams KV, Erbey JR, Becker D, Orchard TJ. Improved glycemic control reduces the impact of weight gain on cardiovascular risk factors in type 1 diabetes. The Epidemiology of Diabetes Complications Study. Diabetes Care 1999;22:1084-91.
30. Szadkowska A, Pietrzak I, Mianowska B, Bodalska-Lipińska J, Keenan HA,
Toporowska-Kowalska E et al. Insulin sensitivity in type 1 diabetic children and adolescents. Diabet Med 2008;25:282-8.
relationship between the anthropometric and biochemical proiles of DM1 patients who were still free from the disease’s complications. Including people with associated diseases could have affected the results, particularly with relation to serum lipids.
In summary, this study has shown that inadequate GC is correlated with higher serum lipid concentrations, specii-cally TG and VLDL, which indicates increased cardiovas-cular risk. The correlation between WC and inHbA shows the importance of including WC measurement in routine outpatients follow-up of young people with DM1, thereby
screening for patients at cardiovascular risk. In order to achieve this, it is necessary to deine speciic WC cutoff points for this group. Furthermore, it is essential that serum lipids be monitored if adequate metabolic control is to be achieved and maintained.