Contents lists available atScienceDirect
Energy Policy
journal homepage:www.elsevier.com/locate/enpol
Accounting for local impacts of photovoltaic farms: The application of two
stated preferences approaches to a case-study in Portugal
Anabela Botelho
a, Lina Lourenço-Gomes
b, Lígia Pinto
c, Sara Sousa
d, Marieta Valente
c,⁎aDEGEIT and GOVCOPP, University of Aveiro, 3810-193 Aveiro, Portugal
bCETRAD and DESG, University of Trás-os-Montes and Alto Douro, 5000-801 Vila Real, Portugal cEEG and NIMA, University of Minho, 4710-057 Braga, Portugal
dISCAC, Polytechnic Institute of Coimbra, 3040-316 Coimbra, Portugal
A R T I C L E I N F O
Keywords: Photovoltaic farms Stated preference methods Contingent valuation Discrete choice experiments Environmental impacts
A B S T R A C T
Renewable energy sources for electricity generation are unequivocally more environmentally friendly than the traditional sources, but are not impact-free. Given the potential for solar photovoltaic energy to contribute to the energy mix in some countries, it is timely to carefully consider the potential environmental costs of operation of photovoltaic farms, which are experienced by the local population, while the general benefits accrue to all. We apply the contingent valuation method to a sample of local residents close to three selected photovoltaic farms in Portugal. Also, we design a discrete choice experiment to elicit the valuation of specific adverse impacts of electricity generation through photovoltaic energy by national residents. Our results show that the value elicited in the vicinity of the photovoltaic farms is non-negligible. On the other hand, national residents ponder the trade-offs implied by the choice sets and value positively the different adverse local impacts. Both of these estimates, in conjunction or independently, can be used to fully account for this often neglected cost of solar energy. Furthermore, we argue that when studying the public acceptance of renewables, using stated preference methods explicitly presents the trade-offs between negative impacts and costs, contributing to more realistic portrayal of public opinion.
1. Introduction
Renewable energy sources (RES) present undeniable advantages over other energy sources ranging from national energy security to reduced environmental impacts in terms of air pollution, including greenhouse gas emissions (e.g.Borenstein, 2012;Wiser et al., 2016). Notwithstanding the many advantages of renewable energy sources, they are not entirely“environmentally benign” in that they also damage the environment and impact individuals negatively (OECD/ IEA, 1998). This occurs specifically as a consequence of the operation of the power facilities and the damages are mostly experienced locally. As a consequence, the benefits of renewable energy sources are shared by the population in general, but the negative impacts are mostly experienced by communities neighbouring the facilities. In this case study we focus on solar photovoltaic farms and how the impact of their operation is monetarily valued by the two groups of stakeholders to firstly establish how stated preference methods in economic valuation can be applied to enrich benefit-cost analysis concerning future developments, and secondly to check whether a compensation is
feasible from the beneficiaries to those negatively affected.
Solar photovoltaic farms have been increasingly used to produce electricity in the last years with decreasingfixed and variable costs (Baker et al., 2013; Louwen et al., 2016). Being “one of the most promising emerging technologies”, the International Energy Agency predicts that the share of photovoltaic energy will account for 16% of the global electricity production by 2050 (IEA, 2015). In general, solar energy has the potential to reduce greenhouse gas emissions and help in the transition towards a green model of growth less dependent on fossil fuels and more sustainable (OECD, 2012). As such, not only do photovoltaic developments allow countries to comply with national goals for international agreements, and increase national energy independence, but also contribute towards local economic develop-ment.
While contributing to local economic development, it is also a fact that the operation of solar photovoltaic farms causes local negative impacts. When making a decision about a new energy project, all benefits and costs need to be accounted for, so that an efficient decision from an economic perspective is made and economic welfare
max-http://dx.doi.org/10.1016/j.enpol.2017.06.065
Received 10 January 2017; Received in revised form 27 June 2017; Accepted 29 June 2017
⁎Corresponding author.
E-mail addresses:anabela.botelho@ua.pt(A. Botelho),lsofia@utad.pt(L. Lourenço-Gomes),pintol@eeg.uminho.pt(L. Pinto),ssousa@iscac.pt(S. Sousa), mvalente@eeg.uminho.pt(M. Valente).
Available online 06 July 2017
0301-4215/ © 2017 Elsevier Ltd. All rights reserved.
imized. As a consequence, in the particular case of photovoltaic energy, the costs imposed by the daily operation of the farms on the local population need to be accounted for. Furthermore, given that the stakeholders who benefit and those who incur the above mentioned costs are not the same, equity considerations also call for including and measuring the impacts on the local population.
We propose that stated preference methods can be used to assign a monetary value to the local impacts, so that they can be included in the decision-making process concerning aspects such as the location and size of the farm, as well as ultimately the efficiency of its development and operation. These issues are explored in a case-study implemented in Portugal, which is a country that has intensified solar photovoltaic electricity generation the recent years and has the potential to continue this effort in the future. This implies that it is all the more timely to consider that although RES are beneficial in comparison with fossil fuels, local environmental impacts should not be neglected.
Specifically we first apply the contingent valuation method to local residents of specific solar photovoltaic farms in Portugal, so as to value economically the impact of the operation of their neighbouring farm. We then use the discrete choice experiments method on a random sample of the national population to elicit the value of specific impacts of solar photovoltaic farms. The application of these techniques to different groups of stakeholders highlights how they can be used to inform the decision-making process. In particular, this study illustrates how the two techniques can be used either autonomously or comple-mentarily, given that they are used to economically value local impacts of solar photovoltaic farms, which do not have a market value, but from two different perspectives. In accordance with the results from the survey byWelsch (2016)and to the best of our knowledge, this is the first stated preference study focusing specifically on the valuation of externalities from solar photovoltaic facilities, in particular using two complementary methods and perspectives.
This study also highlights that the impacts on local residents are non-negligible and that photovoltaic energy, as well as other renewable energy sources, is not entirely“environmentally benign” (Botelho et al., 2016). There is however potential for compensation ex-post, minimiz-ing social equity issues. Alternatively, at least all costs should be accounted for during the ex-ante project evaluation, and to that end having monetary estimates of the local damage is desirable, either in terms of use values by local residents or in terms of total economic value by all national beneficiaries.
The paper is organized as follows.Section 2reviews the evidence on local negative impacts of solar photovoltaic farms.Section 3describes the methodology by discussing the two valuation methods used. Section 4presents the results from the two valuation case studies as well as a comparison of results.Section 5draws the main conclusions.
2. Local negative impacts of PVFs
Notwithstanding the many benefits of using solar power in general and solar photovoltaic farms (henceforth PVFs) in particular, there are different types of non-negligible environmental burdens. TheOECD/ IEA (1998)consider that potential burdens are mostly small, with the exception of visual intrusion of large-scale projects. The OECD/ IEA (1998)mostly identifies life-cycle emissions as the main environmental impact caused by renewable energy sources, namely in what concerns the development, production, and decommissioning processes, rather than the daily operation of PVFs.
The literature on the environmental effects of PVFs often focuses on one of these perspectives, either the construction and dismantling phase or on the daily operations. Taking thefirst perspective,Turconi et al. (2013)review studies on the life-cycle assessment of electricity generation technologies andfind in the case of photovoltaic technol-ogies, those studies address emissions from the production of the infrastructure.Dubey et al. (2013)highlight potential consequences for workers, as well as the environment, during the life-cycle of the
technology. Other studies focus on the recycling stage at the end of the life of the project (Fthenakis, 2000) or on the impact of emissions during production of plant components on the environment and human health (Beylot et al., 2014). Furthermore, Guerin (2017a, 2017b)explores environmental and community risk during construc-tion of large scale solar PV plants by comparing expected risks with observed effects. The author concludes that for the studied Australian case“with the exception of road preparation, the project did not require large-scale earthworks and all impacts to the site were reversible” (Guerin, 2017b, p. 338).
Several studies concerning the operation of PVFs have identified other types of environmental burdens, most of them inconveniencing neighbouring populations. These depend on the size of the plant and are location-specific (Tsoutsos et al., 2005).
There are important impacts in terms of land use (Lackner and Sachs, 2005; Chiabrando et al., 2009). Large areas may be required to accommodate PVF projects, which as noted byChiabrando et al. (2009) explains recommendations to utilize photovoltaic energy on roofs before developing large-scale PVFs. On the other hand, PVFs may displace food crops and replace cultivable land (Sacchelli et al., 2016; Tsoutsos et al., 2005) which contributes to the ongoing“food vs. fuel” controversy (Srinivasan, 2009).Delfanti et al. (2016) document the regulatory effort in Italy to restrict the expansion of PVFs to green-fields. There is however the potential for co-location with use of the ground for animal grazing (Hernandez et al., 2014), food crops (Dupraz et al., 2011) or bio-fuel cultivation (Ravi et al., 2014).
Chiabrando et al. (2009, p. 2445)identify a potential for fragmen-tation of the countryside in that“the PV system may deplete the unitary characteristic of a specific countryside” with negative impacts on nature conservation and biodiversity. Changes have also been identified in local animal and plant species as a result of the installation and operation of PVFs (e.g.Chiabrando et al., 2009), as well as aquatic ecosystems (Grippo et al., 2015). Several studies also point to impacts on wildlife and biodiversity during construction, operations and decommissioning of solar photovoltaic plants (Gasparatos et al., 2017; Katzner et al., 2013; Lovich and Ennen, 2011; Northrup and Wittemyer, 2013).
Another potential negative impact concerns landscape alterations (Lakhani et al., 2014; Mérida-Rodríguez et al., 2015; Naspetti et al., 2016; Scognamiglio, 2016).Torres-Sibille et al. (2009) explore the visual impact on the landscape of often rural areas both objectively through expert assessments and subjectively through public percep-tions, focusing on the impacts due to the visibility of the plant in relation to the total landscape area, colour, fractality (i.e., the contrast in shapes relative to the surrounding environment) and concurrent use of different types of panels in one plant. Also,Fernandez-Jimenez et al. (2015)study the potential observability of photovoltaic plants, which takes into account the number of potential observers, both local inhabitants and travellers as well as distance to the plant. Choosing locations so as to minimize observability of new plants can contribute to less visual impact on the landscape and increases local support.
Thermal pollution is as a potential effect from the impact on the thermal balance of the surrounding area (Gunerhan et al., 2008), as well as impact on the climate of the site (Chiabrando et al., 2009; Lovich and Ennen, 2011; Neff, 1981). There is also the potential discharge of pollutants (Gunerhan et al., 2008), although normal but still risky for locals and workers (Tsoutsos et al., 2005), as well as the use of toxicants that may contaminate local waterways (Gasparatos et al., 2017).
Several authors have studied the negative impacts of the glare effect due to reflection of sunlight (Chiabrando et al., 2009; Ho, 2013; Rose and Wollert, 2015) and this is potentially a major source of inconvenience given that it can directly affect the wellbeing of local residents on a daily basis, rather than indirectly as with the other impacts identified above. The perspective taken in this paper focuses on the operation of PVFs, thus excluding the impacts from the construction and dismantling phase.
3. Methodology and empirical application in Portugal
3.1. Stated preference methods
Nonmarket valuation techniques are used when the market cannot provide decision-makers with price information about goods or ser-vices (Carson, 2000). In what concerns the environment, it is often the case that environmental goods and services are either public or common goods and do not have a market expression. This is the case of eliciting welfare changes caused by the operation of PVFs, since these impacts are not“traded” in markets.
Furthermore, when undertaking benefit-cost analysis about renew-able energies, information about all costs imposed by the development and operation of energy plants is required. As argued above, the impacts of specific RES on specific locations and the local communities should not be forgotten when all costs and benefits are computed. Thus a monetary valuation of those impacts needs to be provided so that these local impacts are considered in equal (i.e. monetary) terms as other costs or benefits. This calls for an economic valuation exercise to be undertaken, and this is where nonmarket valuation techniques can help (e.g.Atkinson and Mourato, 2008;Menegaki, 2008).
Total economic value of an environmental good or service com-prises both use and non-use values (Pearce and Turner, 1990). Use value includes the direct, indirect and option values. In the case of valuing local impacts of PVFs by eliciting from the local population their willingness to accept (WTA) to endure a welfare loss, it is use values that are being elicited. As for non-use values these concern essentially existence value, whereby the individual for whom these are elicited has no prospect of directly or indirectly benefiting from the good or service in question. When eliciting the willingness of national respondents to compensate local residents for local impacts, what is being analysed is the willingness to pay (WTP) of non-use values.
Stated preference studies of local externalities from renewable energy sources have so far mostly been applied to wind energy facilities (Welsch, 2016). In the present study we explore local impacts of solar photovoltaic farms using Portugal as a case-study case. We apply two nonmarket valuation techniques, namely two stated preference tech-niques that will complementarily value local and global impacts from the perspective of local residents or national residents. The contingent valuation method (CVM) will be used to survey the former and a discrete choice experiment (DCE) will be applied to assess the welfare impacts from the perspective of the general population. Either measure of economic value can be used if the objective is to come up with a monetary estimate.
It should however be acknowledged that, as in the case of the present study, these measures correspond to different value compo-nents. In our study, we are not interested in providing a definitive valuation for compensation purposes, but rather in assessingfirst if the value of local impacts is non-negligible, and second how the two measures compare, so as to assess the viability of a welfare-enhancing transfer between stakeholders. We present next an overview of the Portuguese case-study in terms of RES current situation and potential, and follow with a discussion of each of the methods and empirical application conducted in Portugal.
3.2. RES and solar photovoltaic energy in Portugal
Portuguese total renewable sources electricity production increased from 16,593 GWh in 2007 to 33,347 GWh in 2016, with the highest share of RES coming from hydric power (50.6%) and wind power (37.4%). During the same period photovoltaic production increased from 24 GWh in 2007 to 816 GWh in 2016 (DGEG, 2016, 2017). In terms of consumption, RES account for 28% of gross final energy consumption in 2015. As a consequence, Portugal is on steady path to fulfil its EU commitment of a 31% renewable energy target by 2020 (as put forward in thePortuguese Council of Ministers Resolution no. 20 (2013)).
The Portuguese wholesale electricity market is a part of the Iberian Electricity Market (MIBEL) and” Spain and Portugal have been making good progress towards the 2017 target of 3.0 GW of interconnection capacity between them and there is price convergence 85% of the time.” (OECD/ IEA, 2016, p. 97). It should be noted however that the interconnection with neighbouring France is only at 1.5% of total capacity according to the latest assessment (OECD/ IEA, 2016).
Focusing on solar photovoltaic energy, Portugal is one of the EU countries with the highest photovoltaic solar electricity potential (Coelho et al., 2017; European Union, 2012). In a decade Portugal has increased the installed capacity of photovoltaic power from 3 MW in 2006 to 465 MW in 2016. In 2016, 34.8% of that capacity was located in the region of Alentejo, accounting for 37% of total national production. The remainder is scattered across the other regions.
In 2014, Portugal was the eighth country in the EU in terms of installed and connected photovoltaic capacity on grid (115 MWp) according to the Photovoltaic Barometer (EurObserv'ER, 2015). In spite of its potential for photovoltaic electricity production and the steady increase in installed capacity, the per capita photovoltaic capacity in 2014 was only 40.2 Wp/inhabitant compared to 102.9 in neighbouring Spain or the maximum observed in the EU of 474.1 in Germany (EurObserv'ER, 2015). Furthermore, while import depen-dency has decreased from 85.3% in 1995 to 71.6% in 2014, the average in the EU is 53.5% (European Commission, 2016). It is thus clear the potential for Portugal to deepen the investment in renewables and in particular in photovoltaic energy.
3.3. CVM and the local population questionnaires
The CVM consists of applying a questionnaire where a hypothetical market scenario is described (Bateman et al., 2002). A panel of experts provided guidelines for application, legitimizing the CVM, in that it can even“produce estimates reliable enough to be the starting point of a judicial process of damage assessment” (Arrow et al., 1993, p. 4610,).1
We designed a contingent valuation scenario to estimate the WTA of the local population for the negative impacts caused by the PVF's operation nearby. The questionnaire had the conventional four parts (Whitehead, 2006) with firstly questions about RES in general and secondly questions about on the production of electricity through PVFs, including the valuation question. The third part included questions about perceptions about energy sources, including non-renewables and thefinal part gathered information about respondents’ socio-economic characteristics (e.g., gender, education, family, income). The question-naire was iteratively reviewed using pilot studies (Botelho et al., 2014). The valuation question was formulated as an open question and the payment vehicle identified in the question was the monthly electricity bill. Three specific locations and PVFs were selected to administer the questionnaires in Portugal, located in the region of Alentejo, which is the region that accounts for about one third of the installed capacity of solar photovoltaic power in Portugal in 2015 (DGEG, 2016). Furthermore, the region of Alentejo is one of the regions in Europe with the highest photovoltaic solar electricity potential (European Union, 2012) and average suitability for photovoltaic systems (Perpiña Castillo et al., 2016). In terms of occupied area, the PVF in Amareleja (Location A) is the biggest (250 ha), followed by Ferreira do Alentejo (Location B with a total of 94 ha, which correspond to three smaller PVFs with 58 ha, 31 ha and 5 ha) and Hércules (Location C with 60 ha).
The valuation question used was:
Taking into account your income and your usual expenses, answer the following question: What is the minimum amount that you would be willing to receive as compensation for the inconvenience
1The interested reader is referred toChamp et al. (2003)andJohnston et al. (2017)
that the presence of the photovoltaic farm causes you? The amount would be credited to your monthly electricity bill.
You would be willing to receive ______________ Euros per month.
3.4. DCE and the national population questionnaires
DCE is a survey-based non-market valuation method that, rather than using a hypothetical scenario which is marginally altered, identifies the value of a non-market good or service as the value of its underlying attributes. This empirical method is based on the economic theory of Lancaster (1966)whereby goods or services are not valuable in themselves but because of their composing character-istics or attributes. To elicit the welfare changes experienced by the general population due to PVFs, we apply DCE and identify the main attributes involved in the impacts of PVFs. We design a series of sets of alternatives involving different levels of attributes and a corresponding cost. In each choice set, respondents choose the preferred combination of attributes and monetary cost, and we can thus identify how attribute levels are traded off against different costs, and infer the value of each attribute2(Hanley et al., 1998, 2001; Johnston et al., 2017; Pearce
et al., 2006).Champ et al. (2003)provide more detailed information in terms of empirical application and estimation for the interested reader. Previous applications of the method to the study of electricity produced through RES include Bergmann et al. (2006) and Borchers et al. (2007).
In our study we identified through focus groups and pilot studies three main attributes pertinent to PVFs namely an impact on the landscape, and impact on the local fauna andflora and a glare effect impact on the population. These attributes were traded off against a monetary cost. Similarly to the CVM questionnaire, we opted for a payment vehicle through the monthly electricity bill.
The DCE questionnaires consisted of four parts, namely thefirst addressed questions about renewable energy sources. The second part included the DCE with six choice sets, with a choice set described as the example inTable 1with two alternative ways of producing electricity using photovoltaic energy and a corresponding cost. The third part assessed respondents’ preferences and attitudes towards energy sources and the fourth part included generic background questions. The questionnaire design resulted from an interactive test and review process using pilot studies.
4. Results and discussion
4.1. Local residents
4.1.1. Sample description
In terms of implementation, the administration of the local residents’ questionnaire took place in May 2014 with a total of 61 questionnaires collected (22 in location A: Amareleja, 15 in location B: Hércules, and 24 in location C: Ferreira do Alentejo).3
In the sample there are 27 women and 34 men. The average age is 53 years old (standard deviation 17.7) with a minimum of 21 years and maximum of 87, and with 31.2% of individuals in retirement. In terms of qualifications, 26.7% of respondents had only primary school level, 20% held a bachelor or undergraduate degree, and the remaining respondents completed intermediate levels of education.
In terms of involvement with the local PVF, 36.1% reported they either worked in the PVF (4.9%) and/ or had family and acquaintances working there (36.1%).
Concerning the environmental and energy questions, 82% of respondents acknowledged that fossil fuel energy caused environmen-tal problems. Also, they were asked whether they believed that RES in general were beneficial for the population and 85.2% agreed.
In terms of electricity consumption, the average monthly bill was €78 considering the 58 respondents who supplied this information (with a minimum of€15 and a maximum of €300). It should be noted that these values were in most cases verified by the interviewers. Also, about half of respondents consider that it is (very) important to know the type of renewable energy that is included in electricity production.
4.1.2. WTA analysis and estimation
In terms of the elicited WTA, the values range from 0 to€300 with an overall average value of€29.20. Considering only positive WTA, the average is €45.68 for the 39 respondents. Relative to the monthly household electricity bill these WTA values range from 0% to 400% (all responses are below the totality of the electricity bill, except for six responses which correspond to 100% for four individuals, 111% and 400% for the other two respondents).
We apply regression analysis to the distribution of WTA and use several variables to explain the WTA. We propose that the decision process concerning the WTA takes place in two stages. In thefirst stage respondents are faced with the hypothetical valuation scenario and decide whether or not they are entitled to compensation. Once they decide they should be compensated, then in the second stage, they determine how much. In our valuation questions, only nonnegative integer values are admissible. It is common in valuation exercises such as this, for many individuals to answer zero, and this high frequency of zeros needs to be accounted for. In this study there are indeed 21 zero responses. As such, we propose that a two-part model isfitted to the data to take these features into consideration. The density function associated with this process is as follows, whereby density f1refers to the binary process and f2refers to the count process (Cameron and Trivedi, 2005. p. 681): ⎪ ⎪ ⎧ ⎨ ⎩ g y f f f f f y ( ) = (0) + (1− (0)) (0)if y=0 (1− (0)) ( )if y≥1 2 2 1 1 1 (1)
This representation implies that the independent variable can be zero due to the binary process or the count process. Specifically, the zero-inflated negative binomial allows for the two stages to be modelled separately, and for the zeros to be due to either of the stages (Cameron and Trivedi, 2009). The density f1is modelled as a logit model and the density f2as a negative binomial model.
The following functions are estimated using the command ZINB in Stata® software, version 13:
Prob WTA f glare RES selfinterest locB locC retired gender age income
( = 0) = ( , , , , ,
, , , )
benefit
1
(2)
WTA=f glare2( level,locB locC retired gender age income, , , , , ) (3) In terms of explanatory variables. we hypothesize that the WTA is site-specific given that different PVFs impose different types of costs to the local population. As such we include dummies for the two locations, Table 1
Choice set example. Consider the choice between form A of electricity generation through photovoltaic energy and form B of electricity generation also through photovoltaic energy. Tick your preferred option:
Form A Form B
Significant impact on the landscape Yes Yes Significant impact on the Fauna/Flora No Yes Produces glare affecting population Yes No
Increase in the monthly bill€ 12 8
Your choice
2It is possible to compute a WTP measure as the ratio of an attribute coefficient and
the cost or price coefficient.
3The questionnaires administration was part of a broader research project concerning
and use Location A (Amareleja) as the omitted category. Given that this is also the largest plant of the three, it is likely the local residents are more inconvenienced in this location than in the other locations, thus generating both a higher probability of stating a non-zero WTA and a higher WTA conditional on asking for compensation.
Thefirst stage model considers that entitlement to compensation and we include several factor which may increase or decrease the probability of feeling entitled. In terms of the estimated model in the generic form of Eq.(2), this corresponds to estimating the impact of the selected explanatory variables on the probability of excess zeros. On the one hand, the perception of nuisance from the glare effect is likely to impact the probability positively, given that this is the local effect that directly affects the population wellbeing. This nuisance corresponds to a dichotomous variable to capture whether or not the individual is annoyed by the glare effect or not (Glare effect nuisance).
On the other hand, if RES or the PVF are perceived as positive, individuals are less likely to feel compensation is required. As such we include a dummy for whether individuals consider that RES benefit the population (RES benefit population) and a dummy to capture whether the respondent or family/acquaintances work at the PVF (Self-inter-est). We hypothesize that an individual involved economically directly or indirectly with the PVF is less likely to state a positive WTA.
In the second stage model in Eq.(3), we model the WTA on an ordinal variable capturing the degree of nuisance from the glare effect (Glare effect nuisance level) and hypothesize that all things being equal, the more the stated experienced nuisance the higher the required compensation.
For the regressions in both stages, we control for gender, age, whether the respondent is retired (retired) and per capita household income (income pc).
Table 2presents the results for the estimation of the zero-inflated negative binomial model using the questionnaire responses from the local residents.
There are several options in the literature to assess goodness-of-fit of the count model (Cameron and Trivedi, 2005). We run the likelihood ratio test comparing the full model with the model with constant only and conclude the model is as a whole statistically significant (LR chi2 = 21.95, p-value < 0.01). Furthermore, the likelihood ratio test compar-ing the zero-inflated negative binomial with the zero-inflated Poisson model is also statistically significant (chibar2 (01) = 746.81, p < 0.01), supporting the choice of the negative binomial. The Vuong test looks at the improvement of using the zero-inflated formulation over a simple negative binomial and again the null of no improvement is rejected (z = 6.14, p-value < 0.01).
According to the results presented inTable 2, for thefirst stage, the entitlement to compensation depends essentially on the location of the PVF. Relative to Location A (Amareleja), the probability that local residents state no compensation is lower in Location B, but it is higher in Location C, all else being equal.
In terms of controls, the coefficient on the variable that captures whether the respondent is retired is statistically significant and negative, so all else being equal, the probability that a retired individual asks for no compensation is lower. As for the other statistically significant coefficient, on the per capita income, it is economically irrelevant.
Concerning the WTA in the second stage, the degree of experienced nuisance from the glare effect affects positively the amount of stated compensation. The locations are also statistically significant in terms of effects with negative signs, implying that relative to Location A, both locations separately elicit lower compensations. Based on the regres-sion in the second stage, we predict the amount of compensation demanded on average by the local residents in Location A (Amareleja) to be the highest (€53.24 per month), followed by Location B (Hercules) €21.34 and Location C (Ferreira do Alentejo) with €12.16. It should be noted that these compensation amounts differ and are site-specific. Furthermore, while we do not have observations from other PVFs to infer causality, we can see that these amounts are positively correlated to the size of the individual PVF (while Location C has the intermediate total area, it is composed of three smaller plants and it is likely that the impact experienced by local residents comes from one of the smaller plants).
4.2. National sample (non-residents)
4.2.1. Sample description
The national population sample was collected during thefirst half of 2014 and is composed of 250 residents of Mainland Portugal. In terms of sample composition, there are 117 (46.8%) men and 133 women (53.2%). The mean age is 50.2 years old (with standard deviation of 17.3 years, and minimum of 18 and maximum of 85) and in terms of occupation, 35.3% are retired. Inspecting the qualifications in the sample, 18.5% only have primary schooling, 27% hold a degree (bachelor, undergraduate or master) with about half the sample indicating in-between qualifications.
As for environmental and energy perceptions, 69% of respondents agree that energy from fossil fuels causes environmental problems, and 91.6% that RES benefit the population in general. In terms of how friendly RES are perceived, 92.8% and 92.4% of respondents consider that wind and solar energy are (very) environmentally friendly.
Some questions concerned actual electricity consumption. The average monthly household electricity bill was 75 euros (with standard deviation of €43.6 and minimum €20 and maximum €250). The majority of the respondents (72.4%) agreed that knowing the energy mix in terms of renewables used in the production of their consumed electricity was (very) important.
4.2.2. WTP analysis and estimation
Given the setup of the choice experiment discussed above, there are six choice sets with two options available, corresponding to twelve Table 2
Estimation of the WTA determinants for local population (zero-inflated negative binomial model).
(1) (2)
Variables Prob (WTA = 0) WTA
Glare effect nuisance (yes/no) −1.284 (0.975) RES benefit population (yes/no) −0.249 (1.654) Self-interest (yes/no) 0.579
(1.032)
Glare effect nuisance (-−1 to 5++) 0.372*** (0.115) Location B (Hercules) −20.79*** −0.898*** (1.837) (0.298) Location C (Ferreira) 2.843*** −0.607** (1.050) (0.307) Retired −3.742*** 0.909** (1.441) (0.459) Gender (1 female/ 0 male) −0.446 −0.00447
(0.917) (0.284) Age 0.0477 −0.0365*** (0.0370) (0.0103) Income pc 0.00236* −0.000750 (0.00138) (0.000483) Constant −3.912 5.430*** (2.842) (0.569) Ln(alpha) −0.567* (0.309)
N: 61 (zero = 39); Wald chi2(4) 40.68*** 61 61
Notes: Robust standard errors in parentheses; significance levels: *** p < 0.01, ** p < 0.05, * p < 0.1; dichotomous variables take value 1 if "Yes" and 0 if "no"; Location A (Amareleja) is the omitted category. Estimation using Stata® software, version 13.
choice decisions per respondent. In total there are 3000 distinct observations that have a data structure similar to panel data. There was a question to ascertain how respondents made their choices and 42.4% indicated that for their choices they had considered all attri-butes, while the remaining had considered only some of the attributes. In terms of regression model, we use a binary logit model (with cluster correction). The binary logit model is used to describe the choice between two well defined alternatives, whether to choose forms of electricity generation A or B. To account for the panel data structure, given the multiple observations from the same respondent, we applied the cluster correction to correct the computed standard errors that are biased downward, in the presence of common effects (correlation across observations). Each choice set is characterized by a combination of attributes, meaning that respondents choose levels of attributes.
The binary logit is based on random utility function (composed by a deterministic and a random component related to the unobservable aspects of the choice process) and assumes that consumers make their choices to maximize utility. Assuming that the random parts of the utility functions are distributed as independent extreme value, the probability of choosing an alternative is F = exp( ′β xβ x)
1 + exp( ′ )
i
i( in which x is a
set of measurable covariates, β is a vector of parameters to be estimated) (Greene, 2012). InTable 3, the covariates correspond to the attributes that were selected, namely landscape, fauna/flora, glare and price.
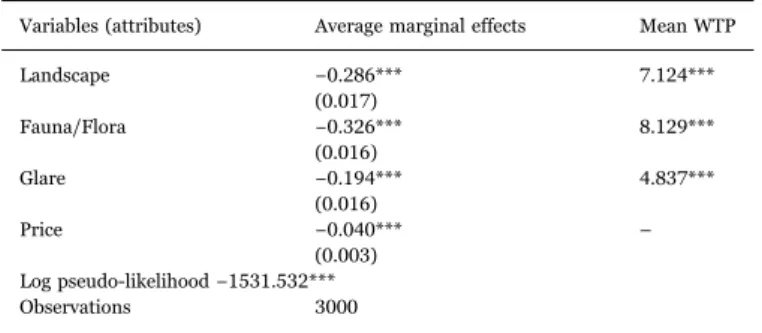
Table 3 presents the estimated average marginal effects of each attribute on each individual's choice. In the last column we report respondents’ predicted willingness to pay (WTP) to avoid each environmental impact.
As perTable 3, the estimates for the coefficients of all attributes are statistically significant and different. Each attribute separately has a negative impact on the probability of choosing a particular form of electricity producing using PVFs. When the attribute in question corresponds to impacts on fauna and flora, respondents were 32.6 percentage points (p.p) less likely to choose that form of production. Respondents are also 28.6 p.p. less likely to choose a production form that impacts the landscape. Finally the glare effect reduces the probability of a form of production generating it being chosen in 19.4 p.p.
To assess goodness-of-fit of the model the Hosmer-Lemeshow test is performed to compare samples frequency of the dependent variable and thefitted probability and check for misspecification (Cameron and Trivedi, 2009, p. 457). In this case the test yields a chi2(6) of 930.89 with the corresponding p-value < 0.01 thus not accepting the hypothesis of misspecification. Furthermore, the share of correctly classified observations is 76.47%.
When estimating the WTP for each attribute separately, wefind that respondents are on average willing to pay€8.13 per month to avoid an
impact on fauna andflora, €7.12 to avoid impacts on landscape and less importantly€4.84 to prevent impacts from the glare effect. 4.3. Discussion
The previous sections report on the application of stated preference methods to estimate welfare effects of the local operation of PVFs. By eliciting the economic values from two different groups of stakeholders, the estimates thus correspond to different components of the total economic value. The CVM was used to elicit the valuation of local residents of the WTA, while a DCE was implemented for national residents to value what is essentially a non-use value.
In the former study, we selected three locations for PVFs which differ in terms of total area and land use. Location A (Amareleja) is the biggest PVF and in fact the average estimated WTA is the largest in comparison to the other two (€53.24 per month). In Location B (Hercules), local residents are less likely to indicate a positive WTA than in A and on average the estimated WTA is lower (€21.34). Location C (Ferreira do Alentejo) has the intermediate total area of the study, but consists of three smaller plants, and in fact residents are more likely to feel entitled to compensation than in A, but demand a lower on average compensation (€12.16). Given the reduced number of locations we can only speculate that a more scattered sitting in Location C affects more residents, but reduces the individual nuisance. The DCE elicited the valuation from a national sample of the local environmental impacts experienced by local residents. The results from the estimation show that all attributes considered were statistically significant and valued differently, ranging from€4.84 to €8.13 per month. A different valuation for each attribute can be interpreted as respondents pondering each individual attribute rather than a generic nuisance associated with the local operation of PVFs.
The estimates from the application of the CVM to local residents represent a monetary value for the different dimensions of nuisance caused by the proximity of a specific local PVF. On the other hand, the approach of the DCE does not consider specific locations, but rather different attributes impacted by PVFs.
Both approaches allow decision-makers to consider all costs of the operation of PVFs albeit from different perspectives, and can thus be used in isolation or complementarily. Furthermore, the comparison of these estimates can be used to estimate the potential for compensatory transfers between the two types of stakeholders, namely those directly affected and the beneficiaries. Given that the number of local residents in comparison to the number of beneficiaries, it is safe to conclude that the welfare benefits more than compensate the costs, and, before taking into consideration equity issues, PVFs are potentially welfare-enhan-cing.
Finally, we argue that the application of these complementary methodologies can enrich the study of the gap between national and local public responses to large-scale energy infrastructures. In public opinion surveys the former often express support for the investments and the latter some form of opposition (Batel and Devine-Wright, 2015a, 2015b). Several authors have opted for less abstract questions concerning large-scale investments, rather more concrete scenarios including the consideration of drawbacks (Sütterlin and Siegrist, 2017for the case of solar photovoltaic) or a possible location close to the respondent (Batel and Devine-Wright, 2015afor the case of high voltage power lines). In both cases the public acceptance of the technology decreased. As pointed out bySütterlin and Siegrist (2017, p. 364)“the related drawbacks and necessary trade-offs are not part of people's mental representation of this energy source”. Using stated preference methods to elicit the economic value of the environmental impacts of solar photovoltaic farms, we are able to create a situation where trade-offs are inevitable when the monetary valuation is elicited. Therefore, these types of studies can lead to a more thorough and potentially more realistic consideration of public opinion about renewables.
Table 3
Estimation of the WTP by the national population (Binary logit model with cluster correction).
Variables (attributes) Average marginal effects Mean WTP
Landscape −0.286*** 7.124*** (0.017) Fauna/Flora −0.326*** 8.129*** (0.016) Glare −0.194*** 4.837*** (0.016) Price −0.040*** – (0.003) Log pseudo-likelihood−1531.532*** Observations 3000
Notes: Robust standard errors in parentheses using delta method; significance levels: *** p < 0.01, ** p < 0.05, * p < 0.1; Estimation using Stata® software, version 13, and Mean WTP using the Stata® user-written command wtp byHole (2007).
5. Conclusion and policy implications
When making decisions about sitting of RES projects, policy-makers should consider all costs and benefits to arrive at efficient decisions. In the case of PVFs they are normally considered envir-onmentally friendly, but in fact are not impact-free. The environmental impacts are mostly experienced locally, while the benefits from cleaner energy are shared by all. This study applies two economic nonmarket valuation techniques to estimate the local environmental impacts, namely the CVM and DCE, targeting two groups of stakeholders, local residents and national residents respectively. We apply the former methodology in three PVFs in Portugal. With a local resident sample, we estimate the minimum monetary compensation for the experienced local impacts. With a national sample we elicited the economic value attached to avoiding specific local impacts in the generation of electricity through PVFs. The Portuguese case-study presented illus-trates that these local impacts are indeed non-negligible in monetary terms and comparing the estimates, there is scope for a welfare-enhancing transfer between the two groups of stakeholders. A similar methodology can be applied to other case-studies either ex-post or during the planning stage for a thorough cost-benefit analysis. As for the Portuguese case-study, given the potential for PVFs to continue to expand in Portugal, it is timely not to forget to account for these local negative impacts.
Finally, we argue that when studying the public acceptance of renewables, using stated preference methods explicitly presents the trade-offs between negative impacts and costs, thus contributing to more realistic portrayal of public opinion.
Acknowledgments
The authors gratefully acknowledge the financial support from PTDC/EGE-ECO/122402/2010.
References
Arrow, K., Solow, R., Portney, P.R., Leamer, E.E., Radner, R., Schuman, H., 1993. Report of the NOAA Panel on Contingent Valuation. Federal register 58, pp. 4601–4614. Atkinson, G., Mourato, S., 2008. Environmental cost-benefit analysis. Annu. Rev.
Environ. Resour. 33, 317–344.
Baker, E., Fowlie, M., Lemoine, D., Reynolds, S.S., 2013. The economics of solar electricity. Annu. Rev. Resour. Econ. 5, 387–426.
Batel, S., Devine-Wright, P., 2015a. A critical and empirical analysis of the national-local ‘gap’ in public responses to large-scale energy infrastructures. J. Environ. Plan. Manag. 58, 1076–1095.
Batel, S., Devine-Wright, P., 2015b. Towards a better understanding of people's responses to renewable energy technologies: insights from social representations theory. Public Underst. Sci. 24, 311–325.
Bateman, I.J., Carson, R.T., Day, B., Hanemann, M., Hanley, N., Hett, T., Jones-Lee, M., Loomes, G., Mourato, S., Ozdemiroglu, E., 2002. Economic Valuation with Stated Preference Techniques: A Manual. Edward Elgar Publishing, Cheltenham, UK. Bergmann, A., Hanley, N., Wright, R., 2006. Valuing the attributes of renewable energy
investments. Energy Policy 34, 1004–1014.
Beylot, A., Payet, J., Puech, C., Adra, N., Jacquin, P., Blanc, I., Beloin-Saint-Pierre, D., 2014. Environmental impacts of large-scale grid-connected ground-mounted PV installations. Renew. Energy 61, 2–6.
Borchers, A.M., Duke, J.M., Parsons, G.R., 2007. Does willingness to pay for green energy differ by source? Energy Policy 35, 3327–3334.
Borenstein, S., 2012. The private and public economics of renewable electricity generation. J. Econ. Perspect. 26, 67–92.
Botelho, A., Lourenço-Gomes, L., Pinto, L., Sousa, S., 2014. How to design reliable discrete choice surveys: the use of qualitative research methods. In: Proceedings of ICOPEV 2014– 2nd International Conference on Project Evaluation. ISBN 978-989-97050-3-6, Guimarães Portugal, pp. 157–166.
Botelho, A., Pinto, L.M.C., Lourenço-Gomes, L., Valente, M., Sousa, S., 2016. Social sustainability of renewable energy sources in electricity production: an application of the contingent valuation method. Sustain. Cities Soc. 26, 429–437.
Cameron, A.C., Trivedi, P.K., 2005. Microeconometrics: Methods and Applications. Cambridge University Press.
Cameron, A.C., Trivedi, P.K., 2009. Microeconometrics Using Stata. Stata Press, College Station, Texas.
Carson, R.T., 2000. Contingent Valuation: A User's Guide. Environ. Sci. Technol. 34, 1413–1418.
Champ, P., Brown, T., Boyle, K., 2003. Primer on Nonmarket Valuation. The Economics of Nonmarket Goods and Resource., V. 3. Kluwer Academic Publishers.
Chiabrando, R., Fabrizio, E., Garnero, G., 2009. The territorial and landscape impacts of photovoltaic systems: definition of impacts and assessment of the glare risk. Renew. Sustain. Energy Rev. 13, 2441–2451.
Coelho, M.B., Cabral, P., Rodrigues, S., 2017. Solar photovoltaic farms suitability analysis: a Portuguese case-study. Int. J. Renew. Energy Res. (IJRER) 7, 243–254. Delfanti, L., Colantoni, A., Recanatesi, F., Bencardino, M., Sateriano, A., Zambon, I.,
Salvati, L., 2016. Solar plants, environmental degradation and local socioeconomic contexts: a case study in a Mediterranean country. Environ. Impact Assess. Rev. 61, 88–93.
DGEG, 2016. Renováveis– Estatísticas rápidas n. 141 junho 2016, available at 〈www. dgeg.pt〉. Direção Geral de Energia e Geologia.
DGEG, 2017. Renováveis– Estatísticas rápidas n. 149 marco 2017, available at 〈www. dgeg.pt〉. Direção Geral de Energia e Geologia.
Dubey, S., Jadhav, N.Y., Zakirova, B., 2013. Socio-economic and environmental impacts of silicon based photovoltaic (PV) technologies. Energy Procedia 33, 322–334. Dupraz, C., Marrou, H., Talbot, G., Dufour, L., Nogier, A., Ferard, Y., 2011. Combining
solar photovoltaic panels and food crops for optimising land use: towards new agrivoltaic schemes. Renew. Energy 36, 2725–2732.
EurObserv'ER, 2015. Baromètre photovoltaïque/Photovoltaic barometer 2015. European Commission, 2016. EU Energy in Figures– Statistical Pocketbook,
Luxembourg.
European Union, 2012. Photovoltaic Geographical Information System (PVGIS)– Photovoltaic Solar Electricity Potential in European Countries. European Commission Joint Research Centre.
Fernandez-Jimenez, L.A., Mendoza-Villena, M., Zorzano-Santamaria, P., Garcia-Garrido, E., Lara-Santillan, P., Zorzano-Alba, E., Falces, A., 2015. Site selection for new PV power plants based on their observability. Renew. Energy 78, 7–15.
Fthenakis, V.M., 2000. End-of-life management and recycling of PV modules. Energy Policy 28, 1051–1058.
Gasparatos, A., Doll, C.N.H., Esteban, M., Ahmed, A., Olang, T.A., 2017. Renewable energy and biodiversity: implications for transitioning to a Green Economy. Renew. Sustain. Energy Rev. 70, 161–184.
Greene, W., 2012. Nlogit Econometric Software, Reference Guide. Econometric Software, Inc., Plainview, NY.
Grippo, M., Hayse, J.W., O’Connor, B.L., 2015. Solar energy development and aquatic ecosystems in the Southwestern United States: potential impacts, mitigation, and research needs. Environ. Manag. 55, 244–256.
Guerin, T., 2017a. A case study identifying and mitigating the environmental and community impacts from construction of a utility-scale solar photovoltaic power plant in eastern Australia. Sol. Energy 146, 94–104.
Guerin, T.F., 2017b. Evaluating expected and comparing with observed risks on a large-scale solar photovoltaic construction project: a case for reducing the regulatory burden. Renew. Sustain. Energy Rev. 74, 333–348.
Gunerhan, H., Hepbasli, A., Giresunlu, U., 2008. Environmental impacts from the solar energy systems. Energy Sources, Part A: Recovery, Util., Environ. Eff. 31, 131–138. Hanley, N., Mourato, S., Wright, R.E., 2001. Choice modelling approaches: a superior
alternative for environmental valuatioin? J. Econ. Surv. 15, 435–462. Hanley, N., Wright, R., Adamowicz, V., 1998. Using choice experiments to value the
environment. Environ. Resour. Econ. 11, 413–428.
Hernandez, R.R., Easter, S.B., Murphy-Mariscal, M.L., Maestre, F.T., Tavassoli, M., Allen, E.B., Barrows, C.W., Belnap, J., Ochoa-Hueso, R., Ravi, S., Allen, M.F., 2014. Environmental impacts of utility-scale solar energy. Renew. Sustain. Energy Rev. 29, 766–779.
Ho, C.K., 2013. Relieving a glaring problem. Sol. Today, 28–31.
Hole, A.R., 2007. A comparison of approaches to estimating confidence intervals for willingness to pay measures. Health Econ. 16, 827–840.
IEA, 2015. Solar Photovoltaic Energy. OECD Publishing.
Johnston, R.J., Boyle, K.J., Adamowicz, W., Bennett, J., Brouwer, R., Cameron, T.A., Hanemann, W.M., Hanley, N., Ryan, M., Scarpa, R., Tourangeau, R., Vossler, C.A., 2017. Contemporary guidance for stated preference studies. J. Assoc. Environ. Resour. Econ. 4, 319–405.
Katzner, T., Johnson, J.A., Evans, D.M., Garner, T.W.J., Gompper, M.E., Altwegg, R., Branch, T.A., Gordon, I.J., Pettorelli, N., 2013. Challenges and opportunities for animal conservation from renewable energy development. Anim. Conserv. 16, 367–369.
Lackner, K.S., Sachs, J., 2005. A robust strategy for sustainable energy. Brook. Pap. Econ. Act. 2005, 215–284.
Lakhani, R., Doluweera, G., Bergerson, J., 2014. Internalizing land use impacts for life cycle cost analysis of energy systems: a case of California's photovoltaic implementation. Appl. Energy 116, 253–259.
Lancaster, K.J., 1966. A new approach to consumer theory. J. Political Econ. 74, 132–157.
Louwen, A., Van Sark, W.G., Faaij, A.P., Schropp, R.E., 2016. Re-assessment of net energy production and greenhouse gas emissions avoidance after 40 years of photovoltaics development. Nat. Commun., 7.
Lovich, J.E., Ennen, J.R., 2011. Wildlife conservation and solar energy development in the desert Southwest, United States. Bioscience 61, 982–992.
Menegaki, A., 2008. Valuation for renewable energy: a comparative review. Renew. Sustain. Energy Rev. 12, 2422–2437.
Mérida-Rodríguez, M., Lobón-Martín, R., Perles-Roselló, M.-J., 2015. The production of solar photovoltaic power and its landscape dimension. In: Frolova, M., Prados, M.-J., Nadaï, A. (Eds.), Renewable Energies and European Landscapes: Lessons from Southern European Cases. Springer, Netherlands, Dordrecht, 255–277. Naspetti, S., Mandolesi, S., Zanoli, R., 2016. Using visual Q sorting to determine the
impact of photovoltaic applications on the landscape. Land Use Policy 57, 564–573. Neff, T.L., 1981. The Social Costs of Solar Energy: A Study of Photovoltaic Energy
Systems. Pergamon Press, MIT, Cambridge, MA.
Northrup, J.M., Wittemyer, G., 2013. Characterising the impacts of emerging energy development on wildlife, with an eye towards mitigation. Ecol. Lett. 16, 112–125. OECD, 2012. Energy - OECD Green Growth Studies. OECD Publishing.
OECD/ IEA, 1998. Benign energy? The environmental implications of renewables. Organisation for Economic Co-operation and Development and International Energy Agency.
OECD/ IEA, 2016. Energy Policies of IEA Countries: Portugal 2016 Revision. Pearce, D., Mourato, S., Atkinson, G., 2006. Cost Benefit Analysis and the Environment:
Recent Developments. Source OECD Environment and Sustainable Development. Pearce, D., Turner, R.K., 1990. Economics of Natural Resources and the Environment.
The John Hopkins University Press, Baltimore.
Perpiña Castillo, C., Batista e Silva, F., Lavalle, C., 2016. An assessment of the regional potential for solar power generation in EU-28. Energy Policy 88, 86–99. Portuguese Council of Ministers, 2013. Resolução do Conselho de Ministros n.° 20/2013,
Diário da República, 1ª série, N°70.
Ravi, S., Lobell, D.B., Field, C.B., 2014. Tradeoffs and synergies between biofuel production and large solar infrastructure in deserts. Environ. Sci. Technol. 48, 3021–3030.
Rose, T., Wollert, A., 2015. The dark side of photovoltaic– 3D simulation of glare assessing risk and discomfort. Environ. Impact Assess. Rev. 52, 24–30. Sacchelli, S., Garegnani, G., Geri, F., Grilli, G., Paletto, A., Zambelli, P., Ciolli, M.,
Vettorato, D., 2016. Trade-off between photovoltaic systems installation and agricultural practices on arable lands: an environmental and socio-economic impact analysis for Italy. Land Use Policy 56, 90–99.
Scognamiglio, A., 2016.‘Photovoltaic landscapes': design and assessment. A critical review for a new transdisciplinary design vision. Renew. Sustain. Energy Rev. 55, 629–661.
Srinivasan, S., 2009. The food v. fuel debate: a nuanced view of incentive structures. Renew. Energy 34, 950–954.
Sütterlin, B., Siegrist, M., 2017. Public acceptance of renewable energy technologies from an abstract versus concrete perspective and the positive imagery of solar power. Energy Policy 106, 356–366.
Torres-Sibille, Ad.C., Cloquell-Ballester, V.-A., Cloquell-Ballester, V.-A., Artacho Ramírez, M.Á., 2009. Aesthetic impact assessment of solar power plants: an objective and a subjective approach. Renew. Sustain. Energy Rev. 13, 986–999.
Tsoutsos, T., Frantzeskaki, N., Gekas, V., 2005. Environmental impacts from the solar energy technologies. Energy Policy 33, 289–296.
Turconi, R., Boldrin, A., Astrup, T., 2013. Life cycle assessment (LCA) of electricity generation technologies: overview, comparability and limitations. Renew. Sustain. Energy Rev. 28, 555–565.
Welsch, H., 2016. Electricity externalities, siting, and the energy mix: a survey. Int. Rev. Environ. Resour. Econ. 10, 57–94.
Whitehead, J., 2006. Apractitioner's primer on the contingent valuation method. In: Alberini, A., Kahn, J. (Eds.), Handbook on Contingent Valuation. Edward Elgar, Cheltenham, UK, 66–91.
Wiser, R., Millstein, D., Mai, T., Macknick, J., Carpenter, A., Cohen, S., Cole, W., Frew, B., Heath, G., 2016. The environmental and public health benefits of achieving high penetrations of solar energy in the United States. Energy 113, 472–486.