Áurea Raquel Pinto
Tiago
Abundância e diversidade de Poliquetas nos
canhões submarinos Portugueses
Dissertação apresentada à Universidade de Aveiro para cumprimento dos requisitos necessários à obtenção do grau de Mestre em Biologia Marinha, realizada sob a orientação científica da Dra. Marina Ribeiro da Cunha, Professora Auxiliar do Departamento de Biologia da Universidade de Aveiro
o júri
presidente Prof.ª Dr.ª Maria Ângela Sousa Dias Alves da Cunha professora auxiliar do Departamento de Biologia da Universidade de Aveiro
Prof.ª Dr.ª Maria Marina Pais Ribeiro da Cunha
Professora auxiliar do Departamento de Biologia da Universidade de Aveiro
Doutor Ricardo Jorge Guerra Calado
agradecimentos Não teria sido possível terminar esta tese sem a presença de várias pessoas, que me ajudaram, não só com todo o trabalho de laboratório, de escrita, e claro, com apoio incondicional nas horas mais complicadas. Acima de tudo gostaria de agradecer à Professora Marina Cunha, que apostou em mim neste projecto e me ajudou a desenvolver muito as minhas capacidades. Gostaria também de agradecer ao Dário Alves pela sua participação na colheita de amostras nos cruzeiros CD179 e 64PE252 e também pelo seu trabalho na triagem e identificação preliminares das amostras. Um agradecimento especial para Ascensão Ravara pela grande ajuda a separar e identificar as poliquetas, assim como a Gordon Paterson e Lenka Nealova pela simpatia com que me receberam no Museu de Historia Natural de Londres e a sua incansável ajuda em identificar os espécimes. Aos chefes de missão, equipa cientifica, capitão e tripulação dos cruzeiros RRS Discovery (NOCS) 297, RRS Charles Darwin (NOCS) 179 e RV Pelagia (NIOZ) 64PE252. A todos os colegas do LEME que me receberam tão bem e me fizeram sentir em casa logo no inicio. A todos os meus amigos em Coimbra, que apesar de longe, nunca estiveram distantes, principalmente o “núcleo duro”. À minha família, que aceitou as minhas decisões e me deixarem estudar o que quero, onde quero. Finalmente para quem aturou o meu mau humor nos últimos tempos, me partilhou com o computador e me apoiou mais que todos, sem nunca questionar as minhas decisões... obrigada por seres o meu porto seguro! Espero poder contar sempre com o teu apoio.
This research was partially supported by the HERMES project, EC contract no GOCE-CT-2005-511234, funded by the European Commission‟s Sixth Framework Programme under the priority „Sustainable Development, Global Change and Ecosystems‟.
resumo O trabalho foi realizado na costa Oeste da Margem Ibérica em três canhões submarinos Portugueses: Nazaré, Setubal e Cascais, a três profundidades: 1000m, 3400m e 4300m; e em duas zonas de talude continental, adjacentes aos canhões de Nazaré e Setubal, a 1000m de profundidade. São estudadas as comunidades de poliquetas com o objectivo de identificar diferenças entre as comunidades do talude continental e dos canhões submarinos, determinar a ocorrência de padrões de abundância, biomassa e diversidade relacionados com o gradiente de profundidade e interpretar essas diferenças em relação com as condições ambientais dos diferentes canhões.
No que se refere à estrutura vertical no sedimento, a macrofauna de uma forma geral apresenta um decréscimo de abundância e do número de espécies com o aumento da profundidade do sedimento. Apesar disso, a biomassa apresenta valores mais elevados a maior profundidade do sedimento.
De acordo com a abundância, biomassa, dominância e estrutura da comunidade os diferentes ambientes estudados (canhão e talude continental) apresentam diferenças significativas, mas também se detectou variabilidade entre as comunidades dos diferentes canhões e a diferentes profundidades. A 1000m, nos canhões e talude continental, a dominância é baixa e a equitabilidade elevada, mas a diversidade foi geralmente mais baixa no talude continental. A esta profundidade as comunidades apresentam elevadas abundâncias de carnívoros e omnívoros. A dominância foi mais elevada para todos os canhões a 3400m, apesar dos canhões de Nazaré e Setúbal apresentarem comunidades mais dominadas, principalmente pelos detritívoros de superfície e de sub-superfície. No que respeita à densidade de indivíduos, os canhões submarinos da Nazaré e Setúbal apresentam valores mais elevados, com valores máximos a profundidades intermédias, mas no caso da biomassa média individual, os valores mais elevados são encontrados no canhão de Cascais.
As variações na composição e estrutura das comunidades podem ser relacionadas com a origem e distribuição de carbono orgânico particulado que é interpretado como a principal fonte de alimento para as comunidades bentónicas dos canhões.
Concluindo, neste trabalho existem evidências de que as diferentes áreas analisadas, em relação às comunidades de poliquetas, apresentam padrões diferentes ao longo do gradiente de profundidade e nos três canhões, reforçando a idéia que os canhões são sistemas com caracteristicas únicas e comunidades particulares, diferindo de outros canhões
abstract The present work was undertaken in the West Iberian Margin, in three different canyons of the Portuguese coast: Nazaré, Setúbal and Cascais, at three different depths: 1000m, 3400m and 4300m; and in two open slope sites, adjacent to Nazaré and Setubal canyons, at 1000m. This work is focused on the study of polychaete assemblages and aimed to identify differences between open slope and canyon assemblages, to determine the occurrence of abundance, biomass and diversity patterns related to the depth gradient and to investigate differences possibly related to environmental conditions in different canyons.
Regarding the vertical structure of the sediment, macrofauna generally presented decreasing abundance and species richness with increasing depth of sediment layers. Despite this, biomass presented higher values at deeper sediment layers.
The two different deep-sea environments (canyon and open slope) showed significant differences, namely in their abundance, biomass, dominance and community structure. However, important differences between and within canyons were also identified. Both canyons and open slopes exhibited low dominance and high evenness, at 1000m, though diversity was generally lower in open slopes. At this depth, communities presented higher relative abundances of carnivorous and omnivorous. On the other hand, dominance was higher at 3400m for all canyons, with Nazaré and Setúbal showing more dominated communities than Cascais, mainly because of the great abundance of surface deposit feeders and sediment deposit feeders. Regarding density, Nazaré and Setúbal canyons presented higher values, with a maximum at intermediate depths, while mean individual biomass was greater in Cascais. Variability in species composition and community structure are related to the source and distribution of particulate organic carbon which is the major food source for the benthic assemblages in the studied canyons.
In conclusion, our results showed that the different areas analysed presented different patterns regarding polychaete assemblages, reinforcing the idea of canyons as individual systems with particular features and communities.
1.1 Deep-sea ...1 1.2 Submarine canyons ... 5 1.3 Polychaetes ... 7 1.4 Study context ... 9 2 Methodology ... 11 2.1 Study Area ... 11 2.2 Sampling Methodology ... 12 2.3 Data Analysis ... 15 2.3.1 Univariate Analysis ... 15 2.3.2 Multivariate Analysis ... 16 3 Results ... 17 3.1 Vertical distribution ... 19
3.2 Canyons and Open Slopes – Results from the 64PE252 Cruise ... 23
3.3 Variability Within and Between Canyons – Results from the CD179 Cruise ... 28
3.4 Variability Between Samplers and Between Depths – Results from the D297 Cruise ... 33
4 Discussion ... 37
4.1 Vertical distribution ... 37
4.2 Canyons and Open Slopes ... 37
4.3 Variability Within and Between Canyons ... 39
4.4 Variability Between Samplers and Between Depths ... 41
5 Conclusions ... 43
canyons... 13
Figure 2 – Total density (individuals.m-2) for all studied sites ... 18
Figure 3 − Total biomass (fresh weight/g) for all studied sites ... 18
Figure 4 – Mean individual biomass (MIB) (mg) for all studied sites ... 19
Figure 5 − Abundance values (individuals) with increasing sediment depth, for Nazare canyon (2005) (A), Nazare canyon (2006) (B), Setubal canyon (C), Cascais canyon (D) and adjacent open slopes (E) ... 20
Figure 6 − Mean individual biomass (MIB) (mg) with increasing sediment depth, for Nazare canyon (2005) (A), Nazare canyon (2006) (B), Setubal canyon (C), Cascais canyon (D) and adjacent open slopes (E ) ... 21
Figure 7 −Abundance (individuals) variation with increasing sediment depth. Representation for the most well represented families in the assemblage ... 22
Figure 8 − Mean individual biomass (MIB) (mg) variation with increasing sediment depth. Representation for some of the most well represented families in the assemblage ... 22
Figure 9 − Multidimensional scaling analysis subsequent Bray-Curtis coefficient between 64PE252cruise sampling sites. Abundance values were transformed with square root ... 25
Figure 10 − ABC curves for all 1000m depth sites. Solid lines indicate abundance and dashed lines biomass ... 26
Figure 11 − Pie charts for all 1000m depth sites with the relative percentage of the most represented families in all assemblage. A − OS South; B − OS Sines: C − Nazare; D − Setubal; E − Cascais ... 28
Figure 12 − Multidimensional scaling analysis subsequent Bray-Curtis coefficient between CD179 sampling sites. Abundance values were transformed with square root ... 29
Figure 13 − K-dominance curves for family rank from CD179 cruise sampling sites ... 30
Figure 14 − Pie charts for all CD179 cruise sites with the relative percentage of the most represented families in all assemblage ... 32
Figure 15 − Multidimensional scaling analysis subsequent Bray-Curtis coefficient between D297 sampling sites and Nazare samples from CD179 cruise. Abundance values were transformed with square root ... 33
Figure 16 − K-dominance curves for family rank in Nazare samples from D297 and CD179 cruises ... 34
Figure 17 − Pie charts for Nazare samples from D297 and CD179 cruises with the relative percentage of the most represented families in all assemblage ... 36
the sites analyzed in this study ... 14-15 Table II − Number of polychaetes families, density (individuals.m-2) and fresh weight biomass (gFW.m-2) for the sites analyzed in this study. NIOZ: circular boxcore; USNEL: boxcore; MC: multiple megacorer; n number of replicates in each sample ... 17 Table III − Vertical distribution of the number of families in all sites. Depth of sediment layers below surface in cm ... 19 Table IV − Abundance (A), relative abundance (%A), specie richness (S) and relative specie richness (%S) of families and lower taxa present in the study sites ... 23-24 Table V − Average species richness per site (S), Shannon equitability index (J’) and Shannon diversity index (H’) ... 25 Table VI − Six most abundant taxa identified at each 1000m sites ... 27 Table VII − The six taxa with higher biomass identified at each 1000m sites ... 27 Table VIII − Results of the ANOSIM global and pairwise tests, given by a two-way crossed analysis with depth (3400 and 4300m) and site (Nazare, Setubal and Cascais) factors, for the MDS performed for all CD179 sites ... 30 Table IX − Results of the SIMPER test between CD179 sites ... 31 Table X −Six most abundant polychaete families for the sampling sites of CD179 (expressed in percentage (%) of total abundance) ... 31 Table XI − The six polychaete families with more relative biomass for the canyons analyzed in the study (expressed in percentage (%) of total biomass) ... 32 Table XII − Results of the ANOSIM global tests, given by a two-way crossed analysis between depth (3400 and 4300m) and sampler (Box-core and megacorer) factors, for the MDS performed for all samples from cruise D297 and Nazare samples from cruise CD179 ... 34 Table XIII − Six most abundant polychaete families for Nazare canyon samples from CD179 and D297 cruises (expressed in percentage (%) of total abundance) ... 35 Table XIV − The six polychaete families with more relative biomass for the canyons analyzed in the study (expressed in percentage (%) of total biomass) ... 35
1 INTRODUCTION
1.1
D
EEP-
SEADeep-sea is the largest ecosystem on Earth covering 71% of the world’s surface and its habitats are also the largest reservoirs of biomass and non-renewable resources (Danovaro et al., 2008). Ecologically, the marine domain comprises four depth zones along a gradient where the geological, hydrological, physical, chemical and biological features are continuously changing, revealing well defined regions: the sublittoral or subtidal zone (low water to 200 m), the bathyal or archibenthal zone (from 200 to 2000 m), the abyssal zone (2000 to 6000m), and the hadal zone (more than 6000m) (Gage and Tyler, 1991). The deep-sea starts at the edge of the continental shelf (~200m depth), but in terms of hydrography it is usually considered to be that region below the permanent thermocline (Gage and Tyler, 1991).
Deep waters present a singular ecosystem with overwhelming water pressure, ice-cold temperature, and the absence of light. These extreme conditions influence the fauna and are associated with rich radiation of biodiversity in the deep sea (Gage, 2001). Temperature has very small variation, especially below the permanent thermocline, where the seabed temperature is less than 4ºC (Tyler, 1995). One of the most constant features of the deep-sea is salinity, which below 2000m is close to 34.8±0.3 psu (Gage and Tyler, 1991). Pressure may also influence deep-sea fauna, through sediment composition, as it affects the solubility of calcium carbonate, and thus the supply of calcareous material to the deep-sea (Tyler, 1995). Generally, the open areas of the bottom waters are oxygenated and true anoxic conditions do not prevail in the open ocean except at the immediate exit of hydrothermal vents where conditions are totally reducing (Tyler, 1995). Solar light, incident at surface, is not detected below 1000m, which affects primary production and its downward vertical flux to the deep-sea.
Owing to these primary production restrictions and except for chemosynthetic habitats the deep-sea ecosystem reflects the collective activities of animals in exploiting and recycling the inputs of material from the photic zone (Danovaro et al., 2008). The key processes in this ecosystem are benthic prokaryote production, total meiofaunal biomass and the rates at which organic matter is decomposed and recycled (Danovaro et al., 2008).
The nutritional value of the organic matter reaching the sea floor is most important for deep-sea benthic communities (Gage and Tyler, 1991). Excluding some exceptions, carbon source to deep-sea is allochthonous and comprises mostly particulate organic matter (Curdia, 2001), especially particulate organic carbon (POC), which can reach the deep-sea bed in various forms. Also suspension feeders can make organic matter available to benthic communities by actively capturing particles from the water column and depositing them in or at the sediment surface (Graf and Rosenberg, 1997).
The most common and universal food source to the deep-sea is detrital rain. Detritus include phyto and zooplankton remains from surface waters, and other materials such as gelatinous compounds (Curdia, 2001). These detritus may be colonized during the descent to deeper waters by foraminifers, nematodes, bacteria and flagellates, possibly increasing the organic matter amount in these detritus (Thiel et al., 1988-1989). This vertical flux of organic carbon can either represent a small proportion, or be responsible for most of the supply of material reaching the bathyal region (Lampitt et al., 1995). An additional supply would come from the shelf and upper slope where much higher flux levels and organic loads are encountered, being distributed by turbidity currents and slumps (Lampitt et al., 1995).
The decrease of POC flux from shelf depths to abyssal plain is well substantiated in the NW Atlantic (Rowe et al., 1991), but becomes more complicated on irregular slopes or where oxygen minimum zones intersect continental margin and seamounts (Reimers et al., 1992). Other productivity gradients are the decrease in seafloor POC flux from the productive coastal zone to the open ocean and the reduction in POC flux at the abyssal seafloor from the Pacific equatorial zone and its associated nutrient upwelling northward or southward into the oligotrophic central gyres (Levin et al., 2001).
For a long time the deep-sea was considered a constant environment and the prevailing idea was that detritus would reach the seabed in small amounts, at a relatively regular slow rate, with no seasonal change. Recently, indirect evidences were gathered, supporting seasonality in the deep-sea. Seasonal pulses of organic matter have also been related to increases in oxygen consumption, probably derived by observed increases in macrofauna density and biomass (Drazen et al., 1998), emphasising seasonal variation.
Life in the ocean is far more diverse than on land at the higher taxonomic levels, such as Phylum or Class, (Briggs, 1991; Gage, 1996). Of the 35 Phyla found in the sea, 22 are exclusively marine, with 11 endemic to the benthic environment and only 1 to the
pelagic (May, 1994). Despite this, species richness is considered to be higher on terrestrial habitats (Briggs, 1991). Therefore, marine systems, although rich in phyletic diversity, are relatively impoverished in numbers of species when compared to terrestrial ecosystems (May, 1994), even with the advantage for marine animals in terms of space (300 times more) and evolutionary time (400 million years more).
Subsequently to the first deep-sea discoveries in the middle of the 19th century, it was generally accepted that deep-sea fauna was impoverished, when compared to shallow water fauna, and that diversity would decline with increasing depth and offshore distance (Hessler and Sanders, 1967). During the second half of the 20th century, the number of registered marine species, approximately 300 000, represented 15% of total species on Earth, which was accepted by ecologists and taxonomists to be reasonably representative of the real number of species in the seas (Curdia, 2001). Grassle and Maciolek (1992) estimated that 10 million would be the number of species in deep-sea, but Briggs (1991) and May (1992) found this estimate oversized and May suggested that a more realistic estimate would be around 500 000 species.
Differences between abyssal and bathyal assemblages suggested variation in community composition along the depth gradient (Rex et al., 1997; Carney et al., 1983; Hecker, 1990), but the boundaries between deep-sea communities are far less distinct than between communities in shallow water (Grassle and Maciolek, 1992). Studies indicated that diversity-depth patterns in the deep-sea are unimodal with a peak at intermediate depths and depressed diversity at upper bathyal and abyssal depths, however unimodal patterns do not appear to be universal and where they occur have been attributed to varied environmental gradients (Levin et al., 2001). Some studies suggested that there are distinct latitudinal gradients, with diversity increasing towards the tropics (Rex et al., 1993), but recent studies questioned this gradient in both hemispheres, since Polar regions are less well-known, which might mean that their real diversity would be higher. Also benthic communities from the open ocean have been said to usually present higher diversity than those from inshore habitats (Levington, 1995).
In fact, patterns of diversity in the deep-sea are much more complicated than previously thought (Levin et al., 2001) depending on a variety of oceanographic and ecological conditions. The ecological factors determining species vertical ranges should be important in understanding the non-random distribution of species along the depth gradient (Pineda and Caswell, 1998). Diversity within regions may be seen as a composite
of overlapping species distributional ranges (MacArthur, 1972; Stevens, 1989). A stochastic placement of geographic ranges between boundaries will produce within the bounded region a unimodal pattern of diversity (Colwell and Hurtt, 1994) similar to bathymetric gradients found in the deep-sea.
Because the primary food resource in deep-sea is detritus, the nature of the sediments ought to play an important role in structuring deep-sea communities (Levin et al., 2001), and some data from NW Atlantic indicate high specie richness where grain size is more varied (Etter and Grassle, 1992). Within a functional group or taxon diversity increases from regions of low to moderate productivity, and then declines towards regions of higher productivity (Levin et al., 2001).
The variation of bottom-water oxygen concentration in deep-sea is also susceptive to influence diversity, since sediments having oxygen-depleted overlying bottom water typically exhibit reduced macrofaunal diversity, generally with high dominance and low species richness (Levin et al., 2001). Though, annelids seem to be less affected by low oxygen concentrations in bottom waters, and prevail in these environments (Levin and Gage, 1998).
Numerous areas of the ocean floor are subject to currents strong enough to erode and transport sediments and disturb soft-bottom communities (Heezen and Hollister, 1971) and the same may occur in canyons, where turbidity currents may be active (Jorissen et al., 1994). These agents of disturbance can modify the structure and composition of benthic faunas, but the critical factor may be sediment mobility (Levin et al., 2001). Observations suggest that currents can modify benthic diversity both locally and regionally, and the results can vary from promoting diversity to leading to low diversity by increasing dominance.
There are increasing evidences that deep-sea host a large proportion of undiscovered biodiversity on our planet (Danovaro et al., 2008). This fact, together with the increase of the economical and industrial exploitation of the deep-sea and the need to uncover the consequences of anthropogenic impacts increase the importance to improve our knowledge on marine biodiversity. When compared to terrestrial ecosystems, present knowledge of marine ecosystems is scarce, with only about 500m2 of deep-sea bottom analysed, mainly due to limited sampling from limited geographic areas (Rex et al., 1997). Although only approximately 0.0001% of the deep seafloor has so far been subject to biological investigation, the results are remarkable (UNEP, 2007).
Deep-sea studies concerning faunal composition are technically demanding and expensive, but much more sampling and also taxonomic investigation is needed, in order to sufficiently describe geographic diversity patterns before inferring on their causes (Rex et al., 1997). At present, deep-sea science programmes require sophisticated technology such as remotely operated vehicles, autonomous underwater vehicles, lander in situ instrumentation, but mostly they need integrated ecosystem approaches (Weaver et al., 2004).
1.2
S
UBMARINEC
ANYONSThe continental slope is an area of constant flux and change, strongly influenced by current flow, seabed character and sediment instability. Slopes are ideal systems for investigating benthic patterns, such as the decrease in abundance of life on the seafloor as depth increases. Still, at same depths across the slope, there is a considerable variability in the abundance and biomass of benthic fauna, becoming increasingly evident that we are not able to predict the spatial distribution of deep-sea benthic ecosystems.
Submarine canyons are deep incisions of the continental shelf and slope, and are thought to be hotspots of biodiversity in deep-sea. They are among the most spectacular features found along the slope, and occur along almost all oceanic margins. Deep-sea submarine canyons present one of the most formidable challenges to marine scientists today, and until now they have been largely ignored mainly because of the difficulties in exploring their complex terrain. They are complex systems in terms of their hydrography, sedimentology, biogeochemistry and biology, and it is increasingly obvious that there is great variability both within individual canyon systems and between different canyons. Individual canyons have very different environmental characteristics that determine the diversity and the ecology of their fauna, which makes it difficult to reach generalizations that could be used for this ecosystem management (Weaver et al., 2004).
In the upper parts of the canyons the steep sides are usually composed of rock. As depth increases they develop a very obvious V-shaped profile, and at the bottom of the V there are often strong currents, which held sediments in suspension. In the deeper parts of the canyon it broadens out and becomes more flat-bottomed. Here the seabed is mainly composed of sediment, although there can be rocky outcrops or isolated boulders
lying in the sediment. The outcome is a very heterogeneous seabed where very different groups of animals can live. In certain parts of the canyons the rock exposure forms overhangs, underneath which are found communities of filter-feeding organisms. The Portuguese Canyons, for instance, are known to host fragile benthic ecosystems such as cold-water corals (Arzola et al., 2007). Such spots are exceptionally biodiverse and contrasts with other parts of the canyon where biodiversity can be very low. Where the canyon finally meets the abyssal plain, organic-rich sediments accumulate, and benthic assemblages tend to have higher macrofaunal abundances than surrounding regions (Sorbe, 1999).
Though submarine canyons provide a protected environment for focusing tidal energy from shallow-marine estuaries to deep-marine canyons (Shanmugam, 2003), they are generally, unstable environments, related to morphology changes caused by turbidity currents (Thorne-Miller and Catena, 1991; Vetter and Dayton, 1998). Due to this, they may present distinct species assemblages, with high faunal and/or biomass densities, when compared to similar depths in non-canyon areas (Vetter and Dayton, 1998), but with a reduced number of species. Generally, submarine canyons present fewer species and their total abundance is dominated by a small number of species (Thorne-Miller and Catena, 1991).
Rapid, episodic flushing of canyons may mobilise large amounts of sediment carrying it to the abyss and overwhelming benthic ecosystems over a wide area. The frequency of these potentially catastrophic events and the fluxes of particles produced are largely unknown. Special adaptive strategies may be necessary for species to survive in unstable sedimentary environments such as these, which reduce canyons biodiversity. Motility would present some advantages for species in canyons, and, in fact, canyon species have been shown to have a greater motility than those of typical deep-sea assemblages (Rowe, 1972).
Some canyons are closely connected to major river outflow systems while others funnel large quantities of sediment from the continental shelf into deep water, playing an important role in the transport of sediments and organic matter from the shore to deep basins (Shepard, 1951, 1961; Heezen et al., 1955). This appears to affect the degree of activity of the canyon and the biogeochemical settings, which probably determines the fauna present.
In canyons, macrofaunal abundance and biomass is generally higher, than outside at equivalent depths, reflecting the fertilising influence of organic material on the canyon benthic communities (Sorbe, 1999). Particles transported along the submarine canyons may act locally as the major source of organic carbon to the benthos prevailing over the more common detritus rain from shallower waters (Vetter and Dayton, 1998). Besides, canyon consumers potentially experience enhanced food supply through several mechanisms: suspension feeders may benefit from accelerated currents (Rowe, 1971; Shepard et al., 1974), demersal planktivores may exploit dense layers of krill and zooplankton that become concentrated in canyons during downward vertical migrations and food for detritivores may be increased by high sedimentation rates in canyons not actively transporting sediment (Rowe et al., 1982) or through accumulation of macrophyte-detritus (Vetter, 1994; 1995). Canyons can support hotspots of secondary production (Vetter, 1994), therefore they are very interesting scientifically and probably economically (Curdia, 2001).
Mainly because of the difficulties of sampling the steep and rocky terrain of the canyons, the biological communities of the canyons are still poorly known. Canyons where chosen as a focus for HERMES (Hotspot Ecosystems Research on the Margins of European Seas) because they are key environments on the continental margin that are affected by dynamic geological and physical oceanographic processes. Canyons have a potentially important role on carbon transportation and burial, they are thought to be important habitats for fish and shrimp stocks and hotspots of high faunal biomass and thus more knowledge on benthic fauna distribution and abundance will be vital for our understanding of these ecosystems.
1.3
P
OLYCHAETESPolychaetes represent the most diverse group of annelids and are found in nearly every marine habitat worldwide, living in a wide range of habitats, from the intertidal to the depths of the ocean. Major differences of polychaete distribution can be expected to occur between regions, especially where habitats differ substantially, but also within the same region, species composition may vary annually. Few species occur in semi-terrestrial environments (supralittoral zone) and with a few exceptions, they are rarely found in
fresh water, which can be a very challenging habitat. Some tolerate lower salinities in the upper reaches of estuaries but many occur in their most saline zones. Polychaetes are often the dominant macrofaunal taxa in marine benthic assemblages with many families occurring in deep-sea habitats (Southward, 2000).. Though being a major component of benthos, both in terms of individuals and species, often most species are represented by few individuals. Because they are able to occupy all these diverse habitats it is not surprising that polychaetes form and size vary greatly.
There are pelagic polychaetes that swim or drift, but most are cryptic, living under rocks or burying themselves in sediment. These polychaetes may burrow into the surface layers from fine muds to coarse gravel. Some live naked, burrowing freely through the sediment, while others live in tubes, which can vary from semi-permanent mucus types to well-constructed firm tubes of fine sediment or sand grains (Southward, 2000).. Some form dense aggregations, whereas others are well segregated.
Mobile polychaetes tend to have well-developed eyes and other sensory appendages. Since tubiculous species are basically sessile, they can project their feeding appendages from the tube and either collect food from the surrounding surfaces or filter it directly from the water. These species are fairly immobile within the sediments, although it has been seen that deep-sea terebellids can “pick-up” their tubes and move (Southward, 2000). Continuous tube building may represent a form of locomotion in some tube building worms (Fauchald and Jumars, 1979). Tubiculous polychaetes seam to leave their tubes and settle elsewhere when disturbed. Even when not disturbed, some can leave the tube and swim. These polychaetes maintain their tubes and extend them as they grow.
Polychaetes feeding strategies include carnivory, herbivory and scavenging, as well as filter feeding and selective or non-selective deposit-feeding, however many species are probably highly opportunistic and can feed on a wide range of food (Fauchald and Jumars 1979). Several polychaetes species are commensal and members of few families are parasitic.
Polychaetes thrive in both clean and polluted environments, but species of
Capitella and some cirratulids are often regarded as indicators of organic pollution, so the
presence of particular species may be used to indicate that the environment is organically enriched. In these situations very few other macrobenthic organisms are present (Ward and Hutchings, 1996). Sediments with extremely high levels of heavy metals represent an
important stress factor, but some polychaetes manage to survive and almost exclusively colonize these environments. A major role in bioturbation and aeration of the sediment is performed by members of some polychate families (Kristensen, 1988).
1.4 S
TUDYC
ONTEXTIn the past few years HERMES has undertaken a number of cruises in the Mediterranean and west Iberian coast canyons to study the specialised canyon ecosystems, down-canyon sediment transport and deposition, and the way in which the canyon influences and is affected by local ocean circulation. Thanks to advances in technology these frontiers are opening up, giving new insights into canyon life and processes. It is expected that by understanding the relationship between structural biodiversity and ecosystem functioning it will be possible to identify the tools for the management and protection of deep-sea ecosystems.
The biological material for the present work was obtained during HERMES cruises carried out on the west Iberian margin. Samples were taken from Nazaré, Setúbal and Cascais canyons, and adjacent open slopes at several depths in order to acquire more knowledge of benthic diversity, abundance and biomass as a contribute to understanding the ecosystem functioning in these habitats.
The objectives of the present work relate only to the study of the polychaete assemblage and aim:
- To identify patterns of polychaete vertical distribution within the sediment - To identify putative differences between open slope and canyon assemblages - To determine the occurrence of abundance, biomass and diversity patterns
related to the depth gradient.
- To investigate differences possibly related to environmental conditions in different canyons.
2 METHODOLOGY
2.1
S
TUDYA
REANazaré, Setúbal and Cascais canyons
The west Iberian continental margin consists of a gently sloping, narrow shelf which is connected to the relatively steep continental slope (Weaver and Canals, 2003). This slope is incised by several submarine canyons, with highest density occurring in the central part of the margin. In this area, and oriented roughly perpendicular to the coast in an east-west direction, are located the Nazaré and Setúbal canyons, the two largest canyon systems of the west Iberian margin and Cascais Canyon, a smaller system.
The Nazaré canyon is one of Europe’s largest canyon systems, stretching more than 250km from the Portuguese coast into the Atlantic Ocean. Reaching depths of 5000m, this canyon leads into the Iberian Abyssal Plain. Nazaré Canyon lies between 39° and 40° N and is a relatively simple canyon system. Although the canyon head is almost in contact with the beach, it does not connect with a river, but still acts as a major conduit of sediment because it intersects the continental shelf almost completely and therefore captures all along-slope sediment transport. This appears to be the most active canyon today, in terms of sediment transport.
The Setúbal canyon (37º N) lies to the south of the Nazaré canyon and it’s a more complex system than the last, made by two distinct branches: the Lisbon and Setúbal canyons. Setúbal canyon extends seawards across the shelf from the mouth of the Tagus River, and continues downslope until it reaches the Tagus Abyssal Plain. Besides Tagus, Setúbal canyon is linked to other major fluvial source, the Sado River, contrasting with Nazaré canyon, which does not connect with any river.
The gross morphology of Setúbal canyon is similar to that of Nazaré canyon. In these canyons the upper and middle section (down to 4000m), narrow and V-shaped, are similar in morphology and sedimentary features (Arzola et al., 2007).
Sedimentary dynamics studies were made at both systems by HERMES project (Arzola et al., 2007). The results obtained may be very relevant since the data was collected simultaneously to the polychaetes assemblages (D297 and CD179). In her study Arzola concluded that turbidity currents are the dominant process of sediment transport, erosion and deposition in Nazaré and Setúbal canyons and that carbonaceous- and
mica-rich turbidity deposits settle mainly on the shallower intra-canyon terraces from suspended load fall-out. The source of terrigenous sediment was thought to be the shelf. High sedimentation rates were evident in upper Nazaré Canyon, compared with upper Setúbal Canyon. Both fine- and coarse-grained (gravel) sediment waves were present in the canyons, with the former on the canyon margin and the latter on the lower canyon floor of Nazaré and Setúbal Canyons.
Cascais canyon is less studied and information about its sedimentary or currents processes is scarcer. This canyon is just north to Setúbal canyon, and despite not directly connected to a river mouth, the organic matter input is thought to be mainly from Tagus River, though some quantities of sediment and associated materials may be transported from the continental shelf. This canyon appear to be composed of three smaller, straighter and more V-shaped channels lying adjacent to each other and leading into a flat depositional plain, that then continued as a single broader channel.
Open slope
Canyons play an important role in the transport of organic matter from the shelf to the abyssal plain. Due to this the areas of the slope adjacent to the canyon may offer better conditions and the fauna found would differ from open slope at same depth. Open slopes adjacent to Nazaré canyon (OS South) and to Setúbal canyon (OS Sines) suffer the influence of these canyons, mostly by the organic enrichment of the sediment.
2.2
S
AMPLINGM
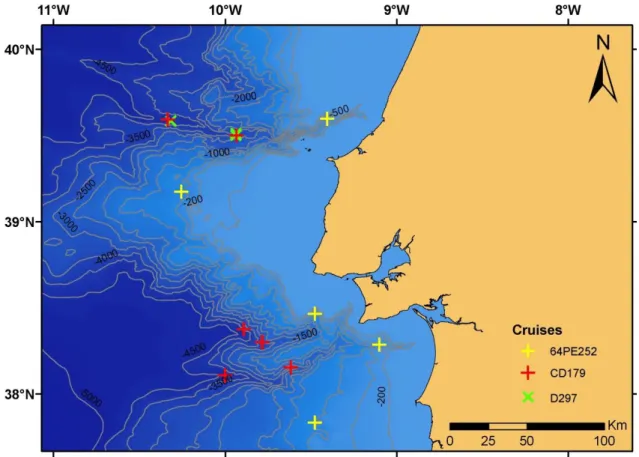
ETHODOLOGYUnder HERMES project, the Portuguese submarine canyons of Nazaré, Setúbal and Cascais and adjacent open slopes were sampled during the RRS Discovery (NOCS) cruise 297 (2005), RRS Charles Darwin (NOCS) cruise 179 (2006) and the RV Pelagia (NIOZ) cruise 64PE252 (2006) (Figure 1 and Table I).
During D297 only Nazaré canyon was sampled. Samples (three replicates each) were taken on the middle canyon terrace (ca. 3400m) and on the lower canyon floor adjacent to the thalweg (ca. 4300m) using a USNEL-pattern box corer (Area=0.25m2).
During CD179, samples were taken on Nazaré, Setúbal and Cascais canyons, using a UKORS Megacorer (multiple cylindrical cores of 0,00785m2 internal area). For all three sites, two depths (ca. 3400 and ca. 4300m) were sampled, and at each station 4 to 5
Figure 1 – Map of the study sampling sites, with bathymetric chart of Portuguese margin canyons. replicates were made. A total of 27 megacorers replicates were used for studying macrofauna diversity.
During 64PE252 the samples were taken at ca. 1000m at all three canyons and at the open slopes adjacent to Nazaré canyon (OS South) and to Setúbal canyon (OS Sines). These 5 stations were sampled with the NIOZ circular box corer (Area=0.196m2).
In all cruises the upper 20cm of the sediment samples were sliced whenever possible at 0-1, 1-3, 3-5, 5-10, 10-15 and 15-20cm following the standard techniques published by the Census of Marine Life workshop on the study of “Biodiversity of Deep-sea Sediments” and adopted as general practice in HERMES. In a number of sites just the upper 10cm were sampled. When the sediment >10cm depth was not sieved, it was examined carefully for larger fauna.
Table I – Sampling date, depth, area (m2) and geographic location (Latitude and Longitude) and the sites analyzed in this study (N – Nazaré; S – Setúbal; C – Cascais; OSO – OS South; OSI – OS Sines).
Sites Cruise Date Depth
(m)
Sampled
area (m2) Latitude Longitude Site
D15755#1 D297 8-Aug-05 3461 0.25 39° 30.62’N 09° 56.19’W N D15758#2 D297 9-Aug-05 4364 0.25 39° 35.02’N 10° 18.95’W N D15758#6 D297 10-Aug-05 4367 0.25 39° 34.99’N 10° 19.00’W N D15760#1 D297 10-Aug-05 3465 0.25 39° 30.02’N 09° 56.17’W N D15762#1 D297 11-Aug-05 3464 0.25 39° 30.02’N 09° 56.22’W N D15765#2 D297 11-Aug-05 4336 0.25 39° 35.00’N 10° 19.04’W N 56804#5 CD179 21-Apr-06 3275 0.063 38° 09.27’N 09° 36.93’W S 56804#6 CD179 21-Apr-06 3275 0.063 38° 09.26’N 09° 36.94’W S 56806#1 CD179 21-Apr-06 3275 0.063 38° 09.29’N 09° 36.96’W S 56810#1 CD179 23-Apr-06 3224 0.063 38° 09.22’N 09° 37.02’W S 56816#1 CD179 25-Apr-06 3275 0.063 38° 09.27’N 09° 36.94’W S 56821#1 CD179 26-Apr-06 3219 0.063 38° 17.96’N 09° 46.87’W C 56821#2 CD179 27-Apr-06 3214 0.063 38° 17.97’N 09° 46.89’W C 56823#2 CD179 27-Apr-06 3218 0.055 38° 18.01’N 09° 47.02’W C 56823#3 CD179 28-Apr-06 3219 0.055 38° 17.99’N 09° 47.07’W C 56828#1 CD179 29-Apr-06 3199 0.063 38° 18.02’N 09° 46.98’W C 56837#2 CD179 02-May-06 4245 0.063 38° 22.49’N 09° 53.40’W C 56837#5 CD179 02-May-06 4241 0.063 38° 22.50’N 09° 53.48’W C 56837#7 CD179 03-May-06 4243 0.063 38° 22.49’N 09° 53.52’W C 56837#8 CD179 03-May-06 4244 0.063 38° 22.49’N 09° 53.52’W C 56838#2 CD179 03-May-06 4482 0.063 38° 06.50’N 09° 59.98’W S 56838#3 CD179 04-May-06 4482 0.063 38° 06.49’N 09° 59.94’W S 56838#4 CD179 04-May-06 4485 0.055 38° 06.52’N 09° 59.99’W S 56842#1 CD179 05-May-06 4482 0.063 38° 06.45’N 09° 59.94’W S 56842#2 CD179 05-May-06 4485 0.063 38° 06.49’N 09° 59.97’W S 56851#1 CD179 09-May-06 3517 0.063 39° 29.99’N 09° 55.97’W N 56851#2 CD179 09-May-06 3517 0.063 39° 29.99’N 09° 56.01’W N 56856#1 CD179 11-May-06 3519 0.039 39° 29.95’N 09° 56.00’W N 56856#2 CD179 11-May-06 3522 0.055 39° 30.00’N 09° 55.98’W N 56847#6 CD179 08-May-06 4403 0.063 39° 35.57’N 10° 19.99’W N 56847#7 CD179 08-May-06 4404 0.055 39° 35.55’N 10° 20.06’W N 56859#1 CD179 12-May-06 4418 0.055 39° 35.58’N 10° 20.00’W N 56861#1 CD179 14-May-06 4404 0.047 39° 35.57’N 10° 20.02’W N
27BC1 64PE252 06-Set-06 1030 0.196 39° 10.36’N 10° 15.23’W OSO 27BC2 64PE252 06-Set-06 1030 0.196 39° 10.36’N 10° 15.23’W OSO
36BC2 64PE252 18-Set-06 935 0.196 38° 27.89’N 09° 28.51’W C
36BC3 64PE252 18-Set-06 1014 0.196 38° 27.86’N 09° 28.49’W C
36BC4 64PE252 18-Set-06 1020 0.196 38° 27.90’N 09° 28.50’W C
43BC1 64PE252 11-Set-06 897 0.196 39° 35.80’N 09° 24.25’W N
43BC3 64PE252 11-Set-06 897 0.196 39° 35.80’N 09° 24.24’W N
Sites Cruise Date Depth (m)
Sampled
area (m2) Latitude Longitude Site
56BC2 64PE252 16-Set-06 1001 0.196 37° 49.95’N 09° 28.49’W OSI 56BC3 64PE252 16-Set-06 1001 0.196 37° 49.98’N 09° 28.49’W OSI
61BC1 64PE252 17-Set-06 970 0.196 38° 17.10’N 09° 05.98’W S
61BC3 64PE252 17-Set-06 970 0.196 38° 17.10’N 09° 06.00’W S
The sediment layers 0-1 and 1-3cm where placed immediately in formalin, prior to sieving. Each sediment layer was carefully washed with seawater through 500μm and 300μm sieves, including the overlying water with the 0-1cm sample. The sieved material was fixed immediately in 10% buffered formalin in seawater, or in 96% ethanol (in the case of the cruise 64PE252). The material from the 500μm sieve was sorted under a stereo microscope and identified to family or, whenever possible, species level. Fresh weight of each family in each sediment layer was determined to the nearest 0.1mg.
2.3
D
ATAA
NALYSIS2.3.1 UNIVARIATE ANALYSIS
For each sampling site the abundance and families data was separated by layers, to analyze the vertical distribution within the sediment.
Shannon-Wiener diversity index (H’) and Pielou’s evenness index (J’) of each sample integrating all sediment layers was calculated using PRIMER v6. Shannon-Wiener diversity measure assumes that individuals are randomly sample from an “indefinitely large” population and that all species are represented in the sample (Magurran, 1988).
K-dominance curves consist of plotting the cumulative ranked abundances (y-axis) against species (x-axis) that are ordered by decreasing abundances, in a logarithmic scale (Lambshead et al. 1983). The shape and position of the curve allow the interpretation of community structure. Communities dominated by a small number of species have a high value of y-axis intersection point. Curves with a long “tail” indicate a large quantity of rare species in the community.
In ABC curves,dominance curves for abundance and biomass are plotted together on a cumulative scale (y-axis) against the ranked species in a logarithmic scale (x-axis) (Warwick and Clarke, 1993). The interpretation of these curves allow to infer on the dominant life style strategies in the assemblage.
2.3.2 MULTIVARIATE ANALYSIS
Data analysis was performed using the statistical package PRIMER v6. The abundance data were first organized into a sample/specie matrix. Non-metric MDS ordination was performed using the Bray-Curtis similarity measure, after square root transformation of the data. An analysis of similarities by permutation tests (ANOSIM) was performed on each MDS results. A SIMPER routine was carried out to assess the contribution of the different families to the dissimilarities between samples.
Because different sampling gears used in different cruises the data were analyzed according to the following objectives and test designs:
One-way ANOSIM was performed to assess the significance of differences between canyons and open slopes using the data (species level) obtained in two open slope sites and three canyon sites at ca. 1000m depth during 64PE252.
A two-way crossed layout ANOSIM was performed to assess the significance of differences between depths (3400m vs 4300m) and between canyons (Nazaré, Cascais and Setúbal) using the data (family level) obtained during CD179.
A two-way crossed layout ANOSIM was performed to assess dissimilarities between different samplers (boxcore vs megacore) and between different depths (3400m vs 4300m) using the data (family level) obtained for Nazaré canyon during D297 and CD179.
3 RESULTS
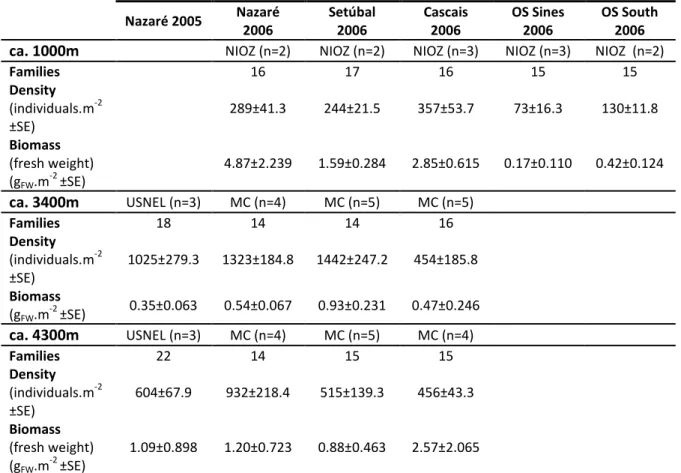
A total of 3096 individuals, within 31 polychaete families were identified in the material gathered from the west Iberian margin canyons and adjacent open slopes. The number of families on each assemblage varied usually from 14 to 17 with the highest values (18-22) recorded in the samples collected with the UNSEL boxcore (0.25m2) in Nazaré 2005 (Table II).The number of families, total density (individuals.m-2) and fresh weight biomass (gFW.m-2) in each study site are presented in Table II.
Table II – Number of polychaetes families, density (individuals.m-2
) and fresh weight biomass (gFW.m-2) for
the sites analyzed in this study. NIOZ: circular boxcore; USNEL: boxcore; MC: multiple megacorer; n: number of replicates in each sample.
Nazaré 2005 Nazaré 2006 Setúbal 2006 Cascais 2006 OS Sines 2006 OS South 2006 ca. 1000m NIOZ (n=2) NIOZ (n=2) NIOZ (n=3) NIOZ (n=3) NIOZ (n=2)
Families 16 17 16 15 15 Density (individuals.m-2 ±SE) 289±41.3 244±21.5 357±53.7 73±16.3 130±11.8 Biomass (fresh weight) (gFW.m-2 ±SE) 4.87±2.239 1.59±0.284 2.85±0.615 0.17±0.110 0.42±0.124 ca. 3400m USNEL (n=3) MC (n=4) MC (n=5) MC (n=5) Families 18 14 14 16 Density (individuals.m-2 ±SE) 1025±279.3 1323±184.8 1442±247.2 454±185.8 Biomass (gFW.m-2 ±SE) 0.35±0.063 0.54±0.067 0.93±0.231 0.47±0.246 ca. 4300m USNEL (n=3) MC (n=4) MC (n=5) MC (n=4) Families 22 14 15 15 Density (individuals.m-2 ±SE) 604±67.9 932±218.4 515±139.3 456±43.3 Biomass (fresh weight) (gFW.m-2 ±SE) 1.09±0.898 1.20±0.723 0.88±0.463 2.57±2.065
Polychaete density (Table II and Figure 2) was lowest in the open slopes (73-130 ind.m-2) at 1000m but increased up to ten fold inside the canyons especially at 3400m in Nazaré and Setúbal, (1323 and 1442 ind.m-2, respectively) owing to the massive abundance of Spionidae at these sites.
Total biomass (Table II and Figure 3) varied greatly between and within canyons but most sites showed biomass values below 1.5 gFW.m-2. The lowest and the highest values were recorded in the open slope (OS Sines: 0.17 gFW.m-2) at 1000m and in Nazaré (4.87 gFW.m-2) at 1000m. This value of high biomass in Nazaré is caused by the many Onuphidae, with large bodies, present here. The occurrence of many Maldanidae is the main responsible for high biomass in Setúbal at 1000m and Cascais at 1000m and 3400m.
When total biomass is averaged by the total density, the mean individual biomasses (MIB) are obtained (Figure 4) revealing that, in all canyons, the largest
0 200 400 600 800 1000 1200 1400 1600 1800 OS Sines OS South Nazare 2006
Setubal Cascais Nazare 2005
Nazare 2006
Setubal Cascais Nazare 2005 Nazare 2006 Setúbal Cascais 1000m 3400m 4300m D e n si ty (ind iv id u al s/m 2) 0 1 2 3 4 5 6 7 8 OS Sines OS South Nazare 2006
Setubal Cascais Nazare 2005
Nazare 2006
Setubal Cascais Nazare 2005 Nazare 2006 Setúbal Cascais 1000m 3400m 4300m Total b iom as s (f resh wei gh t) (g )
Figure 2 – Total density (individuals.m-2) for all studied sites.
individuals occur consistently in the shallower assemblages (1000m). At this depth they are also consistently higher inside the canyons than in the adjacent open slopes.
3.1
V
ERTICALD
ISTRIBUTION INS
EDIMENTThe general results concerning macrofaunal vertical distribution (species number and abundance variations with increasing sediment depth) are shown in Table III and Figures 5. With a few exceptions, the number of families is generally higher in the two or three upper layers (0-5 cm below surface).
Table III – Vertical distribution of the number of families in all sites. Depth of sediment layers below surface in cm. 1000m 3400m 4300m Layer 0-1 1-3 3-5 5-10 0-1 1-3 3-5 5-10 10-15 15-20 0-1 1-3 3-5 5-10 10-15 15-20 Nazaré 2005 9 13 11 9 9 3 11 11 11 14 5 3 Nazaré 2006 6 9 9 5 12 7 3 4 0 - 6 9 4 5 0 - Setúbal 9 9 9 9 7 5 5 8 0 - 12 11 8 8 0 - Cascais 11 11 11 5 7 8 7 4 0 - 10 10 8 5 0 - OS Sines 8 8 6 5 OS South 4 5 5 10 0 2 4 6 8 10 12 14 16 18 OS Sines OS South Nazare 2006
Setubal Cascais Nazare 2005
Nazare 2006
Setubal Cascais Nazare 2005 Nazaré 2006 Setúbal Cascais 1000m 3400m 4300m M e an B io m ass / m g
The abundance of faunal assemblages (Figure 5) in all sites is consistently higher at the two upper sediment layers (0-1 and 1-3cm below surface), exception for OS South where it increases with sediment depth.
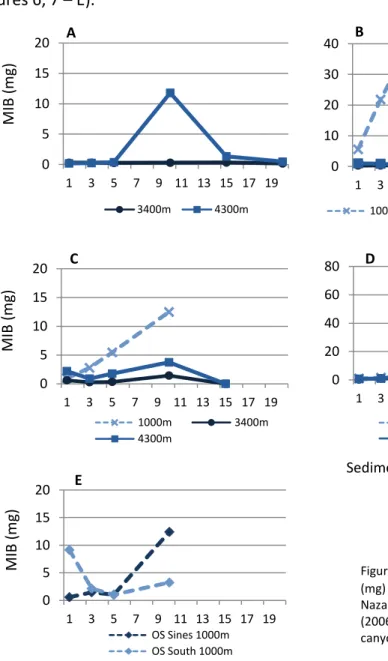
The mean individual biomass (MIB) (Figure 6) at 3400m and 4300m samples present low and constant values with increasing sediment depth, except for Nazaré 2005, at 3400m (Figure 6 – A). In canyons at 1000m there is a clear MIB increase with sediment depth, presenting higher values at 3-5 and 5-10cm below surface. At these sediment layers, the few individuals present larger bodies.
0 100 200 300 400 1 3 5 7 9 11 13 15 17 19 A 3400m 4300m 0 100 200 300 400 1 3 5 7 9 11 13 15 17 19 B 1000m 3400m 4300m 0 100 200 300 400 1 3 5 7 9 11 13 15 17 19 C 1000m 3400m 4300m 0 20 40 60 80 1 3 5 7 9 11 13 15 17 19 D 1000m 3400m 4300m 0 10 20 30 40 1 3 5 7 9 11 13 15 17 19 E OS Sines 1000m OS South 1000m
Figure 5 – Abundance values (individuals) with increasing sediment depth, for Nazaré canyon (2005) (A), Nazaré canyon (2006) (B), Setúbal canyon (C), Cascais canyon (D) and adjacent open slopes (E).
Ab u n d an ce (in d ividu als ) Ab u n d an ce (in d ividu als ) Ab u n d an ce (in d ividu als )
Sediment depth (cm bellow surface)
In open slopes there is an inverse relation between MIB and abundance, with low values of MIB where the abundance is greater and high values where abundance is low (Figures 6, 7 – E).
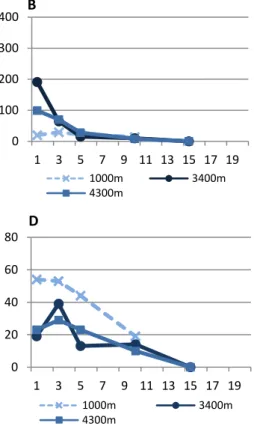
The analysis of the vertical distribution by family revealed that the some of the most abundant families such as the Spionidae, Ampharetidae, Fauveliopsidae and Hesionidae show a clear pattern of decreasing abundance with increasing depth of the sediments (Figure7 – A - B). In other families with lower abundances, the patterns of vertical distribution are not easily detected although some appear to peak at intermediate depth layers (Figure 7 – C - D).
0 5 10 15 20 1 3 5 7 9 11 13 15 17 19 A 3400m 4300m 0 10 20 30 40 1 3 5 7 9 11 13 15 17 19 B 1000m 3400m 4300m 0 5 10 15 20 1 3 5 7 9 11 13 15 17 19 C 1000m 3400m 4300m 0 20 40 60 80 1 3 5 7 9 11 13 15 17 19 D 1000m 3400m 4300m 0 5 10 15 20 1 3 5 7 9 11 13 15 17 19 E OS Sines 1000m OS South 1000m M IB (mg )
Sediment depth (cm bellow surface)
Sediment depth (cm bellow surface)
Figure 6 – Mean individual biomass (MIB) (mg) with increasing sediment depth, for Nazaré canyon (2005) (A), Nazaré canyon (2006) (B), Setúbal canyon (C), Cascais canyon (D) and adjacent open slopes (E).
M IB (mg ) M IB (mg )
0 5 10 15 20 1 3 5 7 9 11 13 15 17 19 Capitellidae Lumbrineridae 0 20 40 60 80 1 3 5 7 9 11 13 15 17 19 Opheliidae Paraonidae 0,0 0,2 0,4 0,6 0,8 1,0 1 3 5 7 9 11 13 15 17 19 Spionidae 0 2 4 6 8 10 1 3 5 7 9 11 13 15 17 19 Ampharetidae Fauveliopsidae Hesionidae 0 2 4 6 8 10 1 3 5 7 9 11 13 15 17 19 Opheliidae Paraonidae 0 2 4 6 8 10 1 3 5 7 9 11 13 15 17 19 Capitellidae Lumbrineridae 0 200 400 600 800 1 3 5 7 9 11 13 15 17 19 A Spionidae 0 20 40 60 80 1 3 5 7 9 11 13 15 17 19 B Ampharetidae Fauveliopsidae Hesionidae
In terms of body size (Figure 8), patterns vary with family, but usually larger individuals are more deeply burrowed in the sediment.
Figure 7 – Abundance (individuals) variation with increasing sediment depth. Representation for the most well represented families in the assemblage.
Sediment depth (cm bellow surface)
Ab u n d an ce (in d ividu als )
Sediment depth (cm bellow surface)
MIB
(
m
g)
Figure 8 – Mean individual biomass (MIB) (mg) variation with increasing sediment depth. Representation for some of the most well represented families in the assemblage.
Abund an ce (in d ividu als ) MIB ( m g) Ab u n d an ce (in d ividu als )
3.2
C
ANYONS ANDO
PENS
LOPES–
R
ESULTS FROM THE64PE252
C
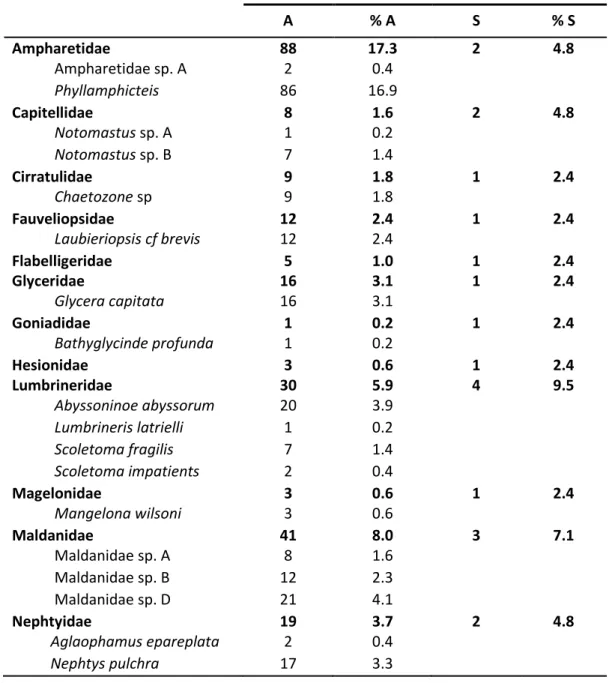
RUISEThe 508 polychaete specimens in the samples taken during the cruise 64PE252 at ca. 1000m in five different sites (three in the canyons and two in the open slopes) were sorted and identified into 42 species (Table IV). Ampharetidae, Spionidae and Onuphidae are the most abundant families and Spionidae is also the family with the highest number of species (5) followed by Lumbrineridae and Terebellidae (4 species each), and Phyllodocidae and Maldanidae (3 species each).
Table IV - Abundance (A), relative abundance (%A), specie richness (S) and relative specie richness (%S) of families and lower taxa present in all studied sites.
A % A S % S Ampharetidae 88 17.3 2 4.8 Ampharetidae sp. A 2 0.4 Phyllamphicteis 86 16.9 Capitellidae 8 1.6 2 4.8 Notomastus sp. A 1 0.2 Notomastus sp. B 7 1.4 Cirratulidae 9 1.8 1 2.4 Chaetozone sp 9 1.8 Fauveliopsidae 12 2.4 1 2.4 Laubieriopsis cf brevis 12 2.4 Flabelligeridae 5 1.0 1 2.4 Glyceridae 16 3.1 1 2.4 Glycera capitata 16 3.1 Goniadidae 1 0.2 1 2.4 Bathyglycinde profunda 1 0.2 Hesionidae 3 0.6 1 2.4 Lumbrineridae 30 5.9 4 9.5 Abyssoninoe abyssorum 20 3.9 Lumbrineris latrielli 1 0.2 Scoletoma fragilis 7 1.4 Scoletoma impatients 2 0.4 Magelonidae 3 0.6 1 2.4 Mangelona wilsoni 3 0.6 Maldanidae 41 8.0 3 7.1 Maldanidae sp. A 8 1.6 Maldanidae sp. B 12 2.3 Maldanidae sp. D 21 4.1 Nephtyidae 19 3.7 2 4.8 Aglaophamus epareplata 2 0.4 Nephtys pulchra 17 3.3
Nereidae 7 1.4 1 2.4 Ceratocephale loveni 7 1.4 Onuphidae 49 9.6 1 2.4 Paradiopatra hispanica 49 9.6 Opheliidae 13 2.5 2 4.8 Ophelina 2 0.4 Polyphhthalmus 11 2.1 Orbiniidae 4 0.8 1 2.4 Scoloplos cf arminger 4 0.8 Oweniidae 2 0.4 1 2.4 Galathowenia sp. 2 0.4 Paraonidae 30 5.9 2 4.8 Levinsenia sp. 23 4.5 Aricidea sp. 7 1.4 Phyllodocidae 6 1.2 3 7.1 Phyllodoce cf laminose 2 0.4 Phyllodoce cf maculata 3 0.6 cf Mystides 1 0.2 Sabelliadae 6 1.2 1 2.4 Sigalionidae 1 0.2 1 2.4 Spionidae 57 11.2 5 11.9 Laonice cf cirrata 2 0.4 Prionospio sandersi 45 8.8 Prionospio cf ehlersi 6 1.2 Spiophanes sp. 1 0.2 Spionidae sp. A 3 0.6 Terebellidae 17 3.3 4 9.5 Pista cf cirrata 3 0.6 cf Eupolymnia 1 0.2 Polycirrus cf latiens 12 2.3 Terebellidae sp. C 1 0.2 Not identified 83 16.3 Total 510 100 42 100
MULTIVARIATE ANALYSIS
The data collected during 64PE252 were subjected to multivariate analyses to assess differences between canyons and open slopes at 1000m. The MDS plot (Figure 9) shows a clear segregation of the replicates by sites. The proximity of the replicates from Cascais and Setúbal canyons indicates more similarity between their respective assemblages. Nazaré canyon appears closer to its adjacent open slope, OS South. OS Sines replicates show a wide dispersion.
Figure 9 – Multidimensional scaling analysis subsequent Bray-Curtis coefficient between 64PE252cruise sampling sites. Abundance values were transformed with square root.
The low number of replicates (2-3) impeded pairwise testing of differences between sites and instead, the replicates from the two open slope sites and from the three canyon sites were pooled together to compare the assemblages of these two types of environment. The one-way ANOSIM results (R= 0.403; p< 0.005) clearly supports the existence of significant differences between canyons and open slopes.
In fact, the density (D), biomass (B) and MIB values are always higher in the canyons (D: 244-357 ind.m-2; B: 1.59-4.87 g; MIB: 6.5-16.9 mg) than in open slopes (D: 73-130 ind.m-2; B: 0.17-0.42 g; MIB: 2.3-3.2). The average number of species per replicate (Table V) is also higher in the canyon sites but the trends in diversity and evenness are less obvious although they suggest that canyon assemblages are slightly more diverse but less even than the assemblages of the adjacent open slopes.
Table V – Average species richness per site (S), Shannon equitability index (J’) and Shannon diversity index (H’). SITE S J’ H’ (log e) Nazaré 14.5 0.8143 2.1775 Setúbal 18.0 0.9359 2.6915 Cascais 15.3 0.8178 2.2303 OS Sines 9.7 0.9513 2.1323 OS South 11.5 0.8918 2.1745
This is partially supported by the ABC curves (Figure 10): both abundance and biomass k-dominance curves for the OS South assemblage are below their correspondents for the Nazaré assemblage but the assemblages from OS Sines and Setúbal are practically coincident; Cascais is clearly the site with the highest dominance both in abundance and biomass.
In all sites abundance dominance is low and the biomass curve lies entirely above the abundance curve which is indicative of even communities characterized by the presence of species with relatively large body-sizes and stable trophic conditions. In Nazaré canyon and the adjacent open slope the first dominance rank both for abundance and biomass is a large-sized Onuphidae (carnivore and herbivore), Paradiopatra
hispanica. In Setúbal and Cascais the most abundant polychaete is the sediment selective
feeder Ampharetidae Phyllamphicteis sp. while the adjacent slope is dominated by the deposit feeder Cirratulid Chaetozone sp. but in all three sites the biomass is clearly dominated by non-selective deposit feeders Maldanidae species.
The most abundant taxa are generally distributed through almost all sites, while rare ones are usually at one or two sites. In Table VI are presented the six most abundant taxa at each site, where is clear that at this depth there is no clear dominance by one or two species. In table VII the same data for biomass is presented.
0% 20% 40% 60% 80% 100% 1 10 Nazare OS South Nazare OS South 0% 20% 40% 60% 80% 100% 1 10
Cascais Setubal OS Sines
Cascais Setubal OS Sines
Table VI – Six most abundant taxa identified at each 1000m sites.
Nazaré OS South
Paradiopatra hispanica 31.0% Paradiopatra hispanica 27.7%
Abyssoninoe abyssorum 15.5% Prionospio sandersi 14.9%
Prionospio sandersi 9.5% Phyllamphicteis sp. 6.4%
Scoletoma fragilis 8.3% Mangelona wilsoni 6.4%
Laubieriopsis cf brevis 6.0% Aricidea sp. 6.4%
Polycirrus cf latiens 6.0% Phyllodoce cf maculate 6.4%
Cascais Setúbal OS Sines
Phyllamphicteis sp. 33.0% Phyllamphicteis sp. 17.8% Chaetozone sp. 17.1%
Prionospio sandersi 10.7% Maldanidae sp D 7.8% Prionospio sandersi 9.8%
Levinsenia sp. 7.6% Glycera capitata 6.7% Maldanidae sp A 7.3%
Maldanidae sp. D 6.6% Maldanidae sp B 6.7% Maldanidae sp B 7.3%
Nephtys pulcra 6.1% Levinsenia sp. 5.6% Scoloplos cf arminger 7.3%
Paradiopatra hispanica 3.6% Prionospio sandersi 5.6% Phyllamphicteis sp. 4.9%
Table VII – The six taxa with higher biomass identified at each 1000m sites.
Nazaré OS South
Paradiopatra hispanica 51.4% Paradiopatra hispanica 33.1%
Sigalionidae 32.2% Notomastus sp. B 26.4%
Polycirrus latiens 10.3% Polycirrus latiens 13.5%
Prionospio sandersi 2.3% Phyllodoce cf maculate 8.8%
Pista cf cirrata 1.3% Phyllamphicteis sp. 5.1%
Terebellidae sp C 0.6% Galathowenia sp. 3.2%
Cascais Setúbal OS Sines
Maldanidae sp D 66.8% Maldanidae sp B 47.9% Maldanidae sp. D 51.2%
Phyllamphicteis sp. 13.5% Maldanidae sp D 11.0% Maldanidae sp A 11.4%
Paradiopatra hispanica 7.1% Paradiopatra hispanica 5.4% Spionidae sp A 6.5%
Nephtys pulchra 1.5% Ophelina sp. 5.2% Scoloplos cf arminger 4.7%
Maldanidae sp A 0.8% Polycirrus latiens 5.0% Notomastus sp. B 3.5%
Although the MDS results support important differences between open slopes and canyons a more detailed analysis of the faunal composition shows that important differences also occur between all individual samples. This is clearly illustrated not only by the results mentioned above but also by the pie-charts in Figure 11 showing the percentual contribution of each family in the different assemblages.
3.3
V
ARIABILITYW
ITHIN ANDB
ETWEENC
ANYONS–
R
ESULTS FROMCD
179
C
RUISEMULTIVARIATE ANALYSIS
The samples taken during the CD179 cruise allowed the analysis of the polychaete assemblage variability between and within canyons: three canyons (Nazaré, Cascais and Setúbal) and two depths (3400m and 4300m) were considered.
The multidimensional scaling (MDS) plot for these samples (Figure 12) shows Nazaré replicates segregated from Setúbal and Cascais along the horizontal axis and a further separation between replicates of different depths along a diagonal axis. At 3400m
10,9 % 6,5% 28,3 % 6,5% 15,2 % 7,1% 16,7 % 16,7 % 7,1% 14,3 % 23,5 % 30,6 % 10,6 % 9,4% 8,2% 8,7% 11,8 % 12,8 % 18,4 % 8,0% 18,4 % 6,9% 13,8 % A B C D E
Figure 11 – Pie charts for all 1000m depth sites with the relative percentage of the most represented families in all assemblage. A − OS South; B − OS Sines: C − Nazaré; D − Setúbal; E − Cascais.
Figure 12 – Multidimensional scaling analysis subsequent Bray-Curtis coefficient between CD179 sampling sites. Abundance values were transformed with square root.
Setúbal and Cascais replicates are clearly segregated but some overlap occurs with the replicates from 4300m.
The two-way crossed ANOSIM (Primer v6) results confirm the significance of differences between all depths and all canyons (site factor), with slightly higher R values for depth differences (Table VIII). Pairwise tests further support significant differences between all possible pairs of canyons. Results indicate that differences between Nazaré and the other two canyons are more important than the differences between Setúbal and Cascais.
In fact the three canyons are rather different and there is no common depth-related trend in density of the assemblages: density is higher at 3400m than at 4300m in Nazaré and Setúbal but shows no important difference between depths in Cascais. Biomass is higher at 4300m than at 3400m in all canyons. Subsequently the highest MIB occur in Cascais at 3400m and 4300m (see also Figures 2-4).