Survival of Probiotic Microbial Strains in a Cheese Matrix
During Ripening: Simulation of Rates of Salt Diffusion and
Microorganism Survival
Ana M. P. Gomes, Madalena M. Vieira & F. Xavier Malcata”
Escola Superior de Biotecnologia, Universidade Catblica Portuguesa, Rua Dr AntcinioBernardino de Almeida, 4200 Porte, Portugal (Received 7 April 1997; revised 13 April 1998)
ABSTRACT
The growth and survival hehaviours of Bifidobacterium lactis and Lactobacillus acidophilus in a semi-hard Gouda cheese at various axial locations during 9 wk of ripening at 13°C were assessed using non-linear regression analysis. The final average salt levels ranged in 2-4%(wlw). Viable numbers of both probiotic strains underwent a slow decline during the first 3 wk followed by a sharper decrease towards the end of ripening; such decrease was more substantial for the outer than for the inner cheese portions. Salt transport was successfully described by Fick’s second law of diffusion, and the cheese was considered as a finite slab for modelling purposes. Salt dijfusivity remained constant with time and was estimated to be 0.2 cm’iday. Theoretical salt concentration profiles were in good agreement with experimental data. The mathematical models postulated and fitted to the microbial viability data encompassed both a linear relationship between specific death rate and salt concentration and a constant death rate, following a methodology of increasing model complexity. Decision on the better model was taken based on a F-test of the ratio of incremental sum of squares of residuals to sum of squares of residuals of the more complex model, and it was concluded that viability of the probiotic strains was better described by a first order process independent of local salt concentration. Prediction of profiles of viable numbers of B. lactis and L. acidophilus in cheese with respect to both ripening time and axial location for several overall salt concentrations is useful in attempts to predict potential viability by the time of consumption.
All rights reserved
*To whom correspondence should be addressed. 281
282 A. A4. P Gomes et al. NOTATION
G
c
S.0e&-II
CX
C
X,0~,*.I-I,
D a&W LConcentration of salt in cheese matrix (% w/w)
Concentration of salt in cheese matrix in equilibrium with salt concentra- tion of brine (% w/w)
Cup-mixing concentration of salt in cheese between coordinates XT and Xr*r
Concentration of viable microorganisms at point x in cheese and time t (cfuk)
Average initial concentration of viable microorganisms in cheese matrix (cfujg)
Cup-mixing concentration of viable biomass in cheese between coordi- nates xf and x:r
Apparent diffusivity of salt in cheese matrix (cm’/day) Half-thickness of the cheese (cm)
Time elapsed after submersion of cheese in brine (days) Time period associated with brining (h)
Coordinate along the direction of diffusional flow (cm) Specific death rate constant (day-‘)
Death rate constant ((% w/w)/day-‘)
INTRODUCTION
Salting of curd is an important step in the manufacture of most cheese varieties. Salt plays several roles in cheese: (i) selective inhibition of growth of microorganisms (Irvine & Price, 1961; Turner & Thomas, 1980), ( ii control of activity of micro- ) organisms and enzymes therein or produced thereby (Fox & Walley, 1971; Thomas & Pearce, 1981; Godinho & Fox, 1982; Guinee & Fox, 1983; Stadhouders & Hup, 1975; Stadhouders et al., 1983), ( iii maintenance ) of conformation of certain sub- strates (Luyten, 1988), and (iv) direct contribution to the final flavour (Visser, 1977; Adda et al., 1982; Stadhouders et al., 1983; Kristoffersen, 1985). Hence, the overall concentration of salt or, preferably, the concentration of salt in moisture (Luna & Bressan, 1986, 1987) is a major factor that influences the final quality of cheese (Guinee & Fox, 1986, 1993). Uniformity in salt distribution is at least as important as average salt content if predictable ripening is to be achieved, i.e. if a stable environment for growth and maintenance of beneficial microorganisms is to be created (Irvine & Price, 1961; Roy, 1991).
During brine salting of a cheese, salt and moisture gradients develop from the surface to the centre of the cheese. Owing to the principles of molecular transport, a certain time is required for achievement of uniform profiles of salt concentration, or salt-to-moisture ratio, throughout cheese (Geurts et al., 1974; Guinee & Fox,
1986); such properties as water bound to the casein matrix, viscosity of the aqueous phase imbedding the protein/lipid matrix, and tortuosity and porosity of the cheese matrix contribute to the observed low values of apparent diffusivities of salt in
Salt diffusion and microorganism sunival in cheese 2X3
cheese. Salt diffusion processes during brining and ripening have been extensively studied for various types of cheeses (Geurts et al., 1974; Guinee & Fox, 1983; Luna
& Bressan, 1986; Turhan & Kaletunq, 1992). In these studies there is a general consensus that transport of salt from the outer brine into the aqueous solution accounting for the cheese continuum can be accurately modelled by Fick’s laws of diffusion, a rationale that precludes occurrence of chemical reactions within the cheese or convective mass transfer arising from strong brine stirring. Prediction of the salt concentration profile inside a given cheese is important because, in prin- ciple, the expected degree of survival of microorganisms in cheese hinges upon this parameter, especially if the cheese is used as a vector for such microorganisms in the human diet as happens with probiotic bacterial strains (e.g. bifidobacteria).
The use of bifidobacteria as dietary adjuncts can provide human beings with several healthy advantages (Mitsuoka, 1982, 1984; Rasic & Kurmann, 1983; Kim, 1988; Martin & Chou, 1992; Clark et al., 1993). Although dairy foods are good vehicles for bifidobacteria (Robinson, 1989) the use of this genus as constituent or supplement thereof cannot be justified unless viability and activity in this carrier food by the time of consumption can be ensured (Rasic & Kurmann, 1983). In the present case, where Bifidobacterium lactis and Lactobacillus acidophilus have been
deliberately introduced into a pasteurized semi-hard cheese as the sole starter in the sequence of previous work (Gomes et al., 1995), detailed studies on the quantitative
evolution of salt concentration and viable numbers of such mixed culture are urged and fully warranted in a time frame encompassing not only brining but also ripening in refrigerated chambers under controlled environmental conditions.
There are a limited number of studies available concerning the bifidobacterial response to salt (Vlaemynck & Delbeke, 1991) unlike what happens with respect to lactobacilli and other microorganisms (e.g. Irvine & Price, 1961; McClure et al., 1993; Zaika et al., 1994). It is therefore convenient to establish the effect of salt on growth and survival of bifidobacteria and L. acidophilus in order to predict their potential utilization in a cheese product after a given ripening time, which implies that studies designed to shed light into this issue should to advantage focus on the behaviour of probiotic strains in cheese itself. Mathematical modelling as a tool to describe growth of microorganisms in heterogeneous media has improved, and uses have increased considerably in recent years (Bratchell et al., 1989; Gould, 1989);
examples of models that describe the effects of food preservation techniques on bacterial growth and survival include (but are not limited to) the effect of sodium chloride on the rate and extent of growth of Clostridium botulinurn (Gibson et al., 1987), of salmonella (Gibson et al., 1988), of Listeria monocytogenes (Wijtzes et al., 1993; Guerzoni et al., 1994), of Brochothrix thermosphacta (McClure et al., 1993) and of Shigella jlexneri (Zaika et al., 1994).
This communication describes the responses of B. lactis and L. acidophilus in a semi-hard cheese in terms of maintenance of cell viability encompassing final aver- age salt levels of 2-4% during ripening for up to 9 wk at 13°C. Two nested models are postulated for the survival of the aforementioned probiotic strains, which differ in the relationship between salt concentration and specific death rate, coupled with Fick’s second law of diffusion as descriptor of salt transport within the cheese matrix; both models were successfully fitted to experimental data of viable biomass numbers and salt concentrations taken at various axial locations in the cheese throughout ripening time using nonlinear regression analysis.
284 A. M. l? Games et al.
MATERIALS AND METHODS
Starter cultures
Bifidobacterium lactis and Lactobacillus acidophilus strain Ki were purchased, in the form of starter concentrates, from CSK (Leeuwarden, The Netherlands).
Cheese making
Cheese was manufactured in two separate trials in the NIZO pilot plant (Ede, The Netherlands) using 200 1 of normal cheesemaking milk, pasteurized for 15 s at 72”C, per cheese vat. In each trial, three experimental lots of four cheeses (with average weight 5.63 kg, average diameter 20 cm and average height 10 cm) were manufac- tured sequentially in different vats on the same day and from the same milk following the basic protocol used to manufacture Gouda cheese, with some modifi- cations (Gomes et al., 1995). The three groups of experimental cheeses (hereafter denoted as BL cheeses) were inoculated simultaneously with B. lactis and L. acid-
ophilus starter concentrates at two percentage levels, viz. 7 and 3.5% for trials 1 and 2, respectively; all other initial compositional and processing conditions, except for brining time, remained equal among these BL cheeses. Brining conditions were slightly varied from experimental lot to experimental lot in order to cover the desired final salt-in-dry matter range of 2-4%(w/w) in each trial. After brining, the cheeses were covered with a layer of an emulsion of polyvinylacetate containing natamycin, and this procedure was repeated several times during ripening under controlled conditions of temperature (13°C) and relative humidity (87%) for up to 9 wk.
Cheese sampling
Initial samples were taken from the moulded cheese after pressing and before brining, and from the cheese after 1 day of ripening; regular samples were then taken on a weekly basis during the remainder of the ripening period. Another cheese, picked at random from each group of four cheeses, was used for bacterio- logical and chemical examination throughout 9 wk in order to follow the survival of both probiotic strains. Sampling for bacteriological assays was done under aseptic conditions by pushing a suitable sterilized borer, with a diameter of 3 cm, in the direction normal to the cheese upper surface. After removing the cylinder of cheese in question, the hole left was immediately filled with melted paraffin. All samples were taken at a distance of 5 cm from the cheese outer edge, leaving a 1.5 cm interval between adjacent sampling points. After discarding 2-3 mm of the outer surface or rind, each cylindrical sample was cut axially into 6 smaller cylinders, or circular slices, with the same height, and a portion of ca 5 g was taken from the outer, the middle and the inner circular slices. The remaining portions of each pair of circular slices symmetrically located relative to the centre were combined with one another and milled before chemical assays were performed.
Salt difjitsion and microorgunism sunival in cheese 35 _C. .
Bacteriological assays
All samples were homogenized with sterile 2% (w/v) aqueous trisodium citrate (Merck, Darmstadt, Germany) at 45°C using a 1:lO dilution ratio in a stomacher Lab-Blender 400 (Seward Medical, London, UK). Homogenized samples were deci- mally diluted in sterile peptone-saline solution consisting of 0.1% (w/v) peptone (Oxoid, Basingstoke, UK) and 035% (w/v) NaCl (Merck).
Enumeration of viable B. luctis was done using the spread plate technique on MRS-agar (Merck) plates; in order to enhance selectivity, the agar was previously added with 0.05% (w/v) cystein.HCl (Merck), 0.2% (w/v) lithium chloride (Merck), 0.3% (w/v) sodium propionate (BDH, UK), 0.2% (w/v) bile salts (Difco, Detroit MI, USA) and 5% (v/v) sheep blood (Gomes et al., 1995). Enumeration of L. acidophilus was done on TGV, i.e. tryptone, glucose and meat extract-agar prepared as detailed by Galesloot et al. (1961) and an extra 2% (w/v) NaCl. In both cases, 0.1 ml of adequate dilutions was spread over the plates which were then incubated in an anaerobic environment ensured via use of BBL Gas Pak (Becton Dickinson, Cock- eysville MA, USA) at 40°C for 48 h. The total number of L. acidophilus was determined based on morphology of the colonies on TGV-agar (B. luctis produces pinpoint-sized colonies, whereas L. ucidophilus produces large colonies). Selective growth of the (appropriate) bacteria on the different agar media was confirmed by microscopical examination of typical colonies.
Chemical assays
The pH of each sample was measured with a pH-meter using a combined pH electrode (Merck) which was inserted directly into the cheese. The moisture content was determined according to IDF (1958). The chloride content was determined according to IDF (1961) using cu 2 g of cheese and an automatic titrator (Metrohm, Germany). The fat content was determined using Gerber’s butyrometric determina- tion (Netherlands Standard NEN 3059). All analyses were done in duplicate.
MATHEMATICAL ANALYSIS
Order of magnitude analyses indicated that the time scale associated with diffusion in the radial direction within the flat-cylinder shaped cheese (i.e. 12/D - lo7 s, where I- lo-- ’ m is the radius of the cheese and D - lo- ’ m2/s is the diffusivity in a liquid phase) is small compared with the time scale associated with diffusion in the trans- verse direction (i.e. L”/D - 2.5~10~ s, where L - 5x10-’ m is the half-thickness of the cheese). Hence, the molecular transport of salt into and within the cheese flat cylinder can be assumed as an essentially unidirectional process and so the cheese can be treated as a slab. The mass balance to salt within the cheese matrix (which is assumed to behave as an isotropic medium) during the time period the cheese cylinder is submerged in the brine can be written as
286 A. M. II Gomes et al.
where C, is the concentration of salt in the cheese matrix, t is the time elapsed after having submerged the cheese in the brine, x is the coordinate along the direction of diffusional flow (x = 0 at the surface of the cheese circular slab) and Dap,s is the apparent diffusivity of salt in the cheese matrix when the cheese is submerged in the brine (i.e. the diffusivity of salt in the aqueous solution embedded in the cheese matrix corrected for the porosity and the tortuosity of said matrix). Equation (l.l), which is a form of Fick’s second law, is subject to the following boundary conditions:
c, = Cs,“, X = 0, 0 It I tb (1.2)
C,+O,x-+co,O~t~t, (1.3)
where eqn (1.2) arises from the (virtually constant) concentration of the brine and eqn (1.3) implicitly indicates the semi-infinite nature of the medium for the time scale associated with brining. Here & is the concentration of salt in the cheese matrix in equilibrium with the salt concentration of the brine and th is the time period associated with brining. Equation (1.1) is also subject to the following initial condition:
c,=o,x20, t=O (14)
which expresses the fact that the cheese is exempt from salt prior to brining. Solution of eqns (l.l)-(1.4) in the Laplace domain yields (Crank, 1975)
In a similar fashion, the mass balance to salt within the cheese matrix after the cheese has been removed from the brine can be written as
Equation (3.1) is subject to the following boundary conditions:
ac,
l 1
-
=o,
x=0, t>tbax t
ac,
( i
-
=O,x=L, t>tb ax t (3.2)(3.3)
where eqn (3.3) arises from the symmetry of the concentration profile due to the intrinsic symmetry of the cheese in the direction of molecular flux and eqn (3.2)
Salt diffusion and microorganism suwival in cheese 287
emphasizes the fact that the dried surface of the cheese is essentially impermeable to salt. Equation (3.1) is also subject to the following initial condition:
(3.4)
which indicates that the concentration profile at the time the cheese is removed from the brine must be consistent with eqn (2).
The solution of eqns (3.1)-(3.4) using the method of separation of variables has the form (Crank, 1990)
exp I-
qz
I dvldi’,which, in dimensionless form, reads c?: = c,” (x”,t”] = OlxlL, r>tt,
(4)
“i;
cos { n7Tx* ) KC’ ’ - ,,=I exp{ -#) dqd[* \71 n%c’(t* - 1) exp Pe I- ’ exp{ -#j dqd<* Olx*Il,t*>l (5.1)The dimensionless variables in eqn (5.1) are defined as follows:
(5.2)
p_
-5
th
288 A. M. P Gomes et al.
(5.4)
whereas the dimensionless (adjustable) parameter is given by L2
PtE ____
Dap,sh
(5.5)
Integration by parts applied to the integrating variables z* and x* in eqn (5.1) yields
2,‘s oc
---I5 c0s{12?Tx”} I
713/2 I,= I n2n2(t” - 1) i^ 0 sin(nz<*)exp( - y}dE*
n exp
Pt
ca=1+ { 1
l-$
s
A-- z 0* exp(-q2)dvl- &[exP{ - ?}-I)
o<x*<1,r*>1 (6) The cup-mixing concentration of salt contained in any slab-shaped portion of the cheese located between coordinates .x; and x;, (O<x; <x;, < l), i.e. ~~,,-,i, may then be evaluated by calculation of the integral average according to
2;E CL -c sin(n7rx~,> -sin (n7cx;“) 512 d5* n ,t= 1 n2(x1:: -xi+) exp n*n*(t* - 1) P4 If
exp {--‘ldt?- &(exp( - ?}-I)
Olx*Il,t*>l (7) This model will hereafter be denoted as Model A. With respect to survival of the microbiological strains of B. luctis and L. acidophilus, it will be assumed hereafter that (i) the rate of death follows a first order model on the biomass concentration (classically known as Maltus’ model) and that (ii) the specific death constant follows
Salt diffusion und microorganism suwival in cheese 289
a linear relation with respect to the concentration of salt. Stated in mathematical terms, the two assumptions lead to
- - =(Xg-X,Cs)Cxr OlXlL, r20
dt (8.1)
where C, is the concentration of viable microorganisms at point x and time t, and r,, and xl are constants. This model will hereafter be denoted as Model Al. Equation (8.1) is subject to the following boundary condition:
c, = CX.J,, 0 Ix I L. t = 0 (f3.2)
where CX,,, is the (uniform) concentration of viable microflora throughout the cheese matrix when the cheese is inserted in the brine. Integration of eqn (8.1) coupled with eqn (8.2) leads to
ii
I
C, = C, ( x.t ) = C,.oexp - (x,,--r,C\(x,wJ)dw
0 1 ((4
The dimensionless counterpart of eqn (9) reads
I
I’
C,*_C,*(x*,t*} =exp -r~f*+x~ C,* {x*.w*]dw* , OIx”ll,OIt*Il (10.1)
I 0 J
II
C,* = C,* { .P,t* } = exp
[-,,;*+:f[(l
C;“(.w*,oP] do” +i:
C,*(x”,lp 0OlX”l1, t*>
where the dimensionless variable is defined as
Jd$* .
ii
G
C,“E -
C x.0
and the dimensionless (adjustable) parameters are defined by
I (10.2)
(11.1)
(11.2)
(11.3) Combining eqns (2) (6) and (10.2) one obtains
290 -In{C~}=a~t*--cw: x A. M. I! Games et al.
I
j
p>x*l-1
2 t*-1+I
lexp{
-v.~d”-~~x*~~
exp{
-
$}d4*
\;n
0 E l-4 * s- exp(-q2Wrl- JR 0 -&-[erpj-T}-1) n27c2(t* - 1) 2Pt3’2 ;5 -x 7c 712 12s I P.4 n3s
1 X sin{ rut<* 0 JexpI
PLp - - 4I
d5*
\ ,-+s
2 L2
exp( -q21dtl- ;7c 0 $&pi - ?}-I) ,o<x*<,
t*2 1(12)
The cup-mixing concentration of viable biomass contained in any slab-shaped portion of the cheese located between coordinates xl* and x6 (0 <x;” <x:, < l), i.e. C$,l_ll, may then be evaluated by calculation of the integral average according to
where Cz is given by eqn (12). A survival model nested in Model Al will also be considered and will hereafter be denoted as Model A2. In this case, it will be assumed that (i) the rate of death follows a first order model on the biomass concentration and (ii) the specific death rate is independent of salt concentration. Stated in mathematical terms, these assumptions lead to
dG
- - = c$cx,
dt
OlxlL, t20
(14)
Salt diffusion and microorganism survival in cheese 291
Cx-CCx(x,t} =Cx,() exp
(l-5)
The dimensionless counterpart of eqn (15) reads
C$=C${x*,t*)=exp( -c&*), O<x*ll,t*>O (16) The cup-mixing concentration of viable biomass contained in any slab-shaped portion of the cheese located between coordinates .$ and xc, (O<xF <x8< I), i.e. C$ -iI, may then be evaluated by calculation of the integral average according to eqn (13) but where Ct is now given by eqn (16).
STATISTICAL ANALYSIS
Nonlinear regression of model A to the experimental data on transport of sodium chloride into the cheese, and of models Al and A2 to the experimental data on viable numbers of each probiotic strain, was made by unweighted least squares using the software package GREG (Caracotsios et al., 1985), at level 10. At this level, the
program performs nonlinear regression analysis of the data using as the objective function the sum of squares of standardized deviations of the observations with respect to the theoretical predictions; minimization is done via a modified Newton method starting with initial (given) estimates for the parameters; the regression package expands the objective function as a local quadratic, finds a solution for the feasible minimum of this quadratic expansion in terms of parameter values and implements a weak line search for a smaller value of the objective function.
Decision on which of models Al and A2 better fits the data was based on use of a likelihood ratio test (Bates & Watts, 1988); because of the spherical normal assumption, such test leads to an assessment of the extra sum of squares due to the extra parameters involved in going from the simpler, or partial model (model A2) to the more complex, or full model (model Al). This analysis is unaffected by param- eter effects nonlinearity; once performed, comparison of the F-ratio obtained with the standard F-ratio at a given level of significance (e.g. 5%) will indicate accept- ance or rejection of the partial model at said level of significance.
EXPERIMENTAL RESULTS
Average results of the physicochemical analyses throughout ripening for the various experimental cheeses are tabulated in Table 1. After 1 wk of ripening storage, R.
lactis was present at average levels of 3-4 x lo9 and 2 x lo9 cfu/g for cheese with 7
and 35% (w/w) inocula, respectively, whereas L. acidophifus was present at average levels of 4 x 10” and 25 x 10’ cfu/g, respectively. Throughout the 9 wk of ripening storage, L. acidophilus decreased by an average of two logarithmic cycles to 0.2-5 x 10’ cfu/g, especially from the 6th wk onward which accounted for ca 50% reduction in bacterial numbers; reduction by ca 90% in bacterial numbers was observed by the 9th wk in the highly salted cheeses (BL3). In contrast, B. luctis decreased in the same time frame by only one logarithmic cycle on average to 6-18 x 10’ cfu/g, especially during the 7th and 8th wk which were associated with reduction in bacterial numbers of cu 50%. In terms of the cheese sector analysis, the
292 A. M. P Gomes et al. TABLE 1
Results of Physicochemical Analyses of the Various Experimental Cheeses at 7 and 3.5 Days of Ripening
Component BLl2% N&l BL2 3% NaCl BL3 4% NaCl
Ww) Ww) (WIWJ
7 days 35 days 7 days 35 days 7 days 35 days
Moisture (%) 42.0 37.4 41.4 36.6 41.8 36.2
Moisture in nonfat dry matter (%) 59.5 56.8 58.8 55.4 59.3 55.2
Fat (%) 29.4 32.1 29.6 32.2 29.4 32.3
Fat in dry matter (%) 50.9 51.2 50.5 50.7 50.7 50.5
Salt in dry matter (%) 2.1 2.1 2.9 3.0 3.8 3.8
magnitude of the drop in viable cell counts of B. fuctis and L. acidophilus in the various BL cheeses varied with the initial average salt content of each cheese. Strain viability in the BL3 cheese (which corresponded to the highest concentration of salt tested) was considerably reduced in the outer rind region as soon as 4 wk of ripening storage had elapsed, and this effect was more notable for L. acidophilus than for B. la&is.
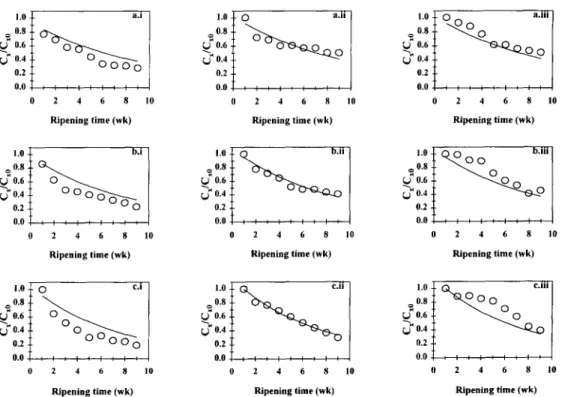
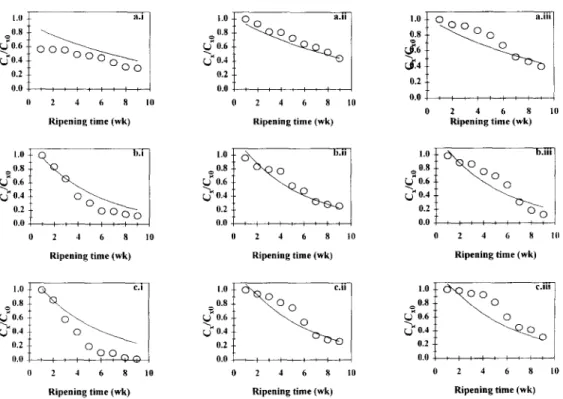
The data obtained for the concentration of salt in cheeses after brine salting versus ripening time and axial position are depicted in Fig. 1; the theoretical fits using the best estimates of parameters in Model A are overlaid on the experimental data in Fig. 1. It should be noted here that the statistical analyses were performed with the salt content expressed as percentage of moisture because this is a more logical way to measure the impact of salt upon performance of microorganisms that require an aqueous phase for their metabolism; however, the salt content was referred to dry matter in the global discussion because it is the most common way of expressing such quantity in the technical literature concerning cheesemaking. The estimates of the parameters obtained by nonlinear regression analysis to the experi- mental data (as provided by the post-convergence report generated by GREG) are tabulated in Table 2 for Models A, Al and A2. Table 3 summarizes the results of the extra residual sum of squares analyses between Models Al and A2. The data obtained for the viable numbers of B. factis and L. acidophilus in cheeses after brine salting are depicted in Figs 2 and 3 versus ripening time and axial position; the theoretical fits using the best estimates of parameters in Model Al are overlaid on the experimental data in Figs 2 and 3. (It should be noted that these theoretical fits do not extrapolate back to exactly 1 at zero time because C,,a is the mean count over all sections of the cheese at that time).
DISCUSSION
Sodium chloride diffused quickly into the outer layers of the cheese [as is apparent from inspection of Fig. l(a-c)]. After a period of increasing salt concentration in the outer layers, their salt concentration in all experimental cheeses decreased as a result of continued inward diffusion of salt towards the inner layers of the cheese, eventually reaching equilibrium throughout the whole cheese by 9 wk of ripening.
Salt diffusion and microorganism survil~al in cheese 293
The moisture content exhibited a reverse behaviour, i.e. it was lowest at the brining surface and increased steadily up to the centre of the cheese where it remained essentially unchanged with ripening time (results not shown); these observations agree with the generally accepted inverse relationship between salt and moisture levels in a cheese matrix (Guinee & Fox, 1993). Inspection of Table 2 reveals that the t-ratio (defined as the ratio of the parameter value to its confidence interval) associated with parameter D_ was in all cases well above unity. This observation, coupled with visual inspection of Fig. 1, leads one to the conclusion that there is no statistically apparent reason to doubt the postulated form of the model for transport of salt (i.e. model A). Furthermore, the estimates obtained via nonlinear regression for the apparent diffusivity of sodium chloride ranged from O-197 to 0.204 cm’iday, and so are similar to those reported by Geurts et al. (1974) pertaining to transport of salt within brine-salted cheeses; the time scale associated with such values for the apparent diffusivities is also consistent with data by Lee et al. (1980), who claimed that salt equilibrium was reached across 14 mm-thick slices of Mozzarella cheese by 7 days. Since salt diffusion in cheese is an impeded diffusion process, one might expect variations of Dap.\ with variations in cheese composition (in fact, the structure
0.0 t,. 0.0 t.,.,.,...i
0 2 .I 6 8 IO 0 2 4 6 8 IO Ripening time (wk) Ripening time (wk)
1.0 a.,, 1.0 b.11
0.8 0.8
0 2 4 6 8 IO
Ripening time wk)
0 2 4 6 8 IO 0 2 4 6 8 IO 0 2 4 6 H IO Ripening time (wk) Ripening time (wkl Ripening time (wk)
0 2 4 6 8 IO 0 2 4 6 8 10 0 2 4 6 8 IO Ripening time (wk) Ripening time (wk) Ripening time (wk)
Fig. 1. Plot of the normalized concentration of sodium chloride in the BL cheeses (CJC,,,,,,) brined for (a) 30 h (corresponding to 2%(w/w) salt in dry matter), (b) 58 h (corresponding to 3%(w/w) salt in dry matter) and (c) 87 h (corresponding to 4%(w/w) salt in dry matter), as a function of ripening time for the (i) outer slice, the (ii) middle slice and the (iii) inner slice. and theoretical tit of Model A (- ). Data plotted are average values of duplicate trials.
TABLE 2 Values of Parameters in Model A for Salt Content, and Models Al and A2 for Microbiological Numbers, and Corresponding Marginal Inference Intervals (MII), Fitted by Non-linear Regression to the Experimental Data as a Function of Ripening Time and Axial Distance Within the Cheese Predictor variable Model Parameter Units BLI 2% NaCl Ww) BL2 3% NaCl Ww) BL3 4% NaCl Ww) L1 tilue MII Value MZZ Value Salt content Bifidobacterium lactis Viable numbers A D ap,s Al Dap.s A2 $,,,. x0 Lactobacillus acidophilus Al z.,,. Viable numbers A2 :a,,.
cm2/day cm2/day day-’ cm2/day day-’ %/~w/w)
~
cm
/day
day-’ cm2/day day-’ %l(w/w)
- 0.201 0.0261 0.197 1.353 0.000000053 0.804 0.990 0.00190 0.981 1.349 0.00456 0.836 0.990 0.00118 0.981 ‘/day 0.000251 x 0.000396 1.338 0.332 0.566 0.990 0.00282 0.970 1.325 0.000431 0.565 0.990 0.00282 0.970 ‘/day 0.000245 z.z 0.000227 0.0277 0.000242 0.00376 0.000777 0.00243 0.10: 0.00438 0.00119 0.00298 00 0.204 0.440 0.965 0.446 0.966 0.000990 0.328 0.955 0.327 0.955 0.000604 4 MIZ
sz
0.0338 f.u 0.0846 s 0.00614 $ 0.000157 0.00402 2 0.08:3 .- 0.00952 0.00146 0.00637 coaD1
TABLE 3 % Extra Residual Sum of Square Analysis Pertaining to Models Al and A2 Used in Simulation of Survival of Bifidobacterium lactis 9 and Lactobacillus acidophilus Within a Cheese Matrix $. Microbial .sfmtn Source BLI 2% NuCl (WM.) EL2 34 ,vuCl (w/w) BL3 4% NuCl (w/w) 9 SS” np MSS F-ratio” SS l)f MSS F-ratio SS Df MSS F-ratio ; Bifidobacterium lactb a Extra parameters 0 1 0 0 0 1 0 0 0.0002 1 0.0002 0.0122 Model A2 (full) 0.5483 51 0.0108 p > .sn, 0.8470 51 0.0166 p > 5% 0.8348 51 0.0164 p > 5% 3 Model Al (partial) 0.5483 s2 0.8470 57 0.8350 52 Lactohacillus acidophilur c. Extra parameters 0 1 0 0 0.0001 1 0.0001 0.0063 0.0008 1 0.0008 0.0230 3 Model A2 (full) 1.3214 S1 0.0259 p > 5% 0.8123 51 0.0159 p > 5% 1.7771 51 0.0348 p> 5% f Model Al (partial) 1.3214 52 0.8124 52 1.7779 52 2’ “SS = sum of squares of residuals; hDf = number of degrees of freedom; ‘MSS = SS/Df: “F-ratio = (MSS associated with the extra parameters)/(MSS c n associated with the full model); p = probability that such high value of the F-ratio happens by pure chance. g 4296 A. M. P Games et al.
of cheese is dependent on its moisture, fat and protein contents) as well as brining conditions. As anticipated, the quantity of salt absorbed increases with brining time, whereas moisture content decreases and consequently fat content increases in the same time frame (see Table 1). Chemical examination of the cheeses of our experi- ment (see Table 1) indicates that compositional changes accompanying higher salt levels, especially large moisture loss, affected to some extent the penetration depth of salt after a given ripening time (see Fig. 1) as well as the estimate of Dap,s. This realization could hinge on the fact that salting and protein breakdown throughout ripening of cheese are concomitant with a considerable reduction in the amount of protein-bound water and a decrease in the mean diameter of the protein particles (Na ions likely affect the molecular structure of the protein network as extrapolated from their effect on the moisture sorption and hydrodynamic volume of casein micelles), which lead to increases in the average pore width of the protein network; the consequent increase in apparent diffusivities may be partly compensated for by the increase in resistance offered to Brownian motion per unit volume of cheese arising from desiccation.
Ripening time (wk) Ripening time (wk) Ripening time (wk)
0 2 4 6 8 10 0 2 4 6 8 10 0 2 4 6 8 10 Ripening time (wk) Ripening time (wk) Ripening time (wk)
$iik
<m
$gyyjgj
0 2 4 6 8 10 o 2 4 6 8 10 o 2 4 6 8 lo Ripening time (wk) Ripening time (wk) Ripening time (wk)
Fig. 2. Plot of the dimensionless concentration of Bifidobacterium lactis (CJC,,~) in the BL cheeses brined for (a) 30 h (corresponding to 2%(w/w) salt in dry matter), (b) 58 h (corre- sponding to 3%(w/w) salt in dry matter) and (c) 87 h (corresponding to 4%(w/w) salt in dry matter), as a function of ripening time for the (i) outer slice, the (ii) middle slice and the (iii) inner slice, and theoretical fit of Model Al (- ). Data plotted are average values of
Salt difjksion and microorganism survival in cheese 297
With respect to the simulation of probiotic strain survival in the presence of salt diffusion, the assumption of positive direct proportionality between the specific rate of death of the microorganisms and the concentration of salt is the simplest mathe- matical functionality that can be devised and is consistent with the following observations: (i) the rate of death of microorganisms in a given medium correlates negatively in an approximately linear fashion with the activity of water in that medium; and (ii) the activity of water in a cheese matrix correlates negatively in an approximately linear fashion with the concentration of salt (Marcos et al., 1981; Riiegg, 1985). However, not all parameters in the full model, viz. Da_, CI() and yl, could be estimated at the 5% level of significance, as indicated by the t-ratios below unity (see Table 2). Coupling this observation with results of the extra sum of squares analyses (see Table 3), one is led to the conclusion that the partial model (with the assumption that ‘xl = 0) is statistically more adequate than the full model for data pertaining to survival of B. luctis and L. acidophilus at the 5% significance level (i.e. the decrease in the residual sum of squares brought about by going from
0.0 t.... 0 2 4 6 8 IO Ripening time (wk) 0 2 4 6 8 IO Ripening time (wk) 0.0
Lt+-tw+J
0 2 4 6 8 10 Ripening time (wk) I.0 0.8 GO.6 2 0.4 0.2 0.0 0 2 4 6 8 IO 0 2 4 6 S 10 0 2 4 6 8 111 Ripening time (wk) Ripening time (wk) Ripening time (wk)$~~~
$F]
$igy-]
0 2 4 6 8 10 0 2 4 6 8 IO 0 2 4 6 8 IO Ripening time (wk) Ripening time (wk) Ripening time (wk)
Fig. 3. Plot of the dimensionless concentration of Lactohacillus acidophilus (C,/C,,,) in the BL cheeses brined for (a) 30 h (corresponding to 2%(w/w) salt in dry matter), (b) 58 h (corrc- sponding to 3%(w/w) salt in dry matter) and (c) 87 h (corresponding to 4%(w/w) salt in dry matter), as a function of ripening time for the (i) outer slice, the (ii) middle slice and the (iii) inner slice. and theoretical fit of Model Al (- ). Data plotted are average values of
298 A. M. I! Gomes et al.
the partial to the full model is statistically negligible at the 5% significance level when compared with the residual sum of squares associated with the full model). Observation of the theoretical curves associated with Model Al (see Figs 2 and 3) indicates that no biased trends of the model with respect to the experimental data are apparent, and this observation provides a strong clue that convergence to the true minimum in the residual sum of squares hypersurface was achieved. Predicted and observed values are in excellent agreement for the middle slice of the cheese [see Fig. 2 and Figs 3(a.ii), (b.ii) and (c.ii)]; however, a slower decrease of viable numbers and a sharper decline thereof are in general predicted for the outer [see Fig. 2 and Figs 3(a.i), (b.i) and (c.i)] and inner slices [see Fig. 2, Figs 3(a.iii), (b.iii) and (c.iii)], respectively. Viability was maintained longer in the former (lightly- salted) region of the cheese probably owing to the lower efflux of moisture and consequent higher water activity. Despite these discrepancies, one can conclude that the fits are reasonable for the colony forming units of both probiotic microbial strains, so such simple model allows one to approximately predict their survival in cheese. Inspection of Table 2 indicates that for Models Al and A2, despite the fact that the values estimated for the apparent diffusivity of sodium chloride are of the same order of magnitude as those previously found for Model A (when the trans- port of sodium chloride was studied independently from the growth of probiotic strains), a linear negative correlation was observed for Dap,s versus the average salt content of cheese (r = 0.986 and Y = 0.915 for data sets pertaining to B. lactis and L.
acidophifus, respectively), which may not be fully accounted for by a physicochemical
rationale but was rather the result of a purely statistical fit. The values for CQ, (viz. 0.9-1.0 dayy’) are within the range usually found in the literature (Guerzoni et al.,
1994; Little & Knochel, 1994); interestingly, this parameter increases with the increase of the average salt concentration within the cheese matrix and the linear negative effect is slightly more important for L. acidophilus (Y = 0.993) than for B.
luctis (r = 0.975). Sodium chloride is apparently responsible for a masked inhibitory effect upon survival of both B. lactis and L. acidophilus when only the results of regression analysis are considered; this observation agrees with the aforementioned fact that parameter CI~ (which consubstantiates a direct dependency of death rates on sodium chloride concentration) could not be fitted irrespective of the environ- mental conditions selected (see Table 2) probably because the experimental range was too narrow. Such claim is further confirmed by previous observations obtained in laboratory scale experiments where both probiotic strains were negatively affected by sodium chloride concentrations only if the latter values were well above 3%, viz. 6% NaCl (w/v) (Gomes et al., 1997) which are levels devoid of practical interest in cheesemaking practice.
CONCLUSIONS
From the experimental results generated, it was concluded that transport of sodium chloride within a semi-hard cheese matrix can be successfully modelled using Fick’s second law of diffusion under the assumption of unidirectional salt flux and slab geometry over a 9 wk ripening period; actual estimates of Dar_ were ca O-2 cm*/day; survival of B. lactis and L. acidophilus within the cheese during the same period decreased when storage time and/or salt concentration were increased. A model that considers the rate of microbial death directly proportional to the biomass concentra- tion and independent of the local salt content within the cheese matrix fits well the
Salt diffusion and microorganism survival in cheese 2YY
experimental data, with the proportionality constant a0 in the range of 0.9-1.0 day-‘. The model postulated and tested is useful in predicting sodium chloride concentration at any time within ripening and at any position within the cheese, as well as the evolution of the viable numbers of the two probiotic strains as related to the local and instantaneous salt content.
ACKNOWLEDGEMENTS
Financial support for author Gomes was provided by PhD fellowships by Junta National de Investigacao Cientifica e Tecnologica (Portugal), grants CIENCIA BD
1734-IF and PRAXIS XXI BD/3160/94. The authors are grateful to Dr Regina M. Nabais for her valuable assistance in the computational and statistical analyses.
REFERENCES
Adda, J., Gripon, J. C. & Vassal, L. (1982). The chemistry of ilavour and texture generation in cheese. Food Chemistry, 9, 115-129.
Bates, D. M. & Watts, D. G. (1988) Nonlinear Regression Analysis and its Applications. pp. 103-107. Wiley, New York.
Bratchell, N., Gibson, A. M., Truman, M., Kelly, T. M. & Roberts, T. A. (1989). Predicting microbial growth: the consequences of quantity of data. International Journal of Food Microbiology, 8, 47-58.
Caracotsios, M., Stewart, W. E. & Sorensen, J. P. (1985) GREG User’s Manual. Department of Chemical Engineering of the University of Wisconsin, Madison, USA.
Clark, P. A., Cotton, L. N. & Martin, J. H. (1993). Selection of bifidobacteria for use as dietary adjuncts in cultured dairy foods. II - Tolerance to simulated pH of human stomachs. Cultured Dairy Products Journal, 28, I I- 14.
Crank, J. (1975) The Mathematics of Diffusion, pp. 20-21, 62-63. Oxford University Press. Oxford, UK.
Fox, P. F. & Walley, B. F. (1971). Influence of sodium chloride on the proteolysis of casein by rennet and by pepsin. Journal of Dairy Research, 38, 165- 170.
Galesloot, T. E., Hassing, F. & Stadhouders, J. (1961). Agar media for the isolation and enumeration of aroma bacteria in starters. Netherlands Milk and Dairy Journal. 15, 127-150.
Geurts, T. J., Walstra, P. & Mulder, H. (1974). Transport of salt and water during salting of cheese. I. Analysis of the processes involved. Netherlands Milk and Dairy Journal. 28.
IO2- 129.
Gibson, A. M., Bratchell, N. & Roberts, T. A. (1987). The effect of sodium chloride and temperature on the rate and extent of growth of Clostridium botulinum type A in pas- teurized pork slurry. Journal of Applied Bacteriology, 62, 479-490.
Gibson, A. M., Bratchell, N. & Roberts, T. A. (1988). Predicting microbial growth: growth responses of salmonellae in a laboratory medium as affected by pH, sodium chloride and storage temperature. international Journal of Food Microbiology, 6, 155- 178.
Godinho, M. & Fox, P. F. (1982). Ripening of Blue cheese. Influence of salting rate on proteolysis. Milchwissenschaft, 31, 72-75.
Gomes, A. M. P., Malcata. F. X., Klaver, F. A. & Grande, H. J. (1995). Incorporation and survival of Bi’dobacterium sp. strain Bo and Lactobacillus acidophilus strain Ki in a cheese product. Netherlands Milk and Dairy Journal, 49, 71-95.
Gomes, A. M. P., Teixeira, M. G. M. & Malcata, F. X. (1997) Effect of sodium chloride concentration and storage temperature on the viability of Bifidobacterium lactis and Lacto-
300 A. M. P Gomes et al.
Gould, G. (1989). Predictive mathematical modelling of microbial growth and survival in foods. Food Science and Technology Today, 3, 80-92.
Guerzoni, M. E., Lanciotti, R., Torriani, S. & Dellaglio, F. (1994). Growth modelling of
Listeria monocytogenes and Ersinia enterocolitica in food model systems and dairy products.
International Journal of Food Microbiology, 24, 83-92.
Guinee, T. P. & Fox, P. F. (1983). Sodium chloride and moisture changes in Romano-type cheese during salting. Journal of Dairy Research, 50, 511-518.
Guinee, T. P. & Fox, P. F. (1986). Transport of sodium chloride and water in Roman0 cheese slices during brining. Food Chemistry, 19, 49-64.
Guinee, T. P. & Fox, P. F. (1993) Salt in cheese: physical, chemical and biological aspects. In
Cheese: Chemistry, Physics and Microbiology, Vol. I, ed. P. F. Fox, pp. 257-302. Elsevier,
London.
IDF (1958) Determination of Dy Matter in Cheese and Processed Cheese. Standard 4. Inter- national Dairy Federation, Brussels, Belgium.
IDF (1961) Determination of the Salt Content in Cheese. Standard 17. International Dairy Federation, Brussels, Belgium.
Irvine, D. M. & Price, W. V. (1961). Influence of salt on the development of acid by lactic starters in skim milk and in curd submerged in brine. Journal of Daiy Science, 44, 243-248. Kim, H. S. (1988). Characterization of lactobacilli and bifidobacteria as applied to dietary
adjuncts. Cultured Daily Products Journal, 23, 6-9.
Kristoffersen, T. (1985). Development of flavor in cheese. Milchwissenschaft, 40, 197-199.
Lee, H. J., Olson, N. F. & Lund, D. B. (1980). Diffusion of salt, fatty acids and esterases in Mozzarella cheese. Journal of Dairy Science, 63, 513-522.
Little, C. L. & Knochel, S. (1994). Growth and survival of Yersinia enterocolitica, Salmonella
and Bacillus cereus in Brie stored at 4, 8 and 20°C. International Journal of Food Micro-
biology, 24, 137-145.
Luna, J. A. & Bressan, J. A. (1986). Mass transfer during brining of Cuartirolo argentino cheese. Journal of Food Science, 51,829-831.
Luna, J. A. & Bressan, J. A. (1987). Mass transfer during ripening of Cuartirolo argentino cheese. Journal of Food Science, 52, 308-311,
Luyten, H. (1988) The rheological and fracture properties of Gouda cheese. PhD thesis, University of Wageningen, The Netherlands.
Marcos, A., Alcala, M., Leon, F., Fernindez-Salguero, J. & Esteban, M. A. (1981). Water activity and chemical composition of cheese. Journal of Daily Science, 64,622-626.
Martin, J. H. & Chou, K. M. (1992). Selection of bifidobacteria for use as dietary adjuncts in cultured dairy foods. I - Tolerance to pH of yoghurt. Cultured Daiy Products Journal, 27, 21-26.
McClure, P. J., Baranyi, J., Boogard, E., Kelly, T. M. & Roberts, T. A. (1993). A predictive model for the combined effect of pH, sodium chloride and storage temperature on the growth of Brochothrix thermosphacta. International Journal of Food Microbiology, 19,
161-178.
Mitsuoka, T. (1982). Recent trends in research on intestinal flora. Bifidobacteria Microflora,
1, 3-24.
Mitsuoka, T. (1984). Taxonomy and ecology of bifidobacteria. Bifidobacteria Microflora, 3,
11-28.
Rasic, R. L. & Kurmann, J. A. (1983) Bifidobacteria and Their Role. Birkhauser, Basel, Switzerland.
Robinson, R. K. (1989). Special yoghurts: the potential health benefits. Daily Zndusty Znter- national, 54, 23-24.
Roy, D. (1991). Salt stress on growth and acid production of Lactobacillus helveticus strain milano. Letters in Applied Microbiology, 12, 207-211.
Ruegg, M. (1985) Water in dairy products related to quality, with special reference to cheese. In Properties of Water in Food (in Relation to Quality and Stability), eds D. Simatos & J. L.
Salt dif/iision und microorganism survival in cheese 301
Multon, pp. 603-625. NATO Advanced Science Institute Series/Martinus Nijhoff Pub- lishers, Dordrecht, The Netherlands.
Stadhouders, J. & Hup, G. (1975). Factors affecting bitter flavour in Gouda cheese. Nether-
lands Milk and Dairy Journal, 29, 335-353.
Stadhouders, J., Hup, G., Exterkate, F. A. & Visser, S. (1983). Bitter flavour in cheese. I. Mechanism of the formation of the bitter flavour defect in cheese. Netherlands Milk and Dairy Journal, 37, 157- 167.
Thomas, T. D. & Pearce, K. N. (1981). Influence of salt on lactose fermentation and proteolysis in cheddar cheese. New Zealand Journal of Duity Science and Technoloa, 16. 2.53-259.
Turhan, M. & KaletunE, G. (1992). Modelling of salt diffusion in White cheese during long- term brining. Journal of Food Science, 57, 1082-1085.
Turner, K. W. & Thomas, D. T. (1980). Lactose fermentation in Cheddar cheese and the effect of salt. New Zealand Journal of Dairy Science and Technology, 15, 265-276.
Visser, F. M. W. (1977). Contribution of enzymes from rennet, starter bacteria and milk to proteolysis and flavour development in Gouda cheese. 2. Development of bitterness and cheese flavour. Netherlands Milk and Dairy Journal, 31, 188-209.
Vlaemynck, G. & Delbeke, R. (1991) Kwaliteitsverbetering vun halfzachte kazen door her
gebruik IBan specifieke culruren en van halfzachte vetarme kuzen door het aanwenden van
hijzondere hulpstoffen. Eindrapport, Rijkszuivelstation, Melle, Belgium.
Wijtzes, T., McClure, P. J., Zwietering, M. H. & Roberts, T. A. (1993). Modelling bacterial growth of Listetia monocytogetzes as a function of water activity, pH and temperature.
International Journal of Food Microbiology, 18, 139- 149.
Zaika. L. L., Moulden, E., Weimer, L., Philips, J. G. Xr Buchanan, R. L. (1994). Model for the combined effects of temperature, initial pH, sodium chloride and sodium nitrite concentrations on anaerobic growth of Shigella ,jlexneri. International Journal qf Food Micro-