EVALUATION OF THE PREBIOTIC POTENTIAL OF CORIOLUS
VERSICOLOR – EFFECT UPON THE HUMAN GUT MICROBIOTA
by
Célia Maria da Silva Freitas Costa
EVALUATION OF THE PREBIOTIC POTENTIAL OF CORIOLUS
VERSICOLOR – EFFECT UPON THE HUMAN GUT MICROBIOTA
Thesis presented to Escola Superior de Biotecnologia of the Universidade Católica Portuguesa to fulfill the requirements of Master in Science degree in Applied Microbiology
by
Célia Maria da Silva Freitas Costa
Place: CBQF/Escola Superior de Biotecnologia da Universidade Católica Portuguesa Supervision: Professor Maria Manuela Estevez Pintado
III
In loving memory of my grandparents,
Domingos José da Costa Maria Augusta Ferreira de Lemos
Maria Armanda Vieira da Silva Rui António Morais de Freitas
You may write me down in history, with your bitter, twisted lies; You may trod me in
the very dirt. But still, like dust, I'll rise.
V
Resumo
A microbiota intestinal humana tem-se tornado progressivamente mais relevante no estudo da saúde humana e de certas doenças, devido à sua ligação com o sistema imunitário e com o metabolismo humano. Um modo de modelar a microbiota intestinal é através da ingestão de prebióticos, que podem ser fermentados por bactérias benéficas presentes no cólon, resultando na produção de certos metabolitos considerados benignos, tais como os ácidos gordos de cadeia curta. O Coriolus versicolor é um cogumelo que, embora seja conhecido pelas suas propriedades imunomoduladoras e anticarcinogénicas, também foi anteriormente associado a uma potencial atividade prebiótica. No entanto, os estudos publicados focam se nas potencialidades dos extratos de C. versicolor, enquanto as propriedades da biomassa permanecem pouco estudadas. Assim, o principal objetivo do presente trabalho foi a avaliação do potencial prebiótico de um suplemento comercial de biomassa de C. versicolor, utilizando um modelo fecal in vitro. A fim de atingir o objetivo proposto, a biomassa foi primeiramente submetida a uma simulação do processo digestivo, após a qual esta foi utilizada para realizar fermentações usando fezes de cinco dadores distintos. Durante a fermentação foram recolhidas amostras às 0, 12, 24, e 48 h para realizar medições dos valores de pH e de as caracterizar relativamente à produção de ácidos orgânicos, particularmente, os ácidos gordos de cadeia curta (através de HPLC) e ao seu perfil microbiano (através de qPCR).
Apesar da variabilidade intrínseca associada à microbiota intestinal humana entre indivíduos, a presença da biomassa de C. versicolor resultou num aumento do número de cópias do gene 16S rRNA de Bifidobacterium para todos os dadores, em comparação com o controlo negativo, ainda que o aumento global tenha sido inferior ao do controlo positivo (FOS). Este comportamento foi observado após 24 h (controlo negativo- 0,203 ± 0,017; controlo positivo- 0,282 ± 0,011; C. versicolor- 0,238 ± 0,008, expresso como log do número de cópias de 16S rRNA por ng de ADN) e após 48 h (controlo negativo- 0,212 ± 0,016; controlo positivo – 0,301 ± 0,027; C. versicolor- 0,268 ± 0,011, expresso como log do número de cópias de 16S rRNA por ng de ADN), mas não foram encontradas diferenças significativas entre as condições testadas após 12 h de incubação. Relativamente a outros grupos bacterianos (Firmicutes, Bacteroidetes, Bacteroides, Clostridium leptum e Lactobacillus), não foi possível estabelecer uma tendência geral, mas apenas comportamentos específicos de cada dador. De um modo geral, quer o C. versicolor quer o FOS, resultaram numa diminuição dos valores de pH, por oposição ao controlo negativo, o que confirmou a produção de ácidos, como consequência do metabolismo bacteriano. No que se refere à quantificação dos ácidos gordos de cadeia curta e do ácido láctico, no fim da fermentação, a biomassa de C. versicolor levou à produção de ácido acético (0,212 ± 0,088 mg mL-1), seguida de ácido láctico (0,032 ± 0,002 mg mL-1), e do ácido propiónico (0,018 ± 0,007
mg mL-1). Em suma, é possível concluir que a biomassa de C. versciolor teve um efeito bifidogénico,
relevante na demonstração do seu potencial prebiótico.
VII
Abstract
The human gut microbiota has become increasingly relevant when considering human health and disease due to its connection with the immune system and human metabolism. One way of actively modulating the gut microbiota is through the ingestion of prebiotics, that can be fermented by beneficial members of the colonic population, resulting in the production of certain metabolites regarded as beneficial, such as Short Chain Fatty Acids (SCFA). Coriolus versicolor is a mushroom that, while known for its immunomodulatory and anticarcinogenic properties has also been previously described as possessing some prebiotic potential. However, most studies focus on the potentialities of C. versicolor extracts, leaving the properties of its biomass unstudied. Hence, the main goal of the present work was to evaluate the prebiotic potential in a commercial supplement of C. versicolor biomass using an in vitro faecal model. In order to achieve the proposed goal, the biomass was first submitted to a digestion simulation after which, it was used to perform human faecal fermentations using faeces from five distinct donors. Samples were collected at 0, 12, 24 and 48 h, for pH measurements and to be characterized regarding organic acid production, with emphasis on SCFA (through HPLC), as well as characterize the microbial profile (through qPCR).
Despite the intrinsic variability of the human gut microbiota between individuals, the presence of C. versicolor biomass consistently resulted in an increase in the number of Bifidobacterium’s 16S rRNA gene copies, for all donors when comparing to the negative control, although the overall increase was lower than the one registered for the positive control (i.e. FOS). This behaviour was observed after 24 h (negative control- 0.203 ± 0.017; positive control- 0.282 ± 0.011; C. versicolor- 0.238 ± 0.008, expressed in log of copy numbers of 16S rRNA per ng of DNA) and 48 h (negative control- 0.212 ± 0.016; positive control- 0.301 ± 0.027; C. versicolor- 0.268 ± 0.011, expressed in log of copy numbers of 16S rRNA per ng of DNA), but no significant differences were found between the assayed conditions after 12 h incubation. For the remaining bacterial groups characterized (Firmicutes, Bacteroidetes, Bacteroides, Clostridium leptum and Lactobacillus) it was not possible to observe a general trend but only donor specific behaviours. Overall, both C. versicolor and FOS resulted in a decrease of the pH values, in opposition to the negative control, which confirmed the production of acids as a result of bacterial metabolism. As for SCFA and lactic acid quantification, at the end of the fermentation, C. versicolor biomass led to the production of acetic acid (0.212 ± 0.088 mg mL-1), lactic acid (0.032 ±
0.002 mg mL-1) and propionic acid (0.0184 ± 0.007 mg mL-1). In sum, it is possible to conclude that C.
versicolor biomass had a bifidogenic effect and, therefore, could be interesting to its establishment as a prebiotic.
IX
Acknowledgements
First and foremost, I want to thank God for the precious gift of life, which I do not take for granted, and also the motherly intercession of Our Lady of Fátima, who guided me through this journey.
I wish to express my gratitude to the Catholic University, for giving me back the joy of learning and being a good student and for allowing me to attend this master’s degree. In addition, I want to thank Professora Doutora Manuela Pintado, for the opportunity to work and carry out this thesis, and for all the guidance provided. I also intend to thank Doutora Lígia Pimentel for the support and for always being there for me during this project. I would also like to thank Sara, for all the support provided and for the valuable advices during this journey.
I would like to thank Mycology Research Laboratories and ANEID, ltd. for the support provided during this work.
I also wish to express my deepest gratitude to my grandparents and my parents. Thank you for teaching me high moral values, such as honesty, perseverance and hard work, and, above all, strong work ethics, which I try to keep in mind every day. Thank you for understanding the value of education and therefore allowing me to study. I also intend to thank my brother, for all the older-brother love, for staying by me side, and cheering me up! To my boyfriend Luís: you were my rock! You were with me through the thick and thin, and I will be forever grateful for all your love, help, motivation and patience. Thank you for all those prep-talks at Sunday night. “Step by step, brick by brick” we keep growing together and building this wonderful life project together. I completely share this humble achievement with you.
Rita and Catarina Férias- my forever knitting club- thank you for being my sweet BFFs. Rita, thank for all those long talks, for your valuable professional advices, and boundless friendship. Catarina, thank you for always having a good joke to crack me up. I also wish to thank all my Chorus friends- thank you for giving me a safe space to be myself and literally to sing my problems out.
Roberta Melquíades, we were a sweet surprise in this journey. Thank you for your calm presence during this year. I need to thank you from the bottom of my heart for keeping me motivated and confident in my work and for making me feel like a valuable worker and for assuring me that I wasn’t crazy. I will keep close to my heart all the long talks we had.
To the lunch crew - Mariana, David, Margarida, Pedro, Bu, Eduardo and Sara - thank you for the best lunch times ever. Thank you for your help, humor and patience and for enduring all my anxiety. Mariana, thank you for reaching out to the outsiders, you are a good person and I will not forget your friendship. David, thank you for listening to all my diseases, even those which don’t exist. Maggy-cheese, thank you for your energy, and for being so helpful. Pedro, I will never forget our intense and laborious lab journey, at least we weren’t alone, and we were able to laugh a bit! Maria João, “Bu/wifey”, thank you for all the good moments and for restraining my excessive energy. Eduardo, thank you for all the jokes, (even the hard ones), for motivating me through my work and for all the help. Sara, thank you for above all, being such a sweet and funny friend and for “the rules” that kept me calm and focused.
XI
Table of contents
Resumo ... V Abstract ... VII Acknowledgements ... IX Figure Index ... XIII Table Index ... XV List of Abbreviations ... XVII
1. Introduction ...1
1.1. The gut microbiota ...1
1.1.1. Influencing factors and modulators of gut microbiota ...3
1.1.2. Microbiota metabolites and host interaction ...4
1.1.2.1. Short chain fatty acids ...4
1.1.3. Gut microbiota and health ...6
1.1.4. Methods for gut microbiota monitorization ...7
1.2. Prebiotics ...9
1.3. Mushrooms as functional ingredients ... 10
1.3.2. Coriolus versicolor ... 12
1.4. Work objectives ... 13
2. Materials and Methods ... 15
2.1. Sample information ... 15
2.2. In vitro digestion simulation ... 15
2.3. Protein quantification and characterization ... 16
2.4. Free amino acids analysis... 16
2.4.3. Mobile phase and reagent preparation ... 16
2.4.2 Chromatographic analysis ... 16
2.5. In vitro faecal fermentations ... 17
2.5.1. Collection and preparation of faecal inocula ... 17
2.5.2. Nutrient Base Medium preparation... 17
2.5.3 Faecal fermentations ... 17
XII
2.6. Bacterial population analysis ... 18
2.6.1. DNA extraction ... 18
2.6.2. Real Time Quantitative Polymerase Chain Reaction ... 18
2.7. Sugars and SCFA analysis ... 21
2.8. Statistical analysis ... 21
3. Results and Discussion ... 23
3.1. Simulation of the gastrointestinal tract conditions ... 23
3.2. Impact of Coriolus versicolor biomass on gut microbiota ... 27
3.2.1. Microbial population modulation... 27
3.1. Production of SCFA ... 43
4. Conclusions ... 49
5. Future Work ... 51
6. Appendixes ... 53
6.1. Appendix I- Informed consent form ... 53
6.2. Appendix II- Instructions for stool specimen collection ... 53
6.3. Appendix III- Bacterial calibration curves for qPCR... 56
6.4. Appendix IV- Real time PCR results and statistical analysis. ... 59
7. Annexes ... 65
7.1. Annex I- NZY tissue gDNA isolation kit ... 65
XIII
Figure Index
Figure 1.1. Phylogenetic tree of the human gut microbiota. The numbers in parentheses indicate the number of cultured species per phylum. Reprinted from Rajilić-Stojanović and de Vos (2014). ... 2 Figure 1.2. Relation between diet, gut and metabolism. Reprinted from (Flint et al., 2015). ... 4 Figure 1.3. Example of the metabolic pathways of acetate, butyrate and propionate produc tion. Reprinted from Flint et al. (2015) ... 5 Figure 1.4. Coriolus versicolor. Reprinted from Midwest Mycological Information. ... 12 Figure 3.1. FPLC profile of C. versicolor biomass throughout the digestion simulation. ― Initial sample;
― Mouth digestion; ― Stomach digestion; ― Intestinal digestion; ― After dialysis. ... 23 Figure 3.2. Overall variation of the distinct bacterial groups. (A) Negative Control; (B) Positive Control; (C) C. versicolor digested biomass. ■ Firmicutes; ■ Bacteroidetes; ■ Bacteroides; ■ C. leptum; ■ Lactobacillus; ■ Bifidobacterium ... 28 Figure 3.3. Variation of microbiota composition in donor A. Values presented as log 16S rRNA gene copies/ng of DNA through time, with standard deviation error bars. ●C-, negative control;
●C+, positive control; ●Cv, C. versicolor… ... 31 Figure 3.4. Variation of microbiota composition in donor B. Values presented as log 16S rRNA gene copies/ng of DNA through time, with standard deviation error bars. ●C-, negative control;
●C+, positive control; ●Cv, C. versicolor. ... 33 Figure 3.5. Variation of microbiota composition in donor C. Values presented as log 16S rRNA gene copies/ng of DNA through time, with standard deviation error bars. ●C-, negative control;
●C+, positive control; ●Cv, C. versicolor. ... 34 Figure 3.6. Variation of microbiota composition in donor D. Values presented as log 16S rRNA gene copies/ng of DNA through time, with standard deviation error bars. ●C-, negative control;
●C+, positive control; ●Cv, C. versicolor. ... 36 Figure 3.7. Variation of microbiota composition in donor E. Values presented as log 16S rRNA gene copies/ng of DNA through time, with standard deviation error bars. ●C-, negative control;
●C+, positive control; ●Cv, C. versicolor. ... 37 Figure 3.8. Example of the chromatogram obtained for a sample supplemented with C. versicolor digested biomass, after 24 h of fermentation. Each injection was carried out in duplicate. ... 43 Figure 3.9. Variation of the pH values during the fermentation process. Values measured at 0, 12, 24 and 48 h, in duplicate. C. versicolor digested biomass, Cv; negative control, C-; positive control, C+; ... 45
XIV
Figure 6.1. Calibration curve for Firmicutes population prepared using gDNA solutions from Lactobacillus gasseri. ... 56 Figure 6.2. Calibration curve for Bacteroidetes prepared using gDNA solutions from Bacteroides vulgatus. ... 56 Figure 6.3. Calibration curve for Bacteroides prepared using gDNA solutions from Bacteroides vulgatus. ... 57 Figure 6.4. Calibration curve for C. leptum subgroup prepared using gDNA solutions from C. leptum. ... 57 Figure 6.5. Calibration curve for Lactobacillus subgroup prepared using gDNA solutions from Lactobacillus gasseri. ... 58 Figure 6.6. Calibration curve for Bifidobacterium prepared using gDNA solutions from Bifidobacterium longum subs Infantis. ... 58
XV
Table Index
Table 1.1. Main functions of the gut microbiota. Adapted from Quigley (2013). ... 3 Table 1.2. Example of techniques used to describe gut microbiota. Adapted from (Fraher et al., 2012). ... 8 Table 1.2. Mushroom properties and respective bioactive compounds ... 12 Table 2.1. Real-time PCR conditions ... 18 Table 2.2. Primer sequences targeting bacterial groups, genomic DNA standards and PCR product size. Adapted from Marques et al. (2016). ... 20 Table 3.1. Amino acid identification and quantification of the samples collected initially and throughout digestion. Each sample was injected in triplicate. ... 26 Table 3.2. Overall variation, considering the 5 different donors, of the distinct bacterial groups (mean ± standard deviation). ... 29 Table 3.3. Concentrations obtained for sugars consumed and organic acids produced during the fermentation of the C. versicolor biomass and controls. The values are presented in mg L-1 and correspond to an average of the five donors, including two injections of each of each sample... 44 Table 6.1. Variation of microbiota in donor A. Values presented as mean ± standard deviation. ... 59 Table 6.2. Variation of microbiota in donor B. Values presented as mean ± standard deviation. ... 60 Table 6.3. Variation of microbiota in donor C. Values presented as mean ± standard deviation. ... 61 Table 6.4. Variation of microbiota in donor D. Values presented as mean ± standard deviation. ... 62 Table 6.5. Variation of microbiota in donor E. Values presented as mean ± standard deviation. ... 63
XVII
List of Abbreviations
16S rRNA ... Small Subunit Ribosomal Ribonucleic Acid ALD ... Alcoholic Liver Disease ANOVA ... Analysis of Variance AU ... Absorbance Units CFU ... Colony Forming Units CNS ... Central Nervous System CoA ... Coenzyme A Cq ... Quantification Cycle CRC ... Colorectal Cancer DB ... Degree of branching DGGE ... Denaturating Gradient Gel Electrophoresis DMSO... Dimethyl Sulfoxide DNA ... Deoxyribonucleic Acid DP ... Degree of Polymerization EDTA... Ethylenediamine Tetra Acetic Acid EFSA ... European Food Safety Authority F/B ... Firmicutes to Bacteroidetes Ratio FAO ... Food and Agriculture Organization for the United Nations FDA ...Food and Drug Administration FI ... Faecal Inocula FISH ... Fluorescent in situ Hybridization FOS ... Fructooligosaccharides FPLC ... Fast Protein Liquid Chromatography GI ...Gastrointestinal GOS ... Galactooligosaccharides HPLC... High Performance Liquid Chromatography
XVIII
HSV ... Herpes Simplex Virus IBD ... Inflammatory Bowel Disease IgA ... Immunoglobulin A IM ... Isomaloologosaccharide ISAPP... International Scientific Association for Probiotics and Prebiotics OPA ... Phthaldialdehyde MW ... Molecular Weight NAFLD ... Non-alcoholic Liver Disease pH ... Cologarithm of the hydrogen cation concentration PSK ... Polysaccharopeptide Krestin PSP ... Polysaccharopeptide qPCR... Real-time Polymerase Chain Reaction RFU ... Relative Fluorescence Units RNA ... Ribonucleic Acid RPS ...Reduced Physiological Salt RT-PCR ... Reverse Transcriptase Polymerase Chain Reaction SCFA... Short Chain Fatty Acids TE... Tris Ethylenediamine Tetra Acetic Acid buffer TGGE ... Temperature Gradient Gel Electrophoresis T-RFLP ... Terminal Restriction Fragment Length Polymorphism v/v % ... volume/ volume percentage XOS ... Xyloologosaccharide
1
1. Introduction
1.1. The gut microbiota
Over the last decade, the importance of the human gut microbiota in metabolic homeostasis and health has been widely recognized and due to its importance has been recently named as the “forgotten organ”. A deeper understanding of the microbiota’s functions, composition and interactions with the host has made some authors compare it to the immune system, since it is comprised of a group of different cells that, together, can either promote health or trigger disease (Marchesi et al., 2016, Sun et al., 2004). Moreover, the composition of the gastrointestinal (GI) microbiota varies along the GI ecosystem with the stomach and proximal small intestine containing a small number of bacteria (due to digestive secretions), while in the ileum and jejunum viable cell numbers may reach ca. 109 CFU mL-1 (mostly
aerobic microorganisms) and in the colon ca. 1012 CFU mL-1 viable cell counts may be found, with the
local microbiota being comprised of mainly anaerobic microorganisms (Million et al., 2013, Quigley, 2013).
From a composition standpoint, the gut microbiota is mainly comprised by bacteria with several papers reporting on this composition, but virus and eukaryotic organisms can also be found in the gut microbiome (Arumugam et al., 2011, Eckburg et al., 2005, Qin et al., 2010). The human GI microbiota has been described as encompassing 300 to 500 different bacterial species that, despite being frequently regarded as a two phyla ecosystem (Firmicutes and Bacteroidetes), is comprised of at least ten different phyla such as Actinobacteria, Proteobacteria, Fusobacteria or Verrucomicrobia, among others. However, the actual composition of the microbiota is still somewhat unknown as, in spite of the possible combination of molecular techniques and culture based identification methods, there are still many microorganisms that lack taxonomic classification, notwithstanding the intrinsic variations between individuals (Rajilić-Stojanović and de Vos, 2014) (Figure 1.1.). In addition to the increasingly consensual phylum level composition of the human gut and to the idea of the microbiota profile as unique as a fingerprint, the concept of clustering microbiota in enterotypes has gained ground. An example of this, is the work of Arumugam et al. (2011) who hypothesized if the inter-individual variability was only a result of slight changes in the microbial community or if the microbiota could be clustered around certain stable microbial communities. Nevertheless, factors determining the enterotype clustering are still somewhat controversial (sex, body mass index, age, etc) although, three main clusters have already been described in the adult microbiome: Prevotella, Ruminococcus or Bacteroides (Quigley, 2013, Wu et al., 2011).
In addition to bacteria, the human gut is also colonized by viruses (in particular siphophages and prophages, both bacteriophages) and eukaryotic organisms. As bacteriophages infect and replicate within bacteria, they may influence the bacterial population. Furthermore, it has been reported that each individual has a distinct virome whose composition can be affected by diet (Breitbart et al., 2003, Marchesi, 2010, Minot et al., 2011). In parallel, the gut is also colonized by eukaryotes such as fungal species and even some protozoa. While most fungi are Ascomycota and Basidiomycota, fungal diversity varies throughout the gut and is distinct from faeces (Marchesi, 2010). In later years there has been an
2
increase in evidences that demonstrate that some protozoa may be commensal residents of the human gut which has led to a discussion on the need to re-evaluate the role of protozoa as parasites, since some may have a beneficial effect. For example, reports have shown that Blastocystis can be frequently found in healthy individuals (Lukeš et al., 2015, Chabe et al., 2017, Chudnovskiy et al., 2016).
In order to understand the impact of the gut microbiota upon host homeostasis, and therefore its role in health and disease, it is necessary to comprehend the range of functions it plays (Table 1.1.). As an example of the proposed range of influence of the gut microbiota, several authors have suggested the existence of a gut-brain axis, i.e. it has been hypothesized that the microbiota may play a relevant role in the functioning and development of the Central Nervous System (CNS), influencing emotions, human behaviour and even contributing to the amelioration of some neurodegenerative conditions (Szablewski, 2018, Hu et al., 2016, Klingelhoefer and Reichmann, 2015, Mayer et al., 2015, Carabotti et al., 2015, Cryan and Dinan, 2012). Furthermore, it has been suggested that some bacteria produce neurotransmitters and neuromodulators that can affect gut functions like motility (Bienenstock et al., 2015, Carabotti et al., 2015, Sampson and Mazmanian, 2015) or impact inflammation and acid production in the gut (Strandwitz, 2018, Mittal et al., 2017). From a different perspective, since the nervous system communicates with the immune system, the impact of microbiota-brain interactions may also result in immunomodulatory effects, that go beyond those previously associated with microbiota (Wang and Kasper, 2014, El Aidy et al., 2014, Cryan and Dinan, 2012).
Figure 1.1. Phylogenetic tree of the human gut microbiota. The numbers in parentheses indicate the number
3
Table 3.1. Main functions associated with the gut microbiota. Adapted from Quigley (2013).
Function
1. Metabolite production • Produces SCFA
• Produces arginine and glutamine • Synthesis of vitamins K and B • Participates in drug metabolism • Rescues calories
2. Deconjugation of bile acids
3. Immunologic effects • Stimulates Immunoglobulin A (IgA) production
• Promotes anti-inflammatory cytokines and down regulates the proinflammatory ones • Induces regulatory T cells
4. Prevention of pathogens colonization
1.1.1. Influencing factors and modulators of gut microbiota
Many endogenous or exogenous factors can influence the microbiota composition (e.g. age, ethnicity, diet, genetic markers or geographic location) and consequently influence the host’s wellbeing. For example, the microbiota of a newborn has a low diversity, gaining complexity as the child ages until it reaches a completely developed and distinct microbial profile, similar to that of an adult, after ca. 2.5 years. Furthermore, the gut microbiota can be actively modulated by diet, which in turn it is influenced by the geographic location, in particular concerning fibres, proteins, sugar and fat intake. As such, De Filippo et al. (2010) noticed differences on the microbiota of African and Italian children with the latter registering higher protein and starch intakes and the former possessing a higher vegetable fibre intake. Similarly, in a study conducted with obese adults, the change from a high-fat/low fibre diet to a low fat/high fibre one, induced changes in the gut microbiota profile, therefore confirming the influence of diet upon gut bacterial composition (Clemente et al., 2012, Conlon and Bird, 2015, Wu et al., 2013). On a different perspective, the consumption of prebiotics, probiotics or antibiotics can induce changes in microbiota composition (Million et al., 2013). Prebiotics are food ingredients/components that can be selectively fermented by gut microbiota and alter it, promoting an increase in beneficial bacteria (Bindels et al., 2015). Probiotics are live bacteria, whose consumption is perceived as beneficial to the host with effects that are, typically, strain specific (Quigley, 2010). Both prebiotics and probiotics have shown to improve Lactobacillus and Bifidobacterium levels in the gut microbiota, but the composition changes observed are relatively small and temporary (Angelakis et al., 2013, Conlon and Bird, 2015). Antibiotics, whether prescribed or ingested through the food chain, can negatively impact the gut microbiota and, while some bacterial species have fast recovery rates, others suffer harder effects (Conlon and Bird, 2015). In fact, prolonged antibiotic consumption and/or high therapeutic dosages may even cause long-term dysbiosis, a condition characterized by a reduction in microbial diversity with loss of important taxa and consequent metabolic and homeostatic alterations (Lange et al., 2016, Quigley, 2013).
4 1.1.2. Microbiota metabolites and host interaction
Gut microbiota has a major role in host’s metabolism and physiology, particularly regarding energy use and the synthesis of absorbable components. Overall, gut microbiota contains ca. 3 million genes, several of which encode information for enzymes that, while important, are not present in the human genetic information and therefore represent a significant contribution for the human metabolism (Rowland et al., 2017, Flint et al., 2015). Ingested dietary components may have a wide range of influence in the gut (schematically represented in Figure 1.2.). The gut microbiota metabolizes undigested food components (e.g. dietary fibres and indigestible proteins), with preference for the fermentation of carbohydrates. This fermentative process may result in the production of beneficial metabolites, typically Short Chain Fatty Acids (SCFA) like propionate and butyrate. In contrast, the fermentation of undigested proteins and fat results also in the production of SCFA, but with greater variety of metabolites such as ammonia, amines, thiols, indoles, phenols, H2S, H2 and CO2, many of which have potentially toxic effects (Rowland et al., 2017,
Ríos-Covián et al., 2016).
1.1.2.1. Short chain fatty acids
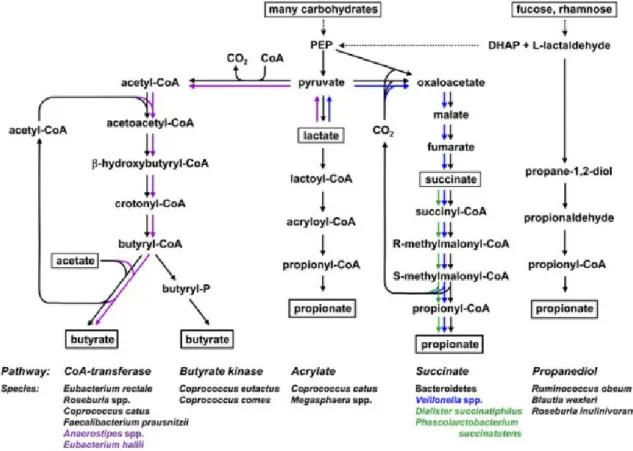
Short Chain Fatty Acids are molecules with less than 6 carbons chains (linear or branched) that can be produced by different bacteria through an array of pathways (Figure 1.3.). The ingestion of fibres leads to the production of SCFA which in turn lowers the pH values in the colon. This pH oscillation induces alterations in the overall bacterial composition and inhibits the growth of pathogenic bacteria like Enterobacteriaceae or Clostridia (den Besten et al., 2013, Flint et al., 2012, Sun and O’Riordan, 2013). So, as the SCFA concentration decreases from proximal colon to distal colon, the pH value increases. From a different perspective, the production of SCFA has also been associated with the preservation of the gut barrier, a multi-layer complex system which constitutes a physical and functional barrier, as butyrate, for example, has been related to an increased mucin production and to lead to stronger tight-junctions (Ríos-Covián et al., 2016, den Besten et al., 2013, Viggiano et al., 2015). Different SCFA, particularly acetate, butyrate and propionate, have been reported to exert specific effects in the host. As above mentioned, butyrate has been associated with an increased mucin production and with the improvement of the integrity of tight-junctions. Once formed, this SCFA may be absorbed by the colonocytes and used as the preferred energy source or enter the circulatory system to then be metabolized in the liver. Additionally, butyrate has been associated with inflammatory and
anti-Figure 1.2. Relation between diet, gut and
5
carcinogenic activities as well as with the activation of intestinal gluconeogenesis (Flint et al., 2015, Rowland et al., 2017). The minority that is not absorbed by the colonocytes is transported to the liver where it participates in lipid biosynthesis. Butyrate production is commonly associated with Firmicutes, including members of Clostridium IV and XIVa clusters, and it can be synthetized through two distinct pathways: Butyrate kinase and Coenzyme A transferase.
Acetate, one of the most abundant SCFA is regarded as essential to the growth of gut bacteria and has been reported to be a co-factor in the growth of certain microbial species. Moreover, it represents a minor energy source for colonocytes and so, when it reaches the liver, it is introduced into the lipid’s biosynthesis pathway. Acetate is mostly produced by enteric bacteria, namely Bacteroidetes and Bifidobacterium, as a result of carbohydrate’s fermentation, through the hydrolysis of acetyl-CoA. A smaller portion is synthetized by acetogenic bacteria that utilize hydrogen, carbon dioxide or formic acid, through the Wood-Ljungdahl pathway (Ríos-Covián et al., 2016).
Propionate, which can be produced through three different pathways (acrylate, succinate or propanediol pathway), represents a minor energy source for colonocytes, but has been known for its interaction with the immune system, exerting an anti-inflammatory effect. When taken up by the liver, it interferes with liver gluconeogenesis (Flint et al., 2015, Rowland et al., 2017). Propionate’s production is mainly associated to Bacteroidetes, Verrucomicrobia and to bacteria belonging to Negativutes.
Figure 1.3. Example of the metabolic pathways of acetate, butyrate and propionate production.
6 1.1.3. Gut microbiota and health
The microbiota has been described as essential for the development of the mucosa and the immune system while also constituting a physical barrier and directly competing with pathogens for colonizing space and nutrients. Therefore, the microbiota is considered to play an important role in well-being, with dysbiosis playing a role in several pathologies such as obesity, liver diseases, Inflammatory Bowel Disease (IBD) or even colorectal cancer (CRC) (Marchesi et al., 2016).
As stated previously, the gut microbiota is often regarded as a two phyla system (Firmicutes and Bacteroidetes) with an imbalance between these two groups often being associated with some health conditions. In fact, an abundance of Firmicutes and low Bacteroidetes levels has been reported to be linked with several obese phenotypes, with authors hypothesizing that a modulation of the first could contribute to the prevention/amelioration of obesity, an increasingly frequent pathology (Bastien et al., 2014, Hruby and Hu, 2015, Morgen and Sørensen, 2014). Nevertheless, the Firmicutes/Bacteroidetes ratio (F/B) and its association with obesity is controversial since contradictory evidences can be found in literature, i.e. obese volunteers’ microbiota did not exhibit high levels of Firmicutes and low levels of Bacteroidetes (Schwiertz et al., 2010, Duncan et al., 2008, Finucane et al., 2014). Overall, obesity is still considered a multifactorial pathology that results from a continuous imbalance between energy intake and expense, and therefore is highly dependent on the individual’s lifestyle, which makes it difficult to consider the gut microbiota as a direct and single cause or solution for this problem (Wang et al., 2017). A dysbiotic state can be triggered by genetic or environmental factors such as diet or alcohol consumption, with the liver being one of the most affected organs by this state (most of the liver’s blood supply comes from the intestines through the portal vein) (Guinane and Cotter, 2013). In alcohol induced dysbiosis the liquor consumption has been reported to cause an overgrowth of certain gut bacteria, in detriment of other beneficial ones. While some authors mention the general overgrowth of Gram negative bacteria, due to the increase of endotoxin levels (Hartmann et al., 2013, Purohit et al., 2008), Engen et al. (2015) described an increase in Proteobacteria, Fusobacteria and Firmicutes, particularly in Bacilli. The stimulated bacteria metabolize alcohol into other substances that affect mucin production and tight junction proteins’ expression. This, in turn, results in an increase of the gut barrier’s permeability to bacteria and their endotoxins, which will affect the liver’s homeostasis and stimulate the production of pro-inflammatory cytokines, leading to a pathology known as Alcoholic Liver Disease (ADL) (Cassard et al., 2017, Hartmann et al., 2015). Genetic factors, such as the mutation of patatin-like phospholipase (highly related to liver fat accumulation) and/or environmental factors which are related to dysbiosis (such as obesity, diabetes or hypertriglyceridemia) can also contribute to the development and progression of Non-Alcoholic Fatty Liver Disease (NAFLD). In fact, the role of the intestinal microbiota has been reported to be crucial to the pathogenesis of NAFLD, through the association with obese phenotypes, the promotion of liver inflammation and the production of metabolites, like ethanol, which are toxic to hepatocytes (Gkolfakis et al., 2015, Boursier et al., 2016). Prebiotics and probiotics, acknowledged gut microbiota modulators, may pose an interesting therapeutic resource in the amelioration/control of both ADL and NAFLD, but it still requires a better insight into the mechanisms involving gut bacteria and liver damages (Dubinkina et al., 2017, Boursier et al., 2016).
7
Dysbiosis has also been associated with other pathologies such as Inflammatory Bowel Disease (IBD), which is characterized by the chronic inflammation of the GI tract in response to environmental factors, in genetically susceptible hosts. Inflammatory Bowel Disease is a term for two conditions: Crohn’s disease and Ulcerative Colitis. The most commonly observed pattern for this condition is an overall decrease in bacterial diversity (particularly Firmicutes) coupled with an increase in Proteobacteria. Although some studies point at a causative role of gut bacteria in IBD, it is unclear if dysbiosis is a cause or a consequence of the intestinal inflammation (Matsuoka and Kanai, 2015, Hold et al., 2014). Regardless, the modulation of the gut microbiota, through prebiotic and probiotic consumption or even faecal transplantation, are perceived as good potential therapeutic strategies for these pathologies (Marchesi et al., 2016, Cassard et al., 2017, Matsuoka and Kanai, 2015, Kamada et al., 2013b). There is accumulating evidence suggesting the involvement of dysbiosis in colorectal carcinogenesis development. Once again, this dysbiotic state can be triggered by environmental factors, such as a high fat/high sugar diet, giving CRC a geographic incidence on western countries. In addition, the host may bear a genetic predisposition to carcinogenesis (Gagnière et al., 2016). It is becoming increasingly accepted that certain pathogens may pose a pro-carcinogenic stimuli through their capacity to alter colonocytes’ metabolism via their adherent and invasive properties and their metabolic output (which is perceived to promote continuous inflammatory responses). Some particular bacterial species have been identified as potentially linked to CRC such as, Streptococcus bovis, Fusobacterium spp., Helicobacter pylori, Bacteroides fragillis or Escherichia coli (Gagnière et al., 2016, Louis et al., 2014). Diet can then play an important role in CRC prevention, since high fibre intakes can lead to an increase in SCFA production, which are essential to the gut homeostasis, some have anti-carcinogenic activity and promote cellular mechanisms that contribute to the tissue integrity (Wang et al., 2017, Conlon and Bird, 2015, den Besten et al., 2013).
1.1.4. Methods for gut microbiota monitorization
For many years, culture-dependent methods were the gold standard for identifying bacteria. However, despite being a cheap and quantitative approach, these methods are not only labour intensive but they disregard non-culturable bacteria and therefore introduce a significant bias in the results (Fraher et al., 2012). Therefore, the development of culture-independent methods, particularly sequencing techniques, allowed for a better insight into the microbial environment. Most of the commonly used techniques are either based on the comparison of highly conserved sequences, such as the small subunit ribosomal Ribonucleic Acid (16S rRNA) or in a shotgun approach (Clarridge, 2004, Lozupone et al., 2012). For instance, Queipo-Ortuno et al. (2013) used Real Time Polymerase Chain Reaction (qPCR) to evaluate differences in 16S rRNA and compare the composition of the gut microbiota of rat models with distinct diets and physical activity levels. On the other hand, Yatsunenko et al. (2012) reported a shotgun approach to characterize bacterial population of human faecal samples, and evaluate the gene content. De Filippo et al. (2010) compared the faecal microbiota of European and African children using a high-throughput 16S rRNA sequencing approach combined with biochemical analysis.
The 16S rRNA, one of the most commonly used genes, contains both highly conserved and variable regions and allows for the identification of microorganisms down to the species level. The sequencing
8
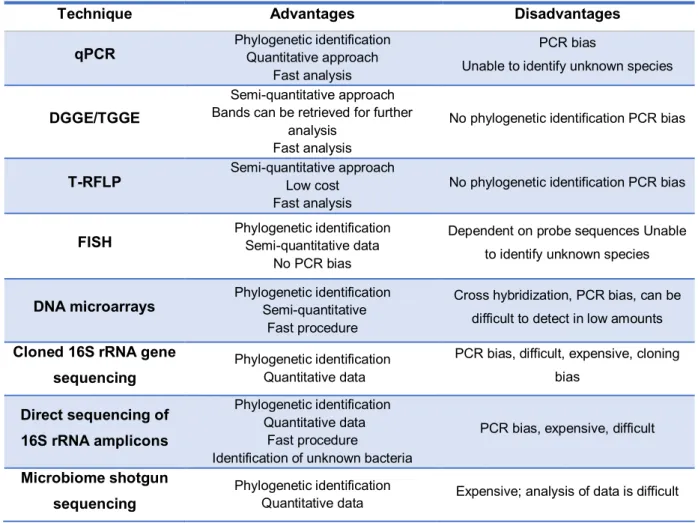
or amplification of this gene allows for an assessment of the microbial diversity (using either a qualitative or quantitative approach) and therefore the monitorization of microbial population shifts and their subsequent association with altered metabolic states. Some examples of techniques using conserved sequences are qPCR, Reverse Transcription Polymerase Chain Reaction (RT-PCR), Terminal Restriction Fragment Length Polymorphism (T-RFLP) and techniques that also rely on fluorescence emission like Fluorescent in situ Hybridization (FISH) and Flow Cytometry. On the other hand, the random shotgun approach implies the sequencing of the entire microbiota community’s Deoxyribonucleic Acid (DNA), with it being broken into small constant-sized fragments that can then be compared with existing databases. This high throughput approach allows for the quantification of the relative microorganism’s proportions as well as for the establishment of a phylogenetic profile. However, on the down side, and although the costs are decreasing, these techniques are still expensive, and the large amounts of data typically generated frequently require the application of bioinformatic tools. Some of these techniques are summarized in the Table 1.2. along with their advantages and disadvantages (Fraher et al., 2012, Ngom-Bru and Barretto, 2012, Thomas et al., 2015).
Table 1.2. Example of techniques used to describe gut microbiota. Adapted from (Fraher et al., 2012).
Technique Advantages Disadvantages
qPCR Phylogenetic identification Quantitative approach Fast analysis
PCR bias
Unable to identify unknown species
DGGE/TGGE
Semi-quantitative approach Bands can be retrieved for further
analysis Fast analysis
No phylogenetic identification PCR bias
T-RFLP Semi-quantitative approach Low cost Fast analysis
No phylogenetic identification PCR bias
FISH Phylogenetic identification Semi-quantitative data No PCR bias
Dependent on probe sequences Unable to identify unknown species
DNA microarrays Phylogenetic identification Semi-quantitative Fast procedure
Cross hybridization, PCR bias, can be difficult to detect in low amounts
Cloned 16S rRNA gene sequencing
Phylogenetic identification Quantitative data
PCR bias, difficult, expensive, cloning bias Direct sequencing of 16S rRNA amplicons Phylogenetic identification Quantitative data Fast procedure
Identification of unknown bacteria
PCR bias, expensive, difficult
Microbiome shotgun sequencing
Phylogenetic identification
Quantitative data Expensive; analysis of data is difficult qPCR – Real Time Polymerase Chain Reaction; DGGE – Denaturing Gradient Gel Electrophoresis; TGGE – Temperature Gradient Gel Electrophoresis; T-RFLP – Terminal Restriction Fragment Length Polymorphism; FISH – Fluorescent in situ Hybridization;
9
1.2. Prebiotics
As a result of a growing concern with dietary habits and their impact upon the health and wellbeing, functional foods and additives that may have a beneficial health effect, namely through intestinal microbiota modulation, have gathered the interest of the scientific community, the industry and the consumers. As previously mentioned in section 1.1.1. prebiotics are a specific example of this phenomena. In December of 2016, the International Scientific Association for Probiotics and Prebiotics (ISAPP) reviewed the latest definition of prebiotic defining it as a substrate that is selectively utilized by host microorganisms conferring a health benefit. The word ‘substrate’ refers to a substance from which an organism obtains nourishment and therefore excludes compounds that function as antimicrobial substances or other microorganisms; i.e. the ‘substrate’ should be a part of the normal metabolism of the bacterial cells and not function as an inhibitor. The concept of selectivity goes beyond the specific stimulation of bifidobacteria or lactobacilli. It can actually encompass more than one bacterial group as long as the microorganisms affected, and metabolites produced, are related to a health benefit and do not lead to gas production. Finally, the notion of health benefit implied in the prebiotic concept is difficult to prove since the effects of prebiotics vary between individuals. Regardless, there is a conceptual need to establish a causality relation between a specific action on microbial population and a positive health outcome, with all of this having in mind that the potential health benefits may occur beyond the GI tract, such as in the cardiovascular (e.g. blood lipid levels modulation) and nervous systems (e.g. through metabolites that influence brain function) (Gibson et al., 2017).
On a different note, some prebiotic related concepts need to be clarified, such as the similarity/differences between prebiotics, dietary fibres, and bioactive polysaccharides, particularly as they are frequently claimed to have the same beneficial effects and/or have the same nature (carbohydrates). Bioactive polysaccharides are carbohydrates, from a natural source, that show specific biological activity (Bindels et al., 2015, Quigley, 2010). The term dietary fibre refers to carbohydrate polymers, with ten or more monomeric units, which are hydrolysed by colonic bacteria exogenous enzymes (Bindels et al., 2015, Quigley, 2010). The Food and Agriculture Organization (FAO) stated that a prebiotic can be a dietary fibre, but a fibre does not have to be a prebiotic. Regulatory agencies around the world, such as the U.S. Food and Drug Administration (FDA) or Europe’s European Food Safety Authority (EFSA), have distinct criteria when defining prebiotics, a fact that significantly impacts the labelling of foodstuffs. Therefore the food industry is interested in developing a stable and universal definition of prebiotic, particularly as this concept gains the consumer’s acceptance (Hutkins et al., 2016).
The categories of prebiotics vary according to their origin and/or structure. Their monosaccharide composition, the degree of polymerization (DP), chain length and the type of linkage between monomers determines where and how it will interact with the microbiota, since they affect which species will be stimulated and in which portion of the gut the fermentation will occur. Prebiotics are frequently classified according to their number of monomeric units and the nature of the first residue (fructose or glucose). The most commonly recognized prebiotics in Europe are inulin, galactooligosaccharides (GOS),
10
fructooligosaccharides (FOS), polydextrose and lactulose while other oligosaccharides, such as xylooligosaccharides (XOS) and isomalooligosaccharides (IMO) are considered emerging prebiotics (Jain et al., 2015, Gibson et al., 2017). Inulin has a DP above 10 whereas the other oligosaccharides are short chains of 3 to 10 monomers. It is important to consider that prebiotic compounds may affect the organoleptic properties of foods. For example, inulin has been widely used by the food industry as a fat replacer and/or a texture modifier due to its ability to form gels, but it is not associated with a sweet flavour. FOS has a good solubility and is mainly used as a sugar replacement and for its prebiotic properties. GOS is known for being very resistant to acidic conditions and high temperatures, which facilitates its incorporation into warm or acid foodstuffs although their main application is in infant formulas. Whole grains and some dietary fibres, resistant starches, arabinoxylan and non-carbohydrates, with a gut microbiota modulating effect, are potential candidates to be recognized as prebiotics (Patel and Goyal, 2012, Bindels et al., 2015, Quigley, 2010, De Souza Oliveira et al., 2011, Aachary and Prapulla, 2011).
As previously mentioned, prebiotics, either naturally occurring or incorporated into foods, will affect the microbiota composition and its metabolic activity. To accomplish this, they must pass through most of the human GI tract without being digested by human enzymes and therefore reach the colon almost unaltered, where they can then be fermented by certain bacterial species. The majority of prebiotics target bifidobacteria which are strongly associated with healthy gut environment (Christensen et al., 2013, Vandenplas et al., 2015). Thus, most prebiotics increase bifidobacteria levels, in turn inhibiting the growth of pathogenic bacteria (Yoo and Kim, 2016). Prebiotic’s consumption has also been associated with a positive impact upon lipid metabolism (and a subsequent cholesterol reduction) and with a beneficial effect upon the immune system as they have been reported to alleviate the inflammatory responses in conditions such as IBD. Moreover, prebiotic’s ingestion may also affect cellular apoptosis, consequently reducing the rates of CRC, as well as affect the bioavailability of minerals like calcium (Pineiro et al., 2008, Patel and Goyal, 2012, Slavin, 2013, Charalampopoulos and Rastall, 2012).
1.3. Mushrooms as functional ingredients
Mushrooms’ consumption has begun many centuries ago in Asia, but nowadays it has spread worldwide, becoming more relevant in our nutrition. In fact, the current worldwide consumption per capita reaches 4 kg per person. Their associated health benefits and a deeper consumer awareness have contributed to this tendency (Royse, 2014, Aida et al., 2009). Overall, there are around 5.1 million fungal species in world with 12 000 to 14 000 of these being considered mushrooms of which only 2 000 species are considered edible. Five genera constitute 85% of the world’s mushroom growth namely Agaricus, Pleurotus, Lentinula, Auricularia and Flammulina (Royse, 2014, Cruz et al., 2016).
Mushrooms can be found as fresh, biomass or extract. The biomass is comprised of the mycelium and the primordia and is produced using a sterilized substrate to prevent contamination with other fungi and
11
ensure the absence of heavy metals and pesticides. Mushroom biomass is also more resistant to gastric fluids than extracts, since the biomass granules and cells represent a structural barrier (protecting bioactive ingredients from digestion) and it possesses not only the typical polysaccharides, but also active enzymes, which prevent oxidative stress, enhance immunity, etc. This product is usually considered a food or dietary supplement. On the other hand, mushroom extract is a concentrated extract of the mushroom’s fruiting bodies. This product has been more extensively studied and has a higher market value. Nevertheless, they lack enzymatic activity because the extraction process results in the denaturation of proteins. The extracts are often associated with the concept of ‘nutraceuticals’ or ‘pharmaceutical compounds’. However, it is important to understand the lack of consistency regarding the application of terminology such as ‘functional food’, ‘nutraceutical’ and ‘dietary supplement’, since the criteria varies from country to country (Ferrão L, 2017, Cruz et al., 2016, Barros et al., 2016b). Currently, there are several mushroom based supplements as summarized by Reis et al. (2017): powder, hot water or alcoholic extracts from artificially cultivated fruiting bodies; combined preparations of substrate, mycelium and primordial mushroom, dried and pulverized; biomass or extracts from mycelium harvested from liquid culture grown in bioreactors; naturally grown and dried mushroom fruiting bodies, as tablets or capsules or spores and their extracts.
Mushrooms are made up of enzymes (e.g. peroxidase, glucanase), polysaccharides (e.g. α- and β-glucans, hemicellulose, chitin), glycoproteins (e.g. Polysaccharide Krestin (PSK), Polysaccharopeptide (PSP)), lipids (e.g. cholesterol), minerals (e.g. germanium), vitamins (e.g. B1, B2, D2, C), terpenes (e.g. triterpenes) and phenolic compounds (e.g. flavonoids). They are often considered a low-calorie food, due to their high-water, proteins and fibre content and low amounts of fat. These components, in particular polysaccharides, have many potential benefits associated, which are listed in Table 1.3. (Cruz et al., 2016, Aida et al., 2009).
12
Table 1.4. Mushroom properties and respective bioactive compounds.
Properties Bioactive Compounds Reference
Antitumor
Lentinan Glucan Mushroom biomass
Glucan
Hericium erinaceus extracts
Okamoto et al. (2004), Kim et al. (2004), Zhang et al.
(2009), Li et al. (2014) Antiviral anti-HSV protein polysaccharide Fruiting bodies Gu et al. (2007), Faccin et al. (2007), Hobbs (2000) Immunomodulation β-D-Glucan Cordycepin Mycelium polysaccharide Crude polysaccharide Kim et al. (2005), El Enshasy and Hatti-Kaul (2013), Yang et al. (2004), Chen et al. (2012), Bimczok et al. (2009) Antioxidant Phenolic compounds G. lucidum peptide Ethanolic extract Polysaccharides Jayakumar et al. (2009), Sun et al. (2004), Liu et al.
(2013), Ker et al. (2011)
Prebiotic β-Glucans
PSP
Synytsya et al. (2009), Chen et al. (2013), (Pallav
et al., 2014) PSP - Polysaccharopeptide; HSV - Herpes Simplex Virus
1.3.2. Coriolus versicolor
Coriolus versicolor, also known as Trametes versicolor or Polyporus versicolor, belongs to the genus Coriolus, family Polyporaceae, order Polyporales and division Basidiomycotina. It is an obligate aerobe fungus and has a fan-shaped wavy margin and coloured concentric zones (Figure 1.4.). It can be found the entire year, on tree trunks, branches and stumps in temperate forests of the northern hemisphere (Asia, Europe and North America). The fruiting body of this mushroom, known as Yun-zhi, has been used for centuries in traditional Chinese medicine. Chu et al. (2002) reports that it is documented that C. versicolor exerts effects on the host’s immune function increasing energy, removing toxins, lifting the spirit, among others. In fact, C. versicolor derived preparations have been included in the modern clinical practice of Asian countries such as Japan or Korea. In a different perspective, this species has also been studied for its potential to bioconvert
Figure 1.4. Coriolus versicolor. Reprinted from Midwest
13
lignocellulosic wastes (Cruz et al., 2016, Chen et al., 2013, Cui and Chisti, 2003, Dashtban et al., 2009, López et al., 2002).
Like for other mushrooms, C. versicolor can be commercially found either as an extract or as biomass formulations which have distinct compositions and are produced using different parts of the mushroom. Extracts are the most widely used and studied with the most common ones being PSP or PSK), which are among the most commercially successful supplements in the world (Cui and Chisti, 2003, Chang and Buswell, 2008). On the other hand, as previously mentioned, biomass contains other biologically relevant compounds such as enzymes, which in turn, given their presence within the mushroom tissues, are more protected from the digestion’s effect.
Coriolus versicolor polysaccharides (both intra and extracellular) have been associated with an array of health benefits namely antitumoral (Luo et al., 2014, Lee et al., 2006, Sekhon et al., 2013), antioxidant (Pang et al., 2000, Kozarski et al., 2012), prebiotic (Chen et al., 2013, Pallav et al., 2014), antiviral (Collins and Ng, 1997), antidiabetic (Hsu et al., 2013) and immunomodulatory activities (Yang et al., 2015). Polysaccharide Krestin and PSP obtained from CM-101 and Cov-1 strains respectively, are known as biological response modifiers that can complement conventional therapies. The oral administration of these extracts seems to have an effect in controlling the proliferation of certain carcinomas as well as potentiating the immune response by inducing the production of macrophages, T-lymphocytes, interferons and immunoglobulins. Moreover, it has been reported as reducing tumours inducing immunosuppression and these extracts also seem to be beneficial regarding intestinal disorders (Fisher and Yang, 2002, Cui and Chisti, 2003). As for the prebiotic potential, the fact that C. versicolor’s β-glucans, PSP and PSK, are resistant to the digestive process, means that they are likely to reach the microbiota and may, therefore, exert some type of influence over it. Chen et al. (2013) suggested that PSP promoted the growth of beneficial bacteria (lactobacilli and bifidobacteria) while Pallav et al. (2014) stated that PSP could modulate the gut microbiota. PSK were also reported to have an antioxidant effect (Cruz et al., 2016). Additionally, when it comes to β-glucans, it is important to stand out that more studies are necessary to consider them as established prebiotics.
1.4. Work objectives
The gut microbiota has been reported as playing a vital role in human health and wellbeing, with prebiotics gaining the attention of the scientific community given their ability to modulate it. In parallel, mushrooms have been associated to a wide range of beneficial effects on the human health. However, most studies focus on extract’s properties, leaving the biomass unstudied. As such, the objective of this research work was to evaluate the potential prebiotic effect of Coriolus versicolor biomass in the human gut microbiota using a human faecal fermentation model. To accomplish this, the mushroom biomass was subjected to a simulated digestive process and then used to evaluate the evolution of specific bacterial groups, while monitoring the formation of SCFA, which are essential to the proper functioning of the large intestine.
15
2. Materials and Methods
2.1. Sample information
The C. versicolor biomass was kindly provided by Mycology Research Laboratories (UK). This biomass was produced using CV-OH1 strain and had an appearance of a medium beige free flowing powder. The product was packed in a white 200 mL opaque container and 1 g silicagel desiccant bag. The sample batch number was 17B13H and the batch size was 450. The ingredients listed were: C. versicolor biomass, Microcrystalline Cellulose, Silica and Vegetable Magnesium Sterate. The nutritional information available per 100 g of product was: 396 kcal, 6.34 g of proteins, 3.63 g of fat and 84.55 g of carbohydrates.
2.2. In vitro digestion simulation
The digestion’s simulation was performed according to Madureira et al. (2005) with some modifications. Initially, 2 g of Coriolus versicolor powder were suspended in 250 mL of tap water, in agreement with the manufacture’s indication for daily consumption. In order to simulate mouth digestion (as the samples’ pH values were between 5.6 and 6.9 no adjustments were necessary) an α-amylase (Sigma-Aldrich Chemistry, St. Louis, USA) solution (117.5 U mg-1) was added to the suspension at a rate of 0.6 mL min -1 of digestion, to mimic the action of saliva. The sample was incubated for 1 min, at 37 ºC with agitation
(200 rpm). Afterwards, to mimic stomach conditions, the pH value was adjusted to 2.0 using HCl (Merck, Darmstadt, Germany) 1 M and a solution that simulates the gastric juice was added (25 mg mL-1 pepsin,
Sigma-Aldrich Chemistry, St. Louis, USA) at a ratio of 0.05 mL mL-1 of sample. The resulting mixture
was then incubated (37 ºC, 130 rpm) for 60 min. Following this, the pH value was adjusted to 6.0 using NaHCO3 (Sigma-Aldrich Chemistry, St. Louis, USA)1 M and a solution of pancreatin (2 g L-1;
Sigma-Aldrich Chemistry, St. Louis, USA) and bile salts (12 g L-1; Fulka Analytical, Morris Plains, USA) was
added at a ratio of 0.25 mL mL-1 of sample. The solutions were then incubated for 120 min at 37 ºC at
45 rpm. Finally, intestinal absorption was simulated using a semi permeable dialysis membrane (Biotech Cellulose Ester Dialysis Membranes 100-500 Da; Spectrum Laboratories, Inc, Waltham, USA) that was submerged in distilled water (with constant stirring) for 48 h, with water being replaced after the initial 24 h period. Samples were collected at each point throughout the assay for further characterization and the final content of the dialysis membranes was freeze dried using a Christ freeze dryer (Alpha 1-4, Osterode Am Harz, Germany). The resulting powder was used later for the gut microbiota fermentations. All assays were performed in duplicate. All pH measurements were undertaken using a pH meter equipped with a Hach 52-07 pH electrode (Loveland, USA).
16
2.3. Protein quantification and characterization
The collected samples were thawed at room temperature and centrifuged at 6026 g, for 15 min. Before analysis, the supernatant was filtered through 0.22 μm filters (Milipore, Darmstadt, Germany). Protein quantification and characterization was performed using a Fast Protein Liquid Chromatography (FPLC) system (AKTA pure GE Healthcare Life Sciences, Chicago, USA), connected to a Superdex™ 200 Increase 10/300 GL column (GE Healthcare Life Sciences, Chicago, USA). The system was operated with a phosphate buffer (pH 7) containing NaCl and NaN3 at a flow rate of 0.5 mL min-1. The absorbance
measurements (280 nm) were carried out in duplicate and the results expressed in Absorbance Units (AU) per volume (mL).
2.4. Free amino acids analysis
2.4.3. Mobile phase and reagent preparation
The chromatographic analysis was carried out using two distinct eluents, A and B. Eluent A consisted of 10 g L-1 sodium phosphate dibasic dihydrate (Sigma-Aldrich Chemistry, St. Louis, USA), 7.4 g L-1
propionic acid (Sigma-Aldrich Chemistry, St. Louis, USA), 20 mL L-1 dimethyl sulfoxide (DMSO)
(Sigma-Aldrich Chemistry, St. Louis, USA), 65 mL L-1 acetonitrile (Fisher Chemical, Waltham, USA) and
ultrapure water, with the final pH value being adjusted to 6.65 using NaOH 4 M. Eluent B was composed of 330 mL L-1 methanol (Fisher Chemical, Waltham, USA), 70 mL L-1 DMSO, 400 mL L-1 acetonitrile and
ultrapure water. Both eluents were filtered under vacuum and degassed. The reagent A (25 mL) consisted of 3 mL of a previously prepared internal standard solution (20 mg mL-1 of homoserine and
norvaline (Sigma-Aldrich Chemistry, St. Louis, USA) in 0.1 M HCl), 120 μL mercaptoetanol (Fluka Analytical, St. Louis, Missouri, EUA), 500 mg of sodium tetraphenylborate (Merck, Darmstadt, Germany) and 25 mL of borate buffer. Reagent B (100 mL) was comprised of 3.5 g of iodoacetic acid (Sigma-Aldrich Chemistry, St. Louis, USA), 50 mL of borate buffer, adjusted to a pH value of 9.5 with NaOH 4 M and the volume was completed with borate buffer. Finally, 50 mL of reagent C were prepared by mixing 225 mg of OPA (Phthaldialdehyde) (Sigma-Aldrich Chemistry, St. Louis, USA), 5 mL of methanol and completed to 50 mL with borate buffer. Then, 0.5 mL of mercaptoethanol were added and the solution was bubbled with N2.
2.4.2 Chromatographic analysis
The characterization and quantification of the free amino acids was performed using a liquid chromatography apparatus (HPLC Gold 128 Solvent module, Beckman Coulter, Brea, USA) with a High Resolution Fluorescence Detector (λexcitation 356 nm; λemission 445 nm; Waters 474, Milford, USA) and an
autosampler (model 410 Varian prostar, Agilent technologies, Santa Clara, USA). The system was connected to a Chromolith® Performance RP18 (4.6 × 100 mm) (Merck, Darmstadt, Germany) column, operating at a flow rate of 0.8 mL min-1. From the filtered samples (prepared as described in section
17
reagent C were added and 10 μL of the mixture was injected into the HPLC system. All samples were injected in duplicate.
2.5. In vitro faecal fermentations
2.5.1. Collection and preparation of faecal inocula
Fresh faecal samples were collected from five healthy donors (A-E, three men and two women, ages between 23 to 63 years old), who had fulfill the criteria stablished (Appendix I and II- Informed consent form and Instructions for stool specimen collection). The faecal samples were maintained under anaerobic conditions, for a maximum of 2 h before being used. The faecal inocula (FI) was then prepared, by diluting the faecal matter in Reduced Physiological Salt solution (RPS) (constituted by 0.5 g L-1 cysteine-HCl (Merck, Darmstadt, Germany) and 8.5 g L-1 NaCl (LabChem, Zelienople, USA)) with
a final pH value of 6.8, at 100 g L-1 in an anaerobic workstation (Don Whitley Scientific, West Yorkshire,
UK) (10% CO2, 5% H2 and 85% N2).
2.5.2. Nutrient Base Medium preparation
Nutrient Base Medium was used to carry out the faecal fermentations. The medium was comprised of 5.0 g L-1 trypticase soy broth without dextrose (Fluka Analytical, St. Louis, Missouri, EUA), 5.0 g L-1
bactopeptone (Becton Dickinson Biosciences, New Jersey, USA), 0.5 g L-1 cysteine-HCl (Merck,
Darmstadt, Germany), 1.0% (v/v) of salt solution A [100.0 g L-1 NH4Cl (Merck, Darmstadt, Germany),
10.0 g L-1 MgCl2·6H2O (Merck, Darmstadt, Germany), 10.0 g L-1 CaCl2·2H2O (Carlo Erba, Chaussée du
Vexin, France)], 1.0% (v/v) of trace mineral solution (ATCC, Virginia, USA), 0.2% (v/v) of salt solution B [200.0 g L-1 K2HPO4·3H2O (Merck, Darmstadt, Germany)] and 0.2% (v/v) of a 0.5 g L-1 resazurin solution
(Sigma-Aldrich Chemistry, St. Louis, USA). The medium final pH value was adjusted to 6.8 and was then bubbled with N2 until it presented a translucent/yellowish colour. Following this, 50 mL were then
distributed into several containers. Fructooligosaccharides (FOS) (Nutripar, Matosinhos, Portugal) and the freeze-dried digested C. versicolor biomass were added to the respective vessels at a final concentration of 20 g.L-1. The bottles were capped and autoclaved. Following sterilization, and before
adding the faecal inocula, the atmosphere of each flask was refluxed with a gas mixture (10% CO2, 5%
H2 and 85% N2) sterilized using a 0.22 μm filter (Millipore, Burlington, USA).
2.5.3 Faecal fermentations
The flasks prepared in 2.4.2. were inoculated at 2% (v/v) with faecal inocula (section 2.4.1) and incubated for 48 h at 37 ºC under anaerobic atmosphere (10% CO2, 5% H2 and 85% N2). Samples were
collected after 0, 12, 24 and 48 h of incubation and the pH values were measured using a MicropH 2002 pH meter (Crison, Barcelona, Spain), equipped with a 52-07 pH electrode (Crison, Barcelona, Spain). The positive and negative controls were respectively designated as C+ (FOS) and C- (only faecal inocula), while the C. versicolor digested biomass was dubbed Cv. Afterwards, the samples were stored at -30 ºC until analysis. All the steps considered in this section were carried out inside an anaerobic workstation (Don Whitley Scientific, West Yorkshire, UK).