arXiv:1208.4688v1 [hep-ex] 23 Aug 2012
CERN-PH-EP-2012-204
Submitted to: Physical Review D
Further search for supersymmetry at
√
s
= 7 TeV
in final states
with jets, missing transverse momentum and isolated leptons
with the ATLAS detector
The ATLAS Collaboration
Abstract
This work presents a new inclusive search for supersymmetry (SUSY) by the ATLAS experiment
at the LHC in proton-proton collisions at a center-of-mass energy
√
s = 7 TeV
in final states with
jets, missing transverse momentum and one or more isolated electrons and/or muons. The search is
based on data from the full 2011 data-taking period, corresponding to an integrated luminosity of 4.7
fb
−1. Single- and multi-lepton channels are treated together in one analysis. An increase in sensitivity
is obtained by simultaneously fitting the number of events in statistically independent signal regions,
and the shapes of distributions within those regions. A dedicated signal region is introduced to be
sensitive to decay cascades of SUSY particles with small mass differences (“compressed SUSY”).
Background uncertainties are constrained by fitting to the jet multiplicity distribution in background
control regions. Observations are consistent with Standard Model expectations, and limits are set or
extended on a number of SUSY models.
transverse momentum and isolated leptons with the ATLAS detector
The ATLAS CollaborationThis work presents a new inclusive search for supersymmetry (SUSY) by the ATLAS experiment at
the LHC in proton-proton collisions at a center-of-mass energy√s = 7 TeV in final states with jets,
missing transverse momentum and one or more isolated electrons and/or muons. The search is based
on data from the full 2011 data-taking period, corresponding to an integrated luminosity of 4.7 fb−1.
Single- and multi-lepton channels are treated together in one analysis. An increase in sensitivity is obtained by simultaneously fitting the number of events in statistically independent signal regions, and the shapes of distributions within those regions. A dedicated signal region is introduced to be sensitive to decay cascades of SUSY particles with small mass differences (“compressed SUSY”). Background uncertainties are constrained by fitting to the jet multiplicity distribution in background control regions. Observations are consistent with Standard Model expectations, and limits are set or extended on a number of SUSY models.
PACS numbers: 12.60.Jv, 13.85.Rm, 14.80.Ly
I. INTRODUCTION
Supersymmetry (SUSY) [1–9] is a candidate for physics beyond the Standard Model (SM). If strongly interacting supersymmetric particles are present at the TeV scale, they may be copiously produced in 7 TeV proton-proton collisions at the Large Hadron Collider [10]. In the min-imal supersymmetric extension of the Standard Model (MSSM) [11–15] such particles decay into jets, leptons and the lightest supersymmetric particle (LSP). Jets arise in the decays of squarks and gluinos, while leptons can arise in decays involving charginos or neutralinos. A long-lived, weakly interacting LSP will escape detection, leading to missing transverse momentum (~pmiss
T and its
magnitude ETmiss) in the final state. Significant ETmisscan also arise in scenarios where neutrinos are created some-where in the SUSY decay cascade.
This paper presents a new inclusive search with the ATLAS detector for SUSY in final states containing jets, one or more isolated leptons (electrons or muons) and Emiss
T . Previous searches in these channels have been conducted by both the ATLAS [16, 17] and CMS [18–21] collaborations. In this paper, the analysis is extended to 4.7 fb−1and single- and multi-lepton channels (with jets and Emiss
T ) are treated simultaneously. A signal region with a soft lepton and soft jets is introduced in order to probe SUSY decays involving small mass differences between the particles in the decay chain. A new, simul-taneous fit to the yield in multiple signal regions and to the shapes of distributions within those signal regions is employed. Background uncertainties are constrained by fitting to the jet multiplicity distribution in background control regions.
II. THE ATLAS DETECTOR
The ATLAS detector [22, 23] consists of a tracking system (inner detector, ID) surrounded by a thin
su-perconducting solenoid providing a 2 T magnetic field, electromagnetic and hadronic calorimeters and a muon spectrometer (MS). The ID consists of pixel and sili-con microstrip detectors, surrounded by a straw-tube tracker with transition radiation detection (transition ra-diation tracker, TRT). The electromagnetic calorimeter is a lead liquid-argon (LAr) detector. Hadronic calorime-try is based on two different detector technologies, with scintillator-tiles or LAr as active media, and with ei-ther steel, copper, or tungsten as the absorber mate-rial. The MS is based on three large superconducting toroid systems arranged with an eight-fold azimuthal coil symmetry around the calorimeters, and three stations of chambers for the trigger and for precise position mea-surements. The nominal pp interaction point at the cen-ter of the detector is defined as the origin of a right-handed coordinate system. The positive x-axis is defined by the direction from the interaction point to the center of the LHC ring, with the positive y-axis pointing up-wards, while the beam direction defines the z-axis. The azimuthal angle φ is measured around the beam axis and the polar angle θ is the angle from the z-axis. The pseu-dorapidity is defined as η = − ln tan(θ/2). Transverse coordinates, such as the transverse momentum, pT, are defined in the (x–y) plane.
III. SUSY SIGNAL MODELING AND
SIMULATED EVENT SAMPLES
The SUSY models considered are MSUGRA/CMSSM [34, 35], minimal GMSB [36–40] and a number of sim-plified models [41, 42]. The MSUGRA/CMSSM model is characterized by five parameters: the universal scalar and gaugino mass parameters m0 and m1/2, a universal trilinear coupling parameter A0, the ratio of the vacuum expectation values of the two Higgs doublets tan β, and the sign of the Higgsino mass parameter µ. In this analy-sis, the values of m0and m1/2are scanned, and the other parameters are fixed as follows: tan β = 10, A0= 0 and
Cross Calculation
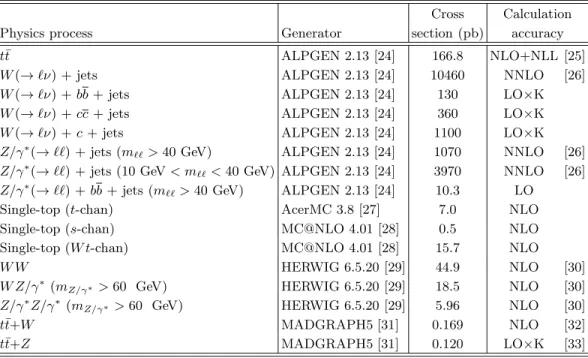
Physics process Generator section (pb) accuracy
t¯t ALPGEN 2.13 [24] 166.8 NLO+NLL [25]
W (→ ℓν) + jets ALPGEN 2.13 [24] 10460 NNLO [26]
W (→ ℓν) + bb + jets ALPGEN 2.13 [24] 130 LO×K
W (→ ℓν) + cc + jets ALPGEN 2.13 [24] 360 LO×K
W (→ ℓν) + c + jets ALPGEN 2.13 [24] 1100 LO×K
Z/γ∗(→ ℓℓ) + jets (m
ℓℓ> 40 GeV) ALPGEN 2.13 [24] 1070 NNLO [26]
Z/γ∗(→ ℓℓ) + jets (10 GeV < m
ℓℓ< 40 GeV) ALPGEN 2.13 [24] 3970 NNLO [26]
Z/γ∗(→ ℓℓ) + bb + jets (m
ℓℓ> 40 GeV) ALPGEN 2.13 [24] 10.3 LO
Single-top (t-chan) AcerMC 3.8 [27] 7.0 NLO
Single-top (s-chan) MC@NLO 4.01 [28] 0.5 NLO
Single-top (W t-chan) MC@NLO 4.01 [28] 15.7 NLO
W W HERWIG 6.5.20 [29] 44.9 NLO [30]
W Z/γ∗(m
Z/γ∗ > 60 GeV) HERWIG 6.5.20 [29] 18.5 NLO [30]
Z/γ∗Z/γ∗(m
Z/γ∗ > 60 GeV) HERWIG 6.5.20 [29] 5.96 NLO [30]
t¯t+W MADGRAPH5 [31] 0.169 NLO [32]
t¯t+Z MADGRAPH5 [31] 0.120 LO×K [33]
TABLE I. Simulated background event samples used in this analysis, with the corresponding production cross sections. The notation LO×K indicates that the process is calculated at leading-order and corrected by a factor derived from the ratio of
NLO to LO cross sections for a closely related process. The t¯t, W + light-jets and Z+ light-jets samples are normalized using
the inclusive cross sections; the values shown for the W + light-jets and Z+ light-jets samples are for a single lepton flavor. The single-top cross sections are listed for a single lepton flavor in the s- and t-channels. Further details are given in the text.
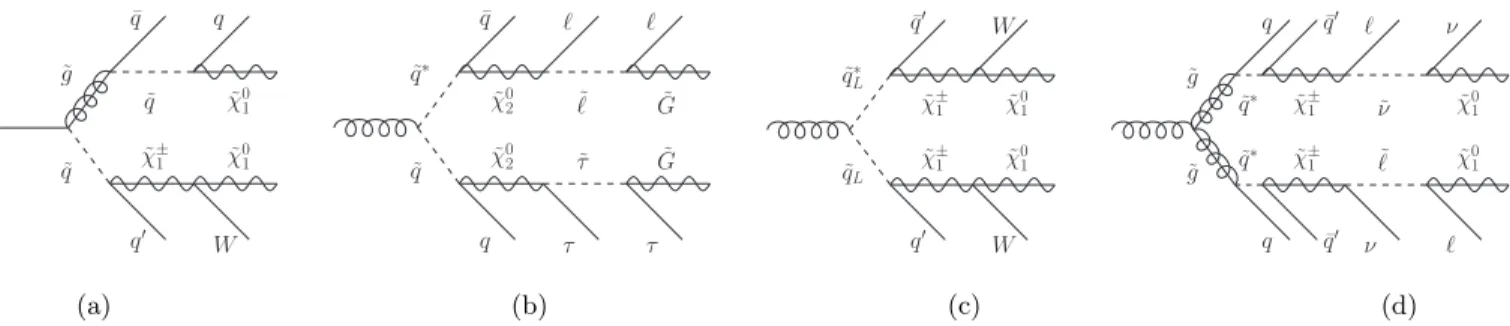
µ is taken to be positive. A diagram showing the decay of the associated production of squark and gluino is de-picted in Fig. 1 (a). Other diagrams representative for the SUSY models discussed in the following are shown in Fig. 1 (b-d).
The minimal GMSB model has six parameters: the SUSY breaking scale Λ, the mass scale of the messen-ger fields Mmes, the number of messenger fields N5, the scale of the gravitino coupling Cgrav, the ratio of the vac-uum expectation values of the two Higgs doublets tan β, and the sign of the Higgsino mass parameter µ. For the minimal GMSB model, the parameters tan β and Λ are scanned and the other parameters are assigned fixed val-ues: Mmes = 250 TeV, N5 = 3, Cgrav = 1 and the sign of µ is taken to be positive. The mass scale of the col-ored superpartners is set by the parameter Λ, while the next-to-lightest SUSY particle (NLSP) is determined by a combination of Λ and tan β. At low values of Λ, the NLSP is the lightest neutralino ( ˜χ0
1) while at the higher values of Λ where this search provides new sensitivity, the NLSP is a stau for tan β & 10 and a slepton of the first and second generation otherwise. The NLSP de-cays into its SM partner and a nearly massless gravitino. The gaugino and sfermion masses are proportional to N5 and√N5, respectively. The parameter Cgrav determines the NLSP lifetime, set here such that all NLSPs decay promptly.
Several simplified models are considered in this pa-per. In the “one-step” models, SUSY production
pro-ceeds via either pp → ˜g˜g or pp → ˜qLq˜L∗, where only left-handed squarks of the first- and second-generation are considered. The gluino decays to the neutralino LSP via ˜g → qq′ ˜ χ±1 → qq ′ W± ˜
χ01, and the squark via ˜ qL → q′χ˜±1 → q ′ W± ˜ χ0
1, where the W -boson can be real or virtual. The gluino and LSP masses are varied while the chargino mass is set to be halfway between them. In a variant of the one-step model, the LSP mass is held fixed at 60 GeV while the gluino (squark) and chargino masses are scanned.
In the “two-step” models, SUSY production proceeds via either pp → ˜g˜g or pp → ˜qLq˜∗L, again where squarks of the first- and second-generation are considered. In the first class of two-step models all squarks and gluinos de-cay via a chargino: ˜g → qq′
˜ χ±
1 and ˜qL → q′χ˜±1. The charginos decay via ˜χ±1 → ℓ˜νL or ˜χ±1 → ν ˜ℓL; in case of third generation sleptons, the decay to the stau is via ˜χ±1 → ν ˜τ1. All three generations of sleptons and sneutrinos are allowed with equal probability, resulting in equal branching ratio to sleptons and to sneutrinos. In the second class of two-step models, the gluinos or left-handed squarks decay either via a chargino (˜g → qq′
˜ χ±1 or ˜ qL→ q′χ˜ ± 1) or via a neutralino (˜g → qq ˜χ02or ˜qL→ q ˜χ02). The events are generated such that one chargino and one neutralino are always present in the decays of the pair produced gluinos or left-handed squarks. Neutralino de-cays proceed via either ˜χ0
2→ ℓ˜ℓL or ˜χ02→ ν ˜ν. As in the first two-step model, all three generations of sleptons and sneutrinos are allowed with equal probability, resulting
˜ g ˜ q ¯ q q ˜ q χ˜0 1 ˜ χ±1 χ˜0 1 q′ W ˜ q∗ ˜ q ¯ q ℓ ℓ ˜ χ0 2 ℓ˜ G˜ ˜ χ0 2 τ˜ G˜ q τ τ ˜ q∗ L ˜ qL ¯ q′ W ˜ χ± 1 χ˜ 0 1 ˜ χ±1 χ˜ 0 1 q′ W ˜ g ˜ g q q¯′ ℓ ν ˜ q∗ χ˜± 1 ν˜ χ˜ 0 1 ˜ q∗ χ˜± 1 ℓ˜ χ˜ 0 1 q q¯′ ν ℓ (a) (b) (c) (d)
FIG. 1. Representative diagrams for the different SUSY models considered in this analysis: (a) MSUGRA/CMSSM model
with pp → ˜q˜g and subsequent decay of the squark via a chargino; (b) GMSB model with pp → ˜q ˜q∗and subsequent decay via
sleptons and staus; (c) one-step simplified model with pp → ˜qLq˜L∗ and subsequent decay via charginos; (d) two-step simplified
model with pp → ˜g˜g and subsequent decays via charginos and sleptons or sneutrinos.
in a 50% branching ratio to sleptons and to sneutrinos. Finally, in the third class of two-step models without intermediate sleptons, the gluino and squark decay via ˜
g → qq′ ˜
χ±1 or ˜qL → q′χ˜±1; the decay of the chargino then proceeds via ˜χ±
1 → W(∗)±χ˜02→ W(∗)±Z(∗)χ˜01. This signature is realized in the MSSM in a parameter region where additional decay modes, not contained in the sim-plified model, may lead to a significant reduction of the cross section times branching fraction of the W Z signa-ture.
In the first two types of two-step models, the chargino and neutralino have equal masses (again set to be halfway between the gluino/squark and LSP mass); the slepton and sneutrino masses are set to be equal and halfway between the chargino/neutralino and LSP masses. In the third two-step model, the ˜χ±1 mass is set halfway between the gluino/squark and LSP while the ˜χ0
2 mass
is set halfway between the chargino and LSP. In all the simplified models, the superpartners that have not been mentioned are decoupled by setting their masses to multi-TeV values.
Simulated event samples are used for estimating the signal acceptance, the detector efficiency, and for estimat-ing many of the backgrounds (in most cases in association with data-driven techniques). The MSUGRA/CMSSM and minimal GMSB signal samples are generated with Herwig++ 2.5.2 [43] and MRST2007LO∗[44] parton dis-tribution functions (PDFs); ISAJET 7.80 [45] is used to generate the physical particle masses. The simplified models are generated with one extra jet in the matrix el-ement using MADGRAPH5 [31], interfaced to PYTHIA [46], with the CTEQ6L1 [47] PDF set; MLM match-ing [48] is done with a scale parameter that is set to one-fourth of the mass of the lightest sparticle in the hard-scattering matrix element. Signal cross sections are calculated in the MSSM at next-to-leading order in the strong coupling constant, including the resummation of soft gluon emission at next-to-leading-logarithmic accu-racy (NLO+NLL) [49–53].
The simulated event samples for the SM backgrounds are summarized in Table I. The ALPGEN and MAD-GRAPH samples are produced with the MLM matching scheme. The ALPGEN samples are generated with a
number of partons 0 ≤ Nparton ≤ 5 in the matrix ele-ment, except for W + light-flavored jets which are gen-erated with up to 6 partons. The W bb, W cc and W c cross sections shown are the leading-order values from ALPGEN multiplied by a K-factor of 1.2, based on the K-factor for light-flavored jets. For the final result, mea-sured cross sections are used for the W/Z+ heavy-flavor-jets samples [54]. The overlap between the heavy-flavored and light-flavored W/Z+jets samples is removed. The cross section for Z+jets with 10 GeV < mℓℓ< 40 GeV is obtained by assuming the same K-factor as for mℓℓ > 40 GeV. The single-top cross sections are taken from MC@NLO; for the s- and t-channels, they are listed for a single lepton flavor.
The theoretical cross sections for W +jets and Z+jets are calculated with FEWZ [26] with the MSTW2008NNLO [55] PDF set. For the diboson cross sections, MCFM [30] with the MSTW2008NLO PDFs is used. The t¯t cross section is calculated with HATHOR 1.2 [25] using MSTW2008NNLO PDFs. The t¯t+W cross section is taken from Ref. [32]. The t¯t+Z cross section is the leading-order value multiplied by a K-factor deduced from the NLO calculation at√s = 14 TeV [33].
Parton shower and fragmentation processes are sim-ulated for the ALPGEN and MC@NLO samples using HERWIG [29] with JIMMY [56] for underlying event modeling; PYTHIA is used for the AcerMC single-top sample and t¯t+W/Z. The PDFs used in this analysis are: CTEQ6L1 for the ALPGEN and MADGRAPH samples, CT10 [57] for MC@NLO, and MRSTMCal (LO∗∗) [58] for HERWIG. The underlying event tunes are the AT-LAS AUET2B LO∗∗
tunes [59].
The detector simulation [60] is performed using GEANT4 [61]. All samples are produced with a range of simulated minimum-bias interactions overlaid on the hard-scattering event to account for multiple pp interac-tions in the same beam crossing (pile-up). The overlay also treats the impact of pile-up from beam crossings other than the one in which the event occurred. Correc-tions are applied to the simulated samples to account for differences between data and simulation for the lepton trigger and reconstruction efficiencies, momentum scale and resolution, and for the efficiency and mis-tag rates
for b-quark tagging.
IV. OBJECT RECONSTRUCTION
This analysis is based on three broad classes of event selection: i) a hard single-lepton channel that is an exten-sion to higher masses of the previous search [16], ii) a soft single-lepton channel geared towards SUSY models with small mass differences in the decay cascade, and iii) a multi-lepton channel aimed at decay chains with higher lepton multiplicities. The event selection requirements are described in detail in Sec. VI. Here the final-state object reconstruction and selection are discussed.
A. Object Preselection
The primary vertex [62] is required to be consistent with the beam spot envelope and to have at least five associated tracks; when more than one such vertex is found, the vertex with the largest summed |pT|2 of the associated tracks is chosen.
Electrons are reconstructed from energy clusters in the electromagnetic calorimeter matched to a track in the ID [63]. Pre-selected electrons are required to have |η| < 2.47 and pass a variant of the “medium” selec-tion defined in Ref. [63] that differs mainly in having a tighter track-cluster matching in η, stricter pixel hit requirements, additional requirements in the TRT, and tighter shower-shape requirements for |η| > 2.0. These requirements provide background rejection close to the “tight” selection of Ref. [63] with only a few percent loss in efficiency with respect to “medium”. Pre-selected electrons are further required to pass a pT requirement depending on the analysis channel: 10 GeV for the hard-lepton and multi-hard-lepton channels, and 7 GeV in the soft-lepton channel.
Muons are identified either as a combined track in the MS and ID systems, or as an ID track matched with a MS segment [64, 65]. Requirements on the quality of the ID track are identical to those in Ref. [16]. Pre-selected muons are required to have |η| < 2.4 and a pT require-ment that depends on the analysis channel: 10 GeV for the hard-lepton and multi-lepton channels, and 6 GeV in the soft-lepton channel.
Jets are reconstructed using the anti-kt algorithm [66, 67] with a radius parameter R = 0.4. Jets arising from detector noise, cosmic rays or other non-collision sources are rejected [68]. To account for the differ-ences between the calorimeter response to electrons and hadrons, pT- and η-dependent factors, derived from sim-ulated events and validated with test beam and collision data, are applied to each jet to provide an average energy scale correction [68] back to particle level. Pre-selected jets are required to have pT > 20 GeV and |η| < 4.5. Since electrons are also reconstructed as jets, pre-selected
jets which overlap with pre-selected electrons within a distance ∆R =p(∆η)2+ (∆φ)2= 0.2 are discarded.
B. Signal Object Selection
For the final selection of signal events, “signal” elec-trons are required to pass a variant of the “tight” se-lection of Ref. [63], providing 1–2% gain in efficiency and slightly better background rejection. Signal elec-trons must have |η| < 2.47 and a distance to the closest jet ∆R > 0.4. They are also required to satisfy isola-tion criteria: the scalar sum of the pTof tracks within a cone of radius ∆R = 0.2 around the electron (excluding the electron itself) is required to be less than 10% of the electron pT.
Muons in the final selection (“signal” muons) are re-quired to have |η| < 2.4 and ∆R > 0.4 with respect to the closest jet. Further isolation criteria are imposed: the scalar sum of the pT of tracks within a cone of ra-dius ∆R = 0.2 around the muon candidate (excluding the muon itself) is required to be less than 1.8 GeV. The pT requirements for signal electrons and muons depend on the signal regions and are described in Sec. VI.
Signal jets are required to have pT> 25 GeV and |η| < 2.5. In addition, they are required to be associated with the hard-scattering process, by demanding that at least 75% of the scalar sum of the pT of all tracks associated with the jet come from tracks associated with the primary vertex of the event. Jets with no associated tracks are rejected. The above requirements are applied to cope with the high pile-up conditions of the 2011 data-taking, in particular the later part of the run.
The missing transverse momentum is computed as the negative of the vector sum of the pT of all pre-selected electrons, pre-selected muons and pre-selected jets (after removing those overlapping with pre-selected electrons), and all calorimeter clusters with |η| < 4.9 that are not associated with any of the above-mentioned objects.
For approximately 20% of the 2011 data-taking pe-riod, an electronics failure created a region in the elec-tromagnetic calorimeter, located at 0 < η < 1.4 and −0.8 < φ < −0.6, where no signals could be read out. Events with an electron in this region are vetoed for the entire dataset, leading to an acceptance loss of less than 1% for signal events in the signal region. For jets, the amount of transverse energy (ET) lost in the dead region can be estimated from the energy deposited in the neigh-boring calorimeter cells. If this lost ET projected along the Emiss
T direction amounts to more than 10 GeV and constitutes more than 10% of the Emiss
T , the event is re-jected. The effect of the electronics failure is described in the detector simulation, and the loss of signal acceptance from this requirement is negligible.
Jets arising from b-quarks are identified using informa-tion about track impact parameters and reconstructed secondary vertices [69]; the b-tagging algorithm is based on a neural network using the output weights of the
Jet-Fitter+IP3D, IP3D, and SV1 algorithms (defined in Ref. [69]) as input. The b-tagging requirements are set at an operating point corresponding to an average efficiency of 60% for b-jets in simulated t¯t events, for which the algorithm provides a rejection factor of approximately 200–400 for light-quark and gluon jets (depending on the pTof the jet) and a rejection of approximately 7–10 for charm jets.
V. TRIGGER AND DATA COLLECTION
The data used in this analysis were collected from March through October 2011, during which the instanta-neous luminosity of the LHC reached 3.65×1033cm−2s−1. The average number of interactions per beam crossing ranged from approximately 4 to 16 during the run, with an average of 10. After the application of beam, detec-tor, and data-quality requirements, the total integrated luminosity is 4.7 fb−1. The uncertainty on the luminosity is determined to be 3.9% [70, 71].
Three types of triggers were used to collect the data: electron, muon and Emiss
T . The electron trigger se-lects events containing one or more electron candidates, based on the presence of a cluster in the electromagnetic calorimeter, with a shower shape consistent with that of an electron. The transverse energy threshold at the trig-ger level was either 20 GeV or 22 GeV, depending on the instantaneous luminosity. For signal electrons satisfying pT> 25 GeV, the trigger efficiency is in the plateau region and ranges between 95% and 97%. In order to recover some of the efficiency for high-pT electrons during run-ning periods with the highest instantaneous luminosities, events were also collected with an electron trigger with looser shower shape requirements but with a pTthreshold of 45 GeV.
The muon trigger selects events containing one or more muon candidates based on tracks identified in the MS and ID. The muon trigger pTthreshold was 18 GeV. During running periods with the highest instantaneous luminosi-ties, the trigger requirements on the number of MS hits were tightened; in order to recover some of the resulting loss in efficiency, events were also collected with a muon trigger that maintained the looser requirement on the number of hits chambers but that required in addition a jet with pTgreater than 10 GeV. This jet requirement is fully efficient for jets with offline calibrated pTgreater than approximately 50 GeV. The muon triggers reach their efficiency plateaus below a signal muon pT thresh-old of 20 GeV. The plateau efficiency ranges from about 70% for |η| < 1.05 to 88% for 1.05 < |η| < 2.4.
The Emiss
T trigger bases the bulk of its rejection on the vector sum of transverse energies deposited in pro-jective trigger towers (each with a size of approximately ∆η × ∆φ ∼ 0.1 × 0.1 for |η| < 2.5 and larger and less regular in the more forward regions). A more refined cal-culation based on the vector sum of all calorimeter cells above threshold is made at a later stage in the trigger
processing. The trigger required Emiss
T > 60 GeV, reach-ing its efficiency plateau for offline calibrated Emiss
T >
180 GeV. The efficiency on the plateau is close to 100%.
VI. EVENT SELECTION
Two variables, derived from the kinematic properties of the reconstructed objects, are used in the event se-lection. The transverse mass (mT) computed from the momentum of the lepton (ℓ) and the missing transverse momentum (~pmiss
T ), defined as mT=
q 2pℓ
TETmiss(1 − cos(∆φ(~ℓ, ~pTmiss))), is useful in rejecting events containing a single W boson. The inclusive effective mass (minc
eff) is the scalar sum of the pTof the leptons, the jets and ETmiss:
minc eff = Nlep X i=1 pℓ T,i+ Njet X j=1 pT,j+ EmissT
where the index i runs over all the signal leptons and j runs over all the signal jets in the event. The inclusive effective mass is correlated with the overall mass scale of the hard-scattering process and provides good discrim-ination against the SM background, without being too sensitive to the details of the SUSY decay cascade. The analysis in Ref. [16] used the three or four leading-pTjets in the calculation of the effective mass; the additional jets used here improve the discrimination between signal and background. A second definition for the effective mass, denoted by meff, is based on the sum over the 2-, 3-, or 4-leading pTjets, depending on the minimum number of jets required in a given signal region. This variable is used to compute the ratio Emiss
T /meff which reflects the fluctuations in the Emiss
T as a function of the calorimeter activity in the event; the definition used here improves the rejection of the background from mismeasured jets.
This analysis is based on five signal regions, each tai-lored to maximize the sensitivity to different SUSY event topologies: 1,2) Signal regions requiring a hard lepton plus 3- or 4-jets are extensions of the previous analy-sis [16] to higher SUSY mass scales; these signal regions have been optimized for the MSUGRA/CMSSM model as well as for the bulk of the one-step simplified models with large mass difference (∆m) between the gluino and the LSP; 3) A soft-lepton signal region targets the sim-plified models with small ∆m, where the hard leading jet comes from initial-state radiation (ISR); 4) A multi-lepton signal region with ≥ 2 jets is tailored to GMSB models; 5) A multi-lepton signal region with ≥ 4 jets is geared towards the two-step simplified models with in-termediate sleptons and sneutrinos. These signal regions are described in more detail and summarized in Table II. 1. Hard lepton plus three jets. Events are selected with the electron and muon triggers. The num-ber of signal leptons with pT > 25 (20) GeV for
single-lepton multi-lepton
3-jet 4-jet soft-lepton 2-jet 4-jet
Trigger Single electron or muon (+jet) Missing ET Single electron or muon (+jet)
Nlep 1 1 1 ≥ 2 ≥ 2 pℓT(GeV) > 25 (20) > 25 (20) 7 to 25 (6 to 20) 25 (20) 25 (20) pℓ2 T(GeV) < 10 < 10 < 7 (6) > 10 > 10 Njet ≥ 3 ≥ 4 ≥ 2 ≥ 2 ≥ 4 pjetT (GeV) > 100, 25, 25 > 80, 80, 80, 80 > 130,25 > 200,200 > 50,50,50,50 padd.jetT (GeV) < 80 — — < 50 — ETmiss(GeV) > 250 > 250 > 250 > 300 > 100 mT(GeV) > 100 > 100 > 100 — — Emiss T /meff > 0.3 > 0.2 > 0.3 — 0.2 minc eff (GeV) > 1200 > 800 — — > 650
TABLE II. Overview of the selection criteria for the signal regions used in this analysis. The pTselections for leptons are given
for electrons (muons).
electrons (muons) is required to be exactly one. Events containing additional signal leptons with pT > 10 GeV are rejected. The number of sig-nal jets is required to be ≥ 3, with a leading jet satisfying pT > 100 GeV and the other jets hav-ing pT > 25 GeV. Events with four or more jets are rejected if the fourth jet has pT> 80 GeV; this requirement keeps this signal region disjoint from the 4-jet signal region. In addition, the following conditions are imposed: mT > 100 GeV, ETmiss > 250 GeV, Emiss
T /meff > 0.3, and minceff > 1200 GeV. 2. Hard lepton plus four jets. The lepton requirements are the same as in the previous signal region. The number of signal jets is required to be ≥ 4, with the four leading jets satisfying pT > 80 GeV. In addition, the following requirements are applied: mT> 100 GeV, ETmiss > 250 GeV, ETmiss/meff > 0.2, and minceff > 800 GeV.
3. Soft-lepton selection. Events are selected with the Emiss
T trigger. The number of signal leptons (elec-tron or muon) is required to be exactly one. Elec-trons are required to have 7 GeV < pT< 25 GeV, and muons are required to be in the range 6 GeV < pT< 20 GeV. Events containing an additional sig-nal electron (muon) with pT > 7 (6) GeV are re-jected. The number of signal jets is required to be ≥ 2, with the leading jet satisfying pT > 130 GeV and the second jet having pT> 25 GeV. In ad-dition, the following conditions are required: mT> 100 GeV, Emiss
T > 250 GeV, and ETmiss/meff > 0.3. No explicit requirement on minc
eff is applied. 4. Multi-lepton plus two jets. Events are selected with
the electron and muon triggers. Two or more signal leptons are required, with a leading electron (muon) with pT > 25 (20) GeV and sub-leading leptons
with pT > 10 GeV. The two leading leptons must have opposite charge. At least two signal jets with pT > 200 GeV are required. Events with four or more signal jets are rejected if the fourth leading jet has pT> 50 GeV; this requirement keeps this sig-nal region disjoint from the multi-lepton plus 4-jet signal region. In addition the Emiss
T is required to be > 300 GeV. No explicit requirements are made on Emiss
T /meff or minceff.
5. Multi-lepton plus four jets. The lepton require-ments are the same as in the multi-lepton plus two jets signal region. At least four signal jets with pT> 50 GeV are required. In addition, the follow-ing requirements are imposed: Emiss
T > 100 GeV, Emiss
T /meff > 0.2, and minceff > 650 GeV.
In contrast to the previous analysis [16], no require-ment on the azimuthal angle between the EmissT vector and any of the jets is imposed as the background from multijet events is already low. This adds sensitivity to SUSY decay chains where the LSP is boosted along the jet direction.
VII. BACKGROUND ESTIMATION
The dominant sources of background in the single-lepton channels are the production of semi- and fully-leptonic t¯t events, and W +jets where the W decays lep-tonically. For the multi-lepton channels, the main back-ground sources are Z+jets and t¯t. Other background processes which are considered are multijets, single-top, dibosons and t¯t plus vector boson.
The major backgrounds are estimated by isolating each of them in a dedicated control region, normalizing the simulation to data in that control region, and then using
the simulation to extrapolate the background expecta-tions into the signal region. The multijet background is determined from the data by a matrix method described below. All other (smaller) backgrounds are estimated en-tirely from the simulation, using the most accurate the-oretical cross sections available (Table I). To account for the cross-contamination of physics processes across con-trol regions, the final estimate of the background is ob-tained with a simultaneous, combined fit to all control regions, as described in Sec. IX.
Several correction factors are applied to the simula-tion. The pT of the Z boson is reweighted based on a comparison of data with simulation in an event sample enriched in Z+jets events. The same correction factor is applied to W boson production and improves the agree-ment between data and simulation in the EmissT distri-bution. Other correction factors are derived during the combined fit. The relative normalization of the ALPGEN samples (W +jets, Z+jets and t¯t) with different numbers of partons (Nparton) in the matrix element is adjusted by comparing the jet multiplicity distributions in data and simulation in all control regions. A common set of cor-rections is obtained for the W +jets and Z+jets samples, and a separate set of common corrections is obtained for semi-leptonic and fully-leptonic t¯t decays. Neither the reweighting based on the pTdistribution of the Z boson nor the Nparton weights are applied in Figs. 2-4 below.
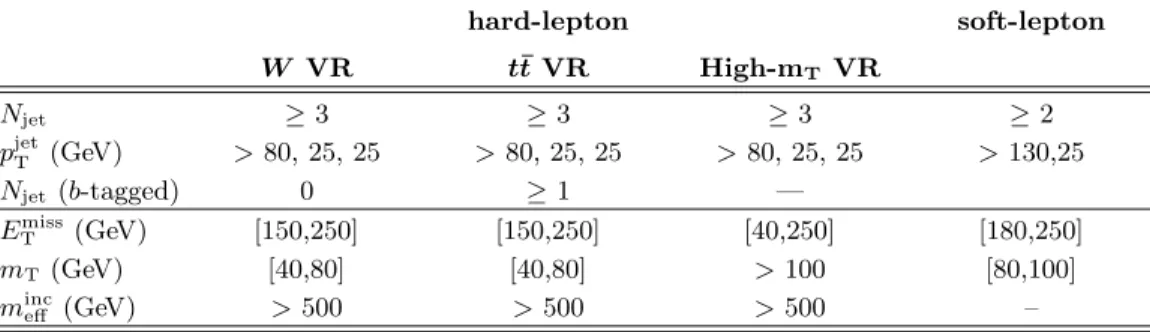
A. W/Z+jets and t¯t Control Regions
The W +jets and t¯t processes are isolated in control regions defined by the following requirements. For the hard single-lepton channel, ≥ 3 jets are required, with a leading jet pT > 80 GeV and the other jets above 25 GeV. The lepton requirements are the same as in the sig-nal region. The Emiss
T is required to be between 40 and 150 GeV while the transverse mass is required to be be-tween 40 and 80 GeV. Furthermore, the minc
eff requirement is relaxed to be > 500 GeV. The W +jets and t¯t control regions are distinguished by requirements on the number of b-tagged jets. For the W +jets control region, events are rejected if any of the three highest pTjets is b-tagged; the rejected events then define the t¯t control region. Ta-ble III summarizes the control region definitions; Fig. 2 shows the composition of the W +jets and t¯t control re-gions as a function of minc
eff and of the jet multiplicity. A discrepancy between simulation and data can be seen in the minc
eff distribution and is discussed in Sec. VII B. For the soft-lepton channel, the control region require-ments on the leptons and jets are the same as in the signal region. However, the Emiss
T is required to be be-tween 180 GeV and 250 GeV and the transverse mass to be between 40 GeV and 80 GeV. The tighter Emiss
T
re-quirement, compared to the hard single-lepton control regions, is dictated by the trigger selection for this chan-nel. Again, the W +jets and t¯t control regions are dis-tinguished by the presence of b-tagged jets. For W +jets,
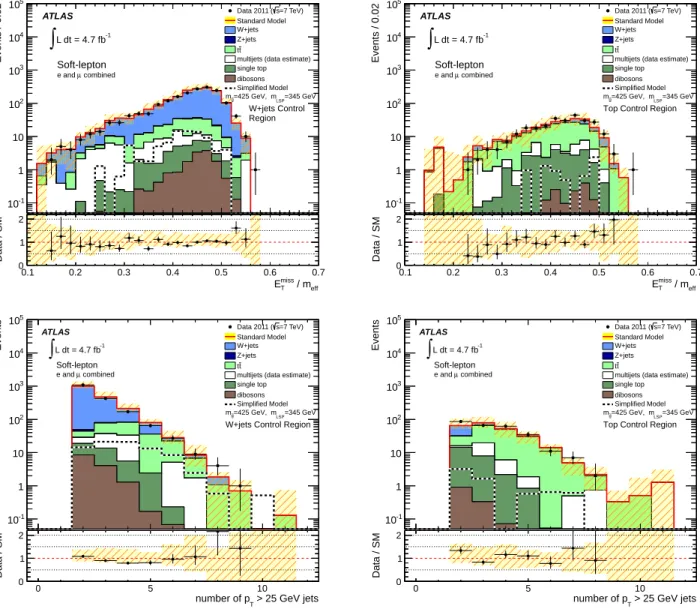
events are rejected if any of the two highest pT jets is b-tagged; the rejected events form the t¯t control region. Figure 3 shows the composition of the W +jets and t¯t con-trol regions for the soft-lepton channel as a function of Emiss
T /meff and the jet multiplicity.
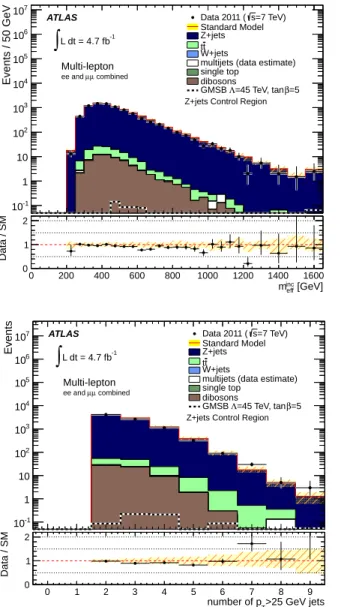
For the multi-lepton channels, the Z+jets control re-gion is defined by requiring ≥ 2 jets with the two lead-ing jets havlead-ing pT > 80 GeV and 50 GeV, respectively, or with four leading jets having pT > 50 GeV. In addi-tion, Emiss
T < 50 GeV and an opposite-sign, same-flavor dilepton pair with invariant mass between 81 GeV and 101 GeV are required. The lepton selection requirements are the same as in the signal region. The t¯t control re-gion is defined with the same jet requirements as the Z+jets control region; at least one jet is required to be b-tagged. In addition, Emiss
T between 30 GeV and
80 GeV and a dilepton invariant mass outside the win-dow [81,101] GeV are required. Figure 4 (top) shows the composition of the Z+jets and t¯t control regions for the multi-lepton channel as a function of minc
eff.
B. Reweighting of W +jets and Z+jets Simulated
Samples
The samples of simulated W +jets and Z+jets events are reweighted as a function of the generated pT of the vector boson. A common set of corrections to the pT of the vector boson, applied to both W +jets and Z+jets samples, is found to improve the agreement between data and simulation for a number of variables (ETmiss, minceff, and jet pT).
The pZ
T distribution is measured in data by selecting a sample with two oppositely-charged, same-flavor leptons with an invariant mass between 80 GeV and 100 GeV, ≥ 3 signal jets with pT >25 GeV, and minceff > 400 GeV. The pZ
T distribution in five bins of reconstructed pT is compared to the ALPGEN simulation in five bins of gen-erated pT, with the first four bins ranging from 0 to 200 GeV and the last bin integrated above 200 GeV; the ratio of the two distributions is taken as the pZ,genT -dependent weighting factor. The simulation employed here uses the cross sections listed in Table I. Only the systematic un-certainty from the jet energy scale is considered (in ad-dition to statistical uncertainties) when computing the uncertainty on the weighting factors.
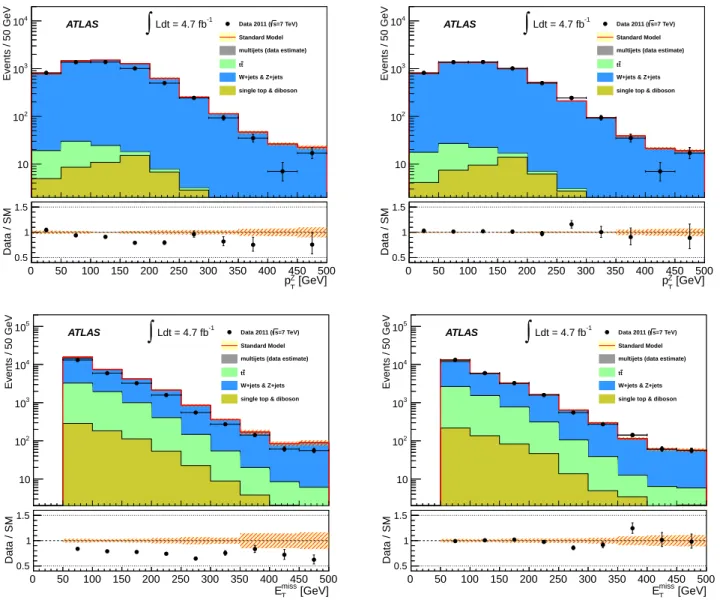
Figure 5 (top) shows the pZ
T distribution before the application of the reweighting factors and after the final fit to all background control regions (described in Sec. IX), which includes the reweighting. The bottom half of the figure shows the Emiss
T distribution in the hard-lepton W +jets control region (with the lower requirement on Emiss
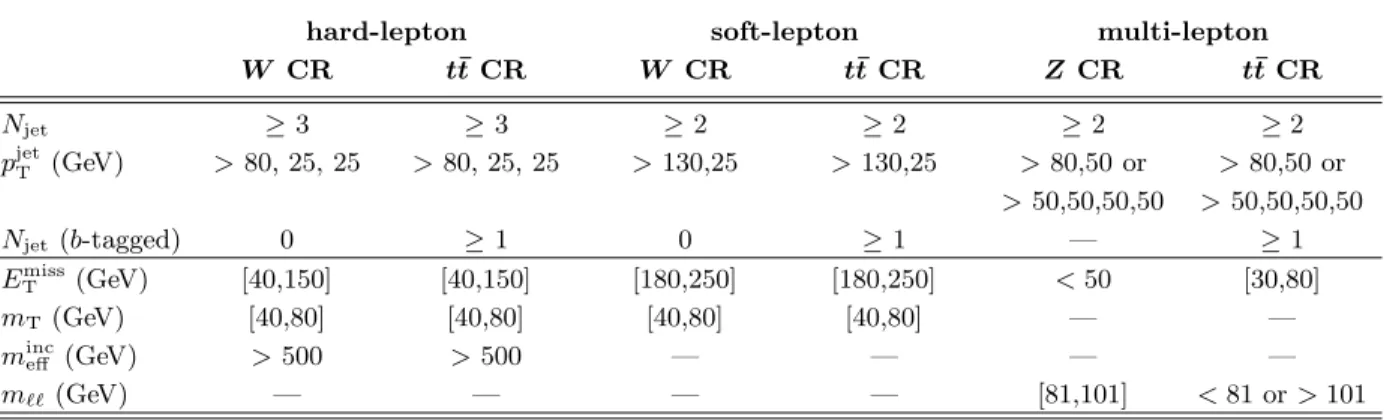
hard-lepton soft-lepton multi-lepton W CR t¯t CR W CR t¯t CR Z CR t¯t CR Njet ≥ 3 ≥ 3 ≥ 2 ≥ 2 ≥ 2 ≥ 2 pjetT (GeV) > 80, 25, 25 > 80, 25, 25 > 130,25 > 130,25 > 80,50 or > 80,50 or > 50,50,50,50 > 50,50,50,50 Njet(b-tagged) 0 ≥ 1 0 ≥ 1 — ≥ 1 Emiss T (GeV) [40,150] [40,150] [180,250] [180,250] < 50 [30,80] mT(GeV) [40,80] [40,80] [40,80] [40,80] — —
minceff (GeV) > 500 > 500 — — — —
mℓℓ(GeV) — — — — [81,101] < 81 or > 101
TABLE III. Overview of the selection criteria for the W +jets, Z+jets and t¯t control regions (CR). Only the criteria that are
different from the signal selection criteria listed in Table II are shown.
C. Multijet Background
Multijet events become a background when a jet is misidentified as an isolated lepton or when a real lepton appears as a decay product of hadrons in jets, for example from b- or c-jets, and is sufficiently isolated. In the fol-lowing, such lepton-like objects are collectively referred to as misidentified leptons. The multijet background in each signal region, and in the W +jets and t¯t control re-gions, where it is more significant, is estimated from the data following a matrix method similar to that employed in Ref. [16].
The multijet background from all sources (but sepa-rated by lepton flavor) is determined collectively. In the single-lepton channels, the multijet process is enhanced in control samples with all the signal region criteria ap-plied but where the lepton isolation criteria are not im-posed and the shower shape requirements on electrons are relaxed. Defining Npass and Nfail as the number of events in such a loose sample passing or failing the final lepton selection criteria, and defining Nreal and Nmisid. as the number of real and the number of misidentified leptons, the following equations hold:
Npass= ǫrealNreal+ ǫmisid.Nmisid.,
Nfail= (1 − ǫreal)Nreal+ (1 − ǫmisid.)Nmisid., where ǫreal is the relative identification efficiency for real leptons, and ǫmisid. is the misidentification efficiency for misidentified leptons. Solving the equations leads to:
Nmisid.pass = ǫmisid.Nmisid.= Nfail− (1/ǫreal− 1)Npass
1/ǫmisid.− 1/ǫreal .
The efficiency ǫreal is measured from data samples of Z → ℓℓ decays.
The lepton misidentification efficiency is obtained as follows. For electrons (muons) with pT > 25 (20) GeV
ǫmisid. is estimated with events containing at least one
electron (muon) satisfying the relaxed criteria, and at least one signal jet with pT > 30 (60) GeV. In addition, for the electron case, Emiss
T < 30 GeV is required. For the muon case, the event is required to contain exactly one muon with |d0|/σd0 > 5 where d0 and σd0 are the
transverse impact parameter and its uncertainty, respec-tively, measured with respect to the primary vertex. For the soft-lepton channel, the sample for deriving ǫmisid. consists of events containing a same-sign and same-flavor lepton pair where the leptons satisfy the relaxed isola-tion criteria. The selecisola-tion of a lepton pair allows the low-pT region to be studied with a large data sample. The same-sign requirement reduces the dominance of b-hadrons in the sample, providing a better mix of the dif-ferent mechanisms by which leptons can be misidentified. One of the leptons is required to fail the signal lepton criteria to further enhance the background; the misiden-tification efficiency is measured with the other lepton. An additional veto around the Z boson mass is applied. In all channels, the electron misidentification efficiency is evaluated separately for samples enhanced (depleted) in heavy-flavor contributions by requiring (vetoing) a b-tagged jet in the event.
For the multi-lepton channels, the misidentification probabilities as determined above are applied to the num-ber of events where two leptons pass the loose selection criteria. The contribution from processes where one lep-ton is real and the other misidentified has been studied in both simulation and data, using a generalization of the above matrix method to two leptons. Both methods give similar results; the final estimate is taken from the simulation.
D. Other Backgrounds
The backgrounds from single-top, diboson and t¯t+ vec-tor boson production are estimated almost purely from simulation, as is the Z+jets background for the single-lepton channels. The background from cosmic-ray muons
[GeV] inc eff m 0 200 400 600 800 1000 1200 1400 1600 1800 2000 Data / SM 0 1 2 Events / 50 GeV -1 10 1 10 2 10 3 10 4 10 5 10 6 10 7 10 -1 L dt = 4.7 fb
∫
ATLAS Hard-lepton combined µ e andW+jets Control Region =7 TeV) s Data 2011 ( Standard Model W+jets Z+jets t t
multijets (data estimate) single top Dibosons MSUGRA =300 GeV 1/2 =820 GeV, m 0 m [GeV] inc eff m 0 200 400 600 800 1000 1200 1400 1600 Data / SM 0 1 2 Events / 50 GeV -1 10 1 10 2 10 3 10 4 10 5 10 6 10 7 10 -1 L dt = 4.7 fb
∫
ATLAS Hard-lepton combined µ e andTop Control Region =7 TeV) s Data 2011 ( Standard Model W+jets Z+jets t t
multijets (data estimate) single top Dibosons MSUGRA =300 GeV 1/2 =820 GeV, m 0 m >25 GeV jets T number of p 0 2 4 6 8 10 12 Data / SM 0 1 2 Events -1 10 1 10 2 10 3 10 4 10 5 10 6 10 7 10 8 10 -1 L dt = 4.7 fb
∫
ATLAS Hard-lepton combined µ e andW+jets Control Region =7 TeV) s Data 2011 ( Standard Model W+jets Z+jets t t
multijets (data estimate) single top Dibosons MSUGRA =300 GeV 1/2 =820 GeV, m 0 m >25 GeV jets T number of p 0 2 4 6 8 10 Data / SM 0 1 2 Events -1 10 1 10 2 10 3 10 4 10 5 10 6 10 7 10 8 10 -1 L dt = 4.7 fb
∫
ATLAS Hard-lepton combined µ e andTop Control Region =7 TeV) s Data 2011 ( Standard Model W+jets Z+jets t t
multijets (data estimate) single top Dibosons MSUGRA =300 GeV 1/2 =820 GeV, m 0 m
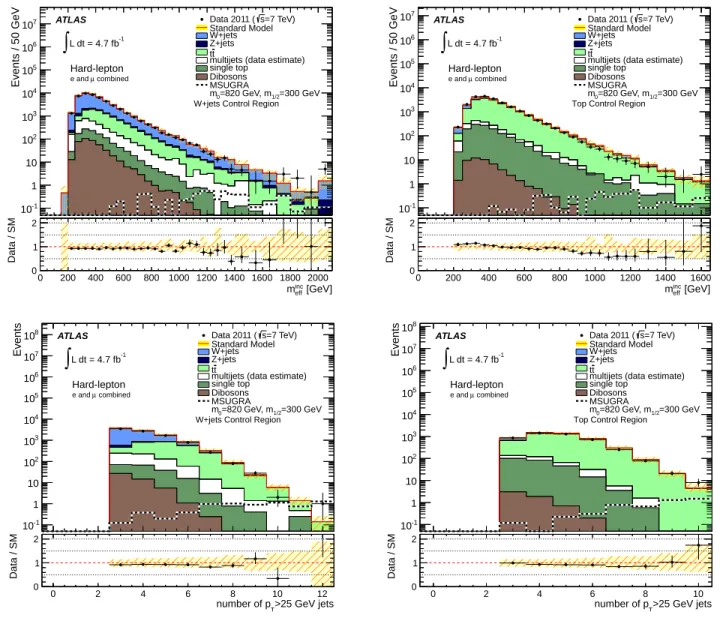
FIG. 2. Top: minc
eff distribution in the W +jets (left) and t¯t (right) control regions for data and simulation for the single
hard-lepton channels. Bottom: Distribution of the number of jets in the W +jets (left) and t¯t (right) control regions. In all plots, the
last bin includes all overflows. The electron and muon channels are combined for ease of presentation. The “Data/SM” plots show the ratio between data and the total Standard Model expectation. The expectation for multijets is derived from the data. The remaining Standard Model expectation is entirely derived from simulation, normalized to the theoretical cross sections. The uncertainty band around the Standard Model expectation combines the statistical uncertainty on the simulated event samples with the systematic uncertainties on the jet energy scale, b-tagging, data-driven multijet background, and luminosity. The systematic uncertainties are largely correlated from bin to bin. An example of the distribution for a simulated signal is also shown (not stacked); the signal point is chosen to be near the exclusion limit of the analysis in Ref. [16].
overlapping a hard-scattering event is estimated from a control sample with large z0, defined as the distance in the z direction with respect to the primary vertex, eval-uated at the point of closest approach of the muon to the primary vertex in the transverse plane. The extrapolated contribution to the signal region, |z0| < 5 mm, is found to be negligible.
VIII. SYSTEMATIC UNCERTAINTIES
Systematic uncertainties have an impact on the ex-pected background and signal event yields in the control-and signal regions. These uncertainties are treated as nuisance parameters in a profile likelihood fit described in Sec. IX. The following systematic uncertainties on the reconstructed objects are taken into account. The jet energy scale (JES) uncertainty has been determined from a combination of test beam, simulation and in-situ
Events / 0.02 -1 10 1 10 2 10 3 10 4 10 5 10 =7 TeV) s Data 2011 ( Standard Model W+jets Z+jets t t
multijets (data estimate) single top dibosons Simplified Model =345 GeV LSP =425 GeV, m g ~ m -1 L dt = 4.7 fb
∫
ATLAS Soft-lepton combined µ e and W+jets Control Region eff / m miss T E 0.1 0.2 0.3 0.4 0.5 0.6 0.7 Data / SM 0 1 2 Events / 0.02 -1 10 1 10 2 10 3 10 4 10 5 10 =7 TeV) s Data 2011 ( Standard Model W+jets Z+jets t tmultijets (data estimate) single top dibosons Simplified Model =345 GeV LSP =425 GeV, m g ~ m -1 L dt = 4.7 fb
∫
ATLAS Soft-lepton combined µ e andTop Control Region
eff / m miss T E 0.1 0.2 0.3 0.4 0.5 0.6 0.7 Data / SM 0 1 2 Events -1 10 1 10 2 10 3 10 4 10 5 10 =7 TeV) s Data 2011 ( Standard Model W+jets Z+jets t t
multijets (data estimate) single top dibosons Simplified Model =345 GeV LSP =425 GeV, m g ~ m ATLAS -1 L dt = 4.7 fb
∫
Soft-lepton combined µ e andW+jets Control Region
> 25 GeV jets T number of p 0 5 10 Data / SM 0 1 2 Events -1 10 1 10 2 10 3 10 4 10 5 10 =7 TeV) s Data 2011 ( Standard Model W+jets Z+jets t t
multijets (data estimate) single top dibosons Simplified Model =345 GeV LSP =425 GeV, m g ~ m ATLAS -1 L dt = 4.7 fb
∫
Soft-lepton combined µ e andTop Control Region
> 25 GeV jets T number of p 0 5 10 Data / SM 0 1 2
FIG. 3. Top: Emiss
T /meff distribution in the W +jets (left) and t¯t (right) control regions for data and simulation for the
soft-lepton channel. Bottom: Jet multiplicity distribution in the W +jets (left) and t¯t (right) control regions. In all distributions,
electron and muon channels are combined. The “Data/SM” plots show the ratio between data and the total Standard Model expectation. The expectation for multijets is derived from the data. The remaining Standard Model expectation is entirely derived from simulation, normalized to the theoretical cross sections. The uncertainty band around the Standard Model expectation combines the statistical uncertainty on the simulated event samples with the systematic uncertainties on the jet energy scale, b-tagging, data-driven multijet background, and luminosity. The systematic uncertainties are largely correlated from bin to bin. An example of the distribution for a simulated signal is also shown (not stacked); the signal point is near the exclusion limit of this analysis.
measurements from 2010 pp collision data [68]. Addi-tional contributions from the higher luminosity and pile-up in 2011 are taken into account. Uncertainties on the lepton identification, momentum/energy scale and resolution are estimated from samples of Z → ℓ+ℓ−
, J/ψ → ℓ+ℓ− and W±
→ ℓ±ν decays in data [63–65]. The uncertainties on the jet and lepton energies are prop-agated to the ETmiss; an additional ETmiss uncertainty arising from energy deposits not associated with recon-structed objects is also included [74]. Uncertainties on
the b-tagging efficiency are derived from dedicated data samples [75, 76], e.g. containing muons associated with jets. Uncertainties on the light-flavor mis-tag rate are de-rived by examining tracks with negative impact param-eter [77] while charm mis-tag uncertainties are obtained from data samples tagged by reconstructing D∗ mesons [78].
Uncertainties in the matrix method for the determi-nation of the multijet background include the statistical uncertainty in the number of events available in the
[GeV] inc eff m 0 200 400 600 800 1000 1200 1400 1600 Data / SM 0 1 2 Events / 50 GeV -1 10 1 10 2 10 3 10 4 10 5 10 6 10 7 10 -1 L dt = 4.7 fb
∫
ATLAS Multi-lepton combined µ µ ee andZ+jets Control Region =7 TeV) s Data 2011 ( Standard Model Z+jets t t W+jets
multijets (data estimate) single top dibosons =5 β =45 TeV, tan Λ GMSB [GeV] inc eff m 0 200 400 600 800 1000 1200 1400 Data / SM 0 1 2 Events / 50 GeV -1 10 1 10 2 10 3 10 4 10 5 10 6 10 -1 L dt = 4.7 fb
∫
ATLAS Multi-lepton combined µ µ and µ ee, eTop Control Region =7 TeV) s Data 2011 ( Standard Model Z+jets t t W+jets
multijets (data estimate) single top dibosons =5 β =45 TeV, tan Λ GMSB >25 GeV jets T number of p 0 1 2 3 4 5 6 7 8 9 Data / SM 0 1 2 Events -1 10 1 10 2 10 3 10 4 10 5 10 6 10 7 10 -1 L dt = 4.7 fb
∫
ATLAS Multi-lepton combined µ µ ee andZ+jets Control Region =7 TeV) s Data 2011 ( Standard Model Z+jets t t W+jets
multijets (data estimate) single top dibosons =5 β =45 TeV, tan Λ GMSB >25 GeV jets T number of p 0 1 2 3 4 5 6 7 8 9 Data / SM 0 1 2 Events -1 10 1 10 2 10 3 10 4 10 5 10 6 10 -1 L dt = 4.7 fb
∫
ATLAS Multi-lepton combined µ µ and µ ee, eTop Control Region =7 TeV) s Data 2011 ( Standard Model Z+jets t t W+jets
multijets (data estimate) single top dibosons =5 β =45 TeV, tan Λ GMSB
FIG. 4. Top: minc
eff distribution in the Z+jets (left) and t¯t (right) control regions for data and simulation for the
multi-lepton channels. Bottom: Distribution of the number of jets in the Z+jets (left) and t¯t (right) control regions; the last bin
includes all overflows. The ee and µµ channels are combined for Z+jets and ee, µµ and eµ channels are combined for the
t¯t distributions for ease of presentation. The “Data/SM” plots show the ratio between data and the total Standard Model
expectation. The expectation for multijets is derived from the data. The remaining Standard Model expectation is entirely derived from simulation, normalized to the theoretical cross sections. The uncertainty band around the Standard Model expectation combines the statistical uncertainty on the simulated event samples with the systematic uncertainties on the jet energy scale, b-tagging, data-driven multijet background, and luminosity. The systematic uncertainties are largely correlated from bin to bin. An example of the distribution for a simulated signal is also shown (not stacked); the signal point is chosen to be near the exclusion limit of the analysis in Ref. [72, 73].
ious control samples, the difference in misidentification efficiency for electrons from heavy- versus light-flavored jets, the dependence of the misidentification efficiency on the jet multiplicity, and the uncertainty in the sub-traction of other backgrounds from the samples used to estimate the misidentification efficiency.
Uncertainties from the identification efficiency for jets associated with the primary vertex and from the over-lay of pile-up in simulated events are both found to be
negligible.
Theoretical modeling uncertainties in the simulation include the following contributions. In previous versions of the analysis, renormalization and factorization scale uncertainties were estimated by varying the correspond-ing parameters in the ALPGEN generator by a factor of two, up and down from their nominal settings. Since these variations affect mostly the overall normalization of the cross sections for the samples with different values of
Events / 50 GeV 10 2 10 3 10 4
10 ATLAS
∫
Ldt = 4.7 fb-1 Data 2011 (s=7 TeV) Standard Model multijets (data estimate)t t W+jets & Z+jets single top & diboson
[GeV] Z T p 0 50 100 150 200 250 300 350 400 450 500 Data / SM0.5 1 1.5 Events / 50 GeV 10 2 10 3 10 4
10 ATLAS
∫
Ldt = 4.7 fb-1 Data 2011 (s=7 TeV) Standard Model multijets (data estimate)t t W+jets & Z+jets single top & diboson
[GeV] Z T p 0 50 100 150 200 250 300 350 400 450 500 Data / SM0.5 1 1.5 Events / 50 GeV 10 2 10 3 10 4 10 5 10 ATLAS -1 Ldt = 4.7 fb
∫
Data 2011 (s=7 TeV) Standard Model multijets (data estimate)t t W+jets & Z+jets single top & diboson
[GeV] miss T E 0 50 100 150 200 250 300 350 400 450 500 Data / SM0.5 1 1.5 Events / 50 GeV 10 2 10 3 10 4 10 5 10 ATLAS -1 Ldt = 4.7 fb
∫
Data 2011 (s=7 TeV) Standard Model multijets (data estimate)t t W+jets & Z+jets single top & diboson
[GeV] miss T E 0 50 100 150 200 250 300 350 400 450 500 Data / SM0.5 1 1.5
FIG. 5. Top: Distribution of the pTof the Z boson in a region enhanced in Z+jets events (ee and µµ final states combined)
before (left) the application of any reweighting factors, and after (right) the final fit to all background control regions (described
in Sec. IX). Bottom: Distribution of Emiss
T in the hard-lepton W +jets control region (electron and muon channels combined,
lower requirement on Emiss
T set to 50 GeV and upper requirement removed) before (left) application of reweighting factors and
after (right) the final fit to all background control regions. Events in the overflow bin have not been plotted.
Nparton, they are replaced here by a normalization of the
individual light-parton bins to the data (see Sec. IX). Ad-ditional generator uncertainties arise from the parameter that describes the jet pT threshold used in the match-ing (pT,min). This uncertainty is assessed by changing its default value from 15 GeV to 30 GeV; the difference is assigned as both a positive and negative uncertainty. Uncertainties arising from initial- and final-state radia-tion are taken into account by the variaradia-tion of the MLM matching parameter in multi-leg generators as well as by studying dedicated PYTHIA tunes with increased or de-creased radiation [79]. Fragmentation/hadronization un-certainties are estimated by comparing HERWIG with PYTHIA. In order to vary the heavy-flavor fraction, the cross sections for W bb+jets and W cc+jets in Table I
are scaled by 1.63 ± 0.76, while W c+jets is scaled by 1.11 ± 0.35, based on correction factors derived from data [54]. The uncertainty on Zbb+jets is taken to be ±100%. The uncertainties on the cross sections for t¯t+W and t¯t+Z are taken from the NLO calculations in Refs. [32, 33].
The uncertainty in the signal cross section is taken from an envelope of cross section predictions using dif-ferent PDF sets (including the αSuncertainty) and fac-torization and renormalization scales, as described in Ref. [80]. For the simplified models, uncertainties in the modeling of initial-state radiation play a significant role for low gluino masses and for small mass differences in the decay cascade. These uncertainties are estimated by varying generator tunes in the simulation as well as
by generator-level studies of ˜g˜g and production with an additional ISR jet generated in the matrix element with MADGRAPH5.
The impact of these systematic uncertainties on the background yields and signal estimates are evaluated via an overall fit, described in Sec. IX and X.
IX. BACKGROUND FIT
The background in the signal region is estimated with a fit based on the profile likelihood method [81]. The inputs to the fit are as follows:
1. The observed numbers of events in the W +jets (or Z+jets in the multi-lepton channels) and t¯t con-trol regions, and the numbers expected from simu-lation. These are separated into 7 jet-multiplicity bins, ranging from 3 to 9 jets for the hard-lepton channel, 8 jet multiplicity bins ranging from 2 to 9 jets for the multi-lepton channels, and 6 bins rang-ing from 2 to 7 jets for the soft-lepton channel. This information is shown in the bottom half of Fig. 2 to 4.
2. Transfer factors (TF), derived from simulation, are multiplicative factors that propagate the event counts for W +jets, Z+jets and t¯t backgrounds from one control region to another, or from one control region to the signal region. Typical values of the TFs from the control to the signal region are 10−2 and 10−4 for the soft- and hard-lepton chan-nels, respectively.
3. The number of multijet background events in all control and signal regions, as derived from the data. 4. Expectations from simulation for the number of events from the minor backgrounds (single-top, di-boson) in all control and signal regions.
For each analysis channel (hard-lepton, soft-lepton, multi-lepton) the event count in each bin of the control region is treated with a Poisson probability density func-tion. The statistical and systematic uncertainties on the expected yields are included in the probability density function as nuisance parameters, constrained to be Gaus-sian with a width given by the size of the uncertainty. Ap-proximately 150 nuisance parameters are included in the fit. Correlations in the nuisance parameters from bin to bin are taken into account where necessary. The Poisson probability density functions also include free parame-ters, for example to scale the expected contributions from the major backgrounds; these are described in more de-tail below. A likelihood is formed as the product of these probability density functions and the constraints on the nuisance parameters. Each lepton flavor (in the multi-lepton channel, each combination of flavors of the two leading leptons) is treated separately in the likelihood function. The free parameters and nuisance parameters
are adjusted to maximize the likelihood. An important difference with respect to the analysis in Ref. [16] is the increase in the number of measurements, allowing the fit to be constrained. This has been used in this analysis to constrain the nuisance parameters for the jet energy scale and the uncertainty in the ALPGEN scale param-eters from the shape information provided in the control regions.
The free parameters considered in the fit are as follows: 1. t¯t background: Each t¯t sample, broken down by
Nparton bin (from 0 to 3, with the last being
in-clusive), is scaled by a free parameter. For each
Nparton bin, a common parameter is used for
semi-leptonic and disemi-leptonic t¯t samples.
2. W/Z background: Each W +jets and Z+jets sam-ple, again broken down by Nparton bin from 2 to 5, is scaled by a free parameter. The Nparton = 6 bin for W + light-flavored jets shares its fit pa-rameter with Nparton = 5. The vector boson plus heavy-flavor samples share the same relative nor-malization parameters as the light-flavor samples. Only Npartonbins between two and five are allowed to float, as the lower multiplicity bins suffer from small numbers of events due to the jet and effective mass requirements.
The backgrounds from multijets and the sub-dominant backgrounds from single-top and diboson production are allowed to float in the fit within their respective uncer-tainties.
Notable nuisance parameters in the fit are:
1. The uncertainty in the ALPGEN MLM-matching parameter pT,min manifests itself in the relative normalization of the ALPGEN Npartonsamples and in the jet pT spectra within each sample. The change in the event counts in the array of all con-trol regions, resulting from this shift in the relative normalization, is mapped to one parameter for both W +jets and Z+jets and a separate parameter for t¯t.
2. The uncertainty in the normalization of the
Nparton= 0, 1 bins for W +jets and Z+jets, due to
uncertainties in renormalization and factorization scales, is treated by one nuisance parameter. 3. The overall normalization of the vector boson plus
heavy flavor samples is assigned a nuisance param-eter reflecting the uncertainty in the cross section. 4. The uncertainty from the fit of the pZ
T distribution is treated by assigning one nuisance parameter for each bin in true pT. Four equal-width bins are used from 0 to 200 GeV, and one bin for pT> 200 GeV. 5. The uncertainty due to the jet energy scale is con-sidered in three jet pT bins (25–40 GeV, 40–100 GeV and > 100 GeV). The resulting uncertainty in
the event counts in the array of all control regions is mapped to one nuisance parameter for each of the three jet pT bins. The usage of three jet pT bins prevents the fit from artificially over-constraining the jet energy scale.
A. Background Fit Validation
The background fit is cross-checked in a number of val-idation regions, situated between the control and signal regions, where the results of the background fit can be compared to observation. These validation regions are not used to constrain the fit. For the single hard-lepton channels, one common set of validation regions, which receives contributions from both 3- and 4-jet channels, is defined as follows:
1. The W +jets validation region is identical to the W +jets control region for the 3-jet channel ex-cept that the Emiss
T requirement is changed to 150 GeV < Emiss
T < 250 GeV (from [40, 150] GeV). 2. Similarly, the t¯t validation region is identical to the t¯t control region for the 3-jet channel except for the change in the Emiss
T requirement to 150 GeV < Emiss
T < 250 GeV (from [40, 150] GeV).
3. The high transverse mass validation region is de-fined by mT > 100 GeV and 40 GeV < ETmiss< 250 GeV. This region tests the validity of the back-ground yields from dileptonic t¯t events.
For the soft-lepton channel, the validation region is based on the sum of the W +jets and t¯t control regions but with the transverse mass selection changed to 80 GeV < mT< 100 GeV (from [40, 80] GeV).
For the multi-lepton channels, two Z+jets validation regions and two t¯t validation regions are defined:
1. The 2-jet Z+jets validation region is similar to the Z+jets control region with ≥ 2 jets, but the leading two jets are required to have pT>120 GeV (instead of 80 GeV and 50 GeV); the fourth leading jet (if present) is required to have pT<50 GeV.
2. The 4-jet Z+jets validation region is similar to the control region with ≥ 4 jets but the leading jet pT requirement is tightened to pT > 80 GeV (in-stead of 50 GeV).
3. The 2-jet t¯t validation region is similar to the t¯t control region with ≥ 2 jets but the leading two jets are required to have pT > 120 GeV (in-stead of 80 GeV and 50 GeV); the fourth leading jet (if present) is required to have pT < 50 GeV. The Emiss
T requirement is changed to 100 GeV < Emiss
T < 300 GeV.
4. The 4-jet t¯t validation region is similar to the t¯t con-trol region with ≥ 4 jets but the leading jet pT re-quirement is tightened to pT > 80 GeV (instead
of 50 GeV). The Emiss
T requirement is tightened to 80 GeV < Emiss
T < 100 GeV.
In both Z+jets validation regions the Emiss
T requirement is tightened to 50 GeV < Emiss
T < 100 GeV, and the num-ber of b-tagged jets is required to be zero in order to sup-press the t¯t contamination. The selection requirements for the validation regions are summarized in Tables IV and V for the single-lepton and multi-lepton channels, respectively.
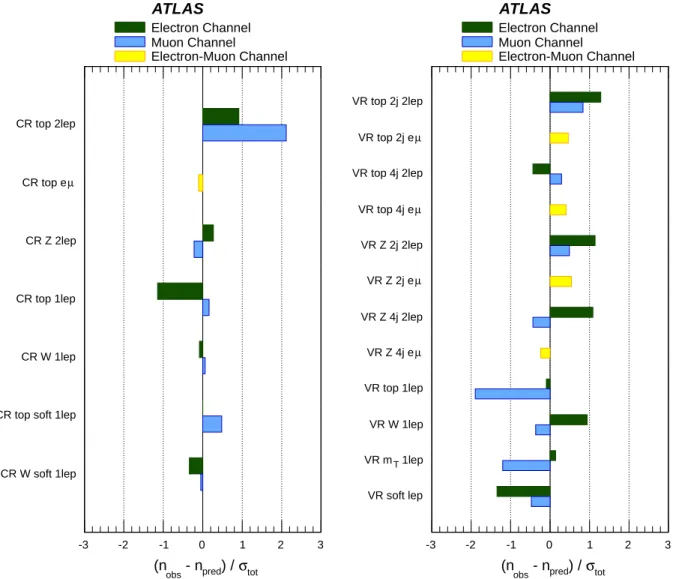
The results of the fit to the control regions, as well as the comparison of observed versus predicted event counts in the validation regions, are summarized in Fig. 6. The difference between the observed and predicted event counts is normalized by the total (statistical and systematic) uncertainty on the prediction. The agree-ment between predicted and observed yields is good.
X. RESULTS AND INTERPRETATION
The predicted background in the signal regions and the observed numbers of events are shown in Tables VI and VII. The data are consistent with SM expectations in all signal regions.
The dominant background uncertainty comes from the limited number of events in the background simulation samples in the signal region. Uncertainties on the jet energy scale and the scale uncertainties for the t¯t back-ground at high jet multiplicity are also significant. In the soft-lepton channel, an important contribution comes from the evaluation of the multijet background.
For the signal prediction, the dominant uncertainties at the highest excluded SUSY masses arise from the PDFs (30–40%) and the JES (10–20%); the former re-flect the uncertainty in the gluon distribution at high values of x. In the simplified models with small mass differences typical uncertainties from ISR variations are approximately 30%.
Model-independent limits on the visible cross section (i.e. the cross section evaluated inside a given signal re-gion) are derived by including the number of events ob-served in that region as an input to the fit and deriving an additional parameter, representing the non-SM signal strength (constrained to be non-negative), as the output of the fit. Potential signal contamination in the con-trol regions is ignored. Limits on the number of non-SM events in the signal region, derived using the CLs [82] prescription, are divided by the integrated luminosity to obtain the constraints on the visible cross section. The limits at 95% confidence level (CL) are shown in Table VIII.
For excluding specific models of new physics, the fit in the signal regions proceeds in the same way except that in this case the signal contamination in control regions is treated by providing transfer factors from the signal regions to the control regions as further input to the fit. In addition, the likelihood fit makes use of the minc
hard-lepton soft-lepton W VR t¯t VR High-mT VR Njet ≥ 3 ≥ 3 ≥ 3 ≥ 2 pjetT (GeV) > 80, 25, 25 > 80, 25, 25 > 80, 25, 25 > 130,25 Njet(b-tagged) 0 ≥ 1 — Emiss T (GeV) [150,250] [150,250] [40,250] [180,250] mT(GeV) [40,80] [40,80] > 100 [80,100] minc eff (GeV) > 500 > 500 > 500 –
TABLE IV. Overview of the selection criteria for the background validation regions (VR) for the single-lepton channels. Only the criteria that are different from the signal selection criteria listed in Table II are shown.
multi-lepton 2-jet multi-lepton 4-jet
Z VR t¯t VR Z VR t¯t VR Njet ≥ 2 ≥ 2 ≥ 4 ≥ 4 pjetT (GeV) > 120, 120 > 120, 120 > 80,50,50,50 > 80,50,50,50 Njet(b-tagged) — ≥ 1 — ≥ 1 Emiss T (GeV) [50,100] [100,300] [50,100] [80,100] mℓℓ(GeV) [81,101] < 81 or > 101 [81,101] < 81 or > 101
TABLE V. Overview of the selection criteria for the background validation regions (VR) for the multi-lepton channels. Only the criteria that are different from the signal selection criteria listed in Table II are shown. For the 2-jet validation regions, the
fourth leading jet (if present) is required to have pT< 50 GeV.
information (Emiss
T /meff for the soft-lepton channel) in the signal region as a further discriminant. Examples of these distributions are shown in Fig. 7 (the figure shows the distributions summed over lepton flavors, while the fit treats each lepton flavor channel independently). The likelihood is extended to include bin-by-bin minceff or Emiss
T /meff information by dividing the signal region into several bins of minc
eff or ETmiss/meff.
The ten statistically independent hard-lepton and multi-lepton channels are combined to set limits in the
MSUGRA/CMSSM model. For the minimal GMSB
model, only the multi-lepton channels are used. The soft-lepton channels are used together with the hard-soft-lepton and multi-lepton channels to set limits in the one- and two-step simplified models.
The limit in the plane of m1/2 versus m0 in the
MSUGRA/CMSSM model is shown in Fig. 8. The
band around the expected limit includes all uncertainties except theoretical uncertainties on the signal prediction while the band on the observed limit indicates the sen-sitivity to the theoretical uncertainties on the signal. A large improvement in exclusion coverage over the previ-ous analysis [16] can be seen. The simultaneprevi-ous fit to the ten signal regions and the inclusion of the shapes of the minceff distributions increase the expected reach in m1/2and m0by about 100 GeV, approximately uniformly across the plane. Along the line of equal masses between squarks and gluinos in the MSUGRA/CMSSM model,
masses below approximately 1200 GeV are excluded at 95% CL.
For the minimal GMSB model, the limit in the plane of tan β versus Λ is shown in Fig. 9. The exclusion reach is dominated by the dilepton plus two jets channel. Values of Λ below about 50 TeV are excluded at 95% CL for tan β < 45, improving on previous constraints.
Exclusion limits in the one-step simplified models are shown in Fig. 10. The figures also show the cross section excluded at 95% CL. The exclusion limits in the two-step simplified models are shown in Fig. 11 for gluino pair production and Fig. 12 for squark pair production. Simplified models with varying chargino mass and two-step simplified models are considered here for the first time in leptonic SUSY searches. For both one- and two-step models, for the case of low LSP masses, gluinos with masses below approximately 900–1000 GeV and squarks with masses below approximately 500–600 GeV are ex-cluded. Squark limits are considerably weaker, primarily due to the lower production cross section. Furthermore in the one-step model, gluinos with mass below 550 GeV are excluded for essentially all values of the LSP mass if the latter is more than 30 GeV smaller than the gluino mass. Care has to be taken when interpreting the simplified model limit in the context of a MSSM scenario, where the mass of the sneutrino is lighter than the mass of the left-handed slepton, as this can lead to modification of the lepton momenta.
tot σ ) / pred - n obs (n -3 -2 -1 0 1 2 3 ATLAS CR W soft 1lep CR top soft 1lep CR W 1lep CR top 1lep CR Z 2lep µ CR top e CR top 2lep Electron Channel Muon Channel Electron-Muon Channel tot σ ) / pred - n obs (n -3 -2 -1 0 1 2 3 ATLAS VR soft lep T VR m 1lep VR W 1lep VR top 1lep µ VR Z 4j e VR Z 4j 2lep µ VR Z 2j e VR Z 2j 2lep µ VR top 4j e VR top 4j 2lep µ VR top 2j e VR top 2j 2lep Electron Channel Muon Channel Electron-Muon Channel
FIG. 6. Summary of the fit results in the control regions (left) and validation regions (right). The difference between the
observed and predicted number of events, divided by the total (statistical and systematic) uncertainty on the prediction, is shown for each control and validation region.
Single-lepton Electron Muon
Number of events 3-jet 4-jet soft lepton 3-jet 4-jet soft lepton
Observed 2 4 11 1 2 14 Fitted bkg 2.3 ± 0.9 3.5 ± 0.9 14.0 ± 3.3 2.6 ± 0.8 1.5 ± 0.3 19 ± 5 Fitted top 0.4 ± 0.2 2.3 ± 0.6 3.8 ± 0.6 0.5 ± 0.2 1.3 ± 0.3 3.8 ± 0.8 Fitted W/Z+jets 1.5 ± 0.6 0.9 ± 0.2 5.8 ± 1.0 2.0 ± 0.6 0.2 ± 0.1 11.4 ± 2.3 Fitted other bkg 0.0 ± 0.0 0.0+0.3 −0.0 0.6 ± 0.1 0.1 ± 0.1 0.0 ± 0.0 0.2 ± 0.1 Fitted multijet 0.3 ± 0.4 0.3 ± 0.4 3.8 ± 2.5 0.0 ± 0.0 0.0 ± 0.0 3.6 ± 2.5 MC exp. SM 2.7 5.3 14.2 2.8 2.4 18.0 MC exp. top 0.9 3.1 4.3 0.6 2.0 3.8 MC exp. W/Z+jets 1.5 1.3 5.5 2.0 0.3 10.5 MC exp. other bkg 0.0 0.5 0.5 0.2 0.1 0.1 Data-driven multijet 0.3 0.3 3.8 0.0 0.0 3.6
TABLE VI. The observed numbers of events in the single-lepton signal regions, and the background expectations from
the fit. The inputs to the fit are also shown; these consist of the data-driven multijet background estimate and the nominal expectations from simulation (MC), normalized to theoretical cross sections. The errors shown are the statistical plus systematic uncertainties.
Multi-lepton 2-jets 4-jets
Number of events ee µµ eµ ee µµ eµ
Observed 0 0 1 8 12 18 Fitted bkg 0.3 ± 0.2 0.4 ± 0.2 0.7 ± 0.2 9.1 ± 1.5 11.7 ± 1.7 21 ± 3 Fitted top 0.1 ± 0.1 0.2 ± 0.1 0.6 ± 0.2 9.1 ± 1.4 11.1 ± 1.7 20 ± 3 Fitted W/Z+jets 0.1 ± 0.1 0.1 ± 0.0 0.0 ± 0.0 0.0 ± 0.0 0.2 ± 0.1 0.4 ± 0.1 Fitted other bkg 0.1 ± 0.1 0.1 ± 0.0 0.1 ± 0.0 0.0 ± 0.0 0.4 ± 0.1 0.6 ± 0.1 Fitted multijet 0.0 ± 0.0 0.0 ± 0.0 0.0 ± 0.0 0.0 ± 0.2 0.0 ± 0.0 0.0 ± 0.0 MC exp. SM 0.3 0.5 0.9 11.4 14.7 27.1 MC exp. top 0.2 0.3 0.7 11.1 13.9 26.0 MC exp. W/Z+jets 0.1 0.1 0.1 0.1 0.3 0.4 MC exp. other bkg 0.1 0.1 0.1 0.2 0.5 0.7 Data-driven multijet 0.0 0.0 0.0 0.0 0.0 0.0
TABLE VII. The observed numbers of events in the multi-lepton signal regions, and the background expectations from the fit. The inputs to the fit are also shown; these consist of the data-driven multijet background estimate and the nominal expectations from simulation (MC), normalized to theoretical cross sections. The errors shown are the statistical plus systematic uncertainties.