Measuring performance on the Healthcare Access and
Quality Index for 195 countries and territories and selected
subnational locations: a systematic analysis from the Global
Burden of Disease Study 2016
GBD 2016 Healthcare Access and Quality Collaborators*
Summary
Background
A key component of achieving universal health coverage is ensuring that all populations have access to
quality health care. Examining where gains have occurred or progress has faltered across and within countries is
crucial to guiding decisions and strategies for future improvement. We used the Global Burden of Diseases, Injuries,
and Risk Factors Study 2016 (GBD 2016) to assess personal health-care access and quality with the Healthcare Access
and Quality (HAQ) Index for 195 countries and territories, as well as subnational locations in seven countries, from
1990 to 2016.
Methods
Drawing from established methods and updated estimates from GBD 2016, we used 32 causes from which
death should not occur in the presence of effective care to approximate personal health-care access and quality by
location and over time. To better isolate potential effects of personal health-care access and quality from underlying
risk factor patterns, we risk-standardised cause-specific deaths due to non-cancers by location-year, replacing the local
joint exposure of environmental and behavioural risks with the global level of exposure. Supported by the expansion
of cancer registry data in GBD 2016, we used mortality-to-incidence ratios for cancers instead of risk-standardised
death rates to provide a stronger signal of the effects of personal health care and access on cancer survival. We
transformed each cause to a scale of 0–100, with 0 as the first percentile (worst) observed between 1990 and 2016, and
100 as the 99th percentile (best); we set these thresholds at the country level, and then applied them to subnational
locations. We applied a principal components analysis to construct the HAQ Index using all scaled cause values,
providing an overall score of 0–100 of personal health-care access and quality by location over time. We then compared
HAQ Index levels and trends by quintiles on the Socio-demographic Index (SDI), a summary measure of overall
development. As derived from the broader GBD study and other data sources, we examined relationships between
national HAQ Index scores and potential correlates of performance, such as total health spending per capita.
Findings
In 2016, HAQ Index performance spanned from a high of 97·1 (95% UI 95·8–98·1) in Iceland, followed by
96·6 (94·9–97·9) in Norway and 96·1 (94·5–97·3) in the Netherlands, to values as low as 18·6 (13·1–24·4) in
the Central African Republic, 19·0 (14·3–23·7) in Somalia, and 23·4 (20·2–26·8) in Guinea-Bissau. The pace of
progress achieved between 1990 and 2016 varied, with markedly faster improvements occurring between 2000 and
2016 for many countries in sub-Saharan Africa and southeast Asia, whereas several countries in Latin America and
elsewhere saw progress stagnate after experiencing considerable advances in the HAQ Index between 1990 and 2000.
Striking subnational disparities emerged in personal health-care access and quality, with China and India having
particularly large gaps between locations with the highest and lowest scores in 2016. In China, performance ranged
from 91·5 (89·1–93·6) in Beijing to 48·0 (43·4–53·2) in Tibet (a 43·5-point difference), while India saw a 30·8-point
disparity, from 64·8 (59·6–68·8) in Goa to 34·0 (30·3–38·1) in Assam. Japan recorded the smallest range in
subnational HAQ performance in 2016 (a 4·8-point difference), whereas differences between subnational locations
with the highest and lowest HAQ Index values were more than two times as high for the USA and three times as high
for England. State-level gaps in the HAQ Index in Mexico somewhat narrowed from 1990 to 2016 (from a 20·9-point
to 17·0-point difference), whereas in Brazil, disparities slightly increased across states during this time (a 17·2-point
to 20·4-point difference). Performance on the HAQ Index showed strong linkages to overall development, with high
and high-middle SDI countries generally having higher scores and faster gains for non-communicable diseases.
Nonetheless, countries across the development spectrum saw substantial gains in some key health service areas from
2000 to 2016, most notably vaccine-preventable diseases. Overall, national performance on the HAQ Index was
positively associated with higher levels of total health spending per capita, as well as health systems inputs, but these
relationships were quite heterogeneous, particularly among low-to-middle SDI countries.
Interpretation
GBD 2016 provides a more detailed understanding of past success and current challenges in improving
personal health-care access and quality worldwide. Despite substantial gains since 2000, many low-SDI and
middle-SDI countries face considerable challenges unless heightened policy action and investments focus on advancing
Lancet 2018; 391: 2236–71
Published Online
May 23, 2018 http://dx.doi.org/10.1016/ S0140-6736(18)30994-2 See Comment page 2190 *Collaborators listed at end of
the Article Correspondence to: Prof Rafael Lozano, Institute for Health Metrics and Evaluation, University of Washington, Seattle, WA 98121, USA
access to and quality of health care across key health services, especially non-communicable diseases. Stagnating or
minimal improvements experienced by several low-middle to high-middle SDI countries could reflect the complexities
of re-orienting both primary and secondary health-care services beyond the more limited foci of the Millennium
Development Goals. Alongside initiatives to strengthen public health programmes, the pursuit of universal health
coverage hinges upon improving both access and quality worldwide, and thus requires adopting a more comprehensive
view—and subsequent provision—of quality health care for all populations.
Funding
Bill & Melinda Gates Foundation.
Copyright
© 2018 The Author(s). Published by Elsevier Ltd. This is an Open Access article under the CC BY 4.0 license.
Introduction
Providing access to quality health care is among
the foremost objectives of health systems,
1,2because the
receipt of effective personal health care can substantially
improve many health outcomes and avert premature
mortality. The advancement of population health was
elevated to global agendas with the Alma Ata Declaration
of 1978, wherein WHO called for the achievement of
“health for all” by 2000.
3Such aspirations garnered new
momentum in the Sustainable Development Goal (SDG)
Research in context
Evidence before this study
Improving, and subsequently measuring, health-care access and
quality has emerged as an increasing priority alongside a
heightened emphasis on universal health coverage in the
Sustainable Development Goal era. Nevertheless, few studies
have sought to assess personal health-care access and quality
across a wide range of key health service dimensions and the
development spectrum. Primarily focused on high-income
countries, past analyses have used amenable mortality—deaths
from causes that should not occur in the presence of high-quality
health care—to approximate national levels of personal
health-care access and quality. Drawing from the Global Burden
of Diseases, Injuries, and Risk Factors Study 2015 (GBD 2015),
the GBD collaboration used this amenable mortality framework
in developing the Healthcare Access and Quality (HAQ) Index,
and subsequently offered several advances from previous work.
First, the extensive cause-of-death standardisation processes that
occur as part of GBD enabled better comparisons across locations
and over time. Second, risk-standardising death rates for
environmental and behavioural risk factors helped isolate
differences in health-care access and quality from variations in
death rates due to background risk exposure. Third, estimating
the HAQ Index for 195 countries and territories from
1990 to 2015, allowed for a broader investigation of trends in
personal health-care access and quality across the development
spectrum. Despite these methodological strengths, additional
areas for improvement were identified, including the
consideration of health outcomes that more directly reflect the
progression of disease onset to mortality for amenable causes
and examining subnational inequalities.
Added value of this study
Based on updated cause of death and risk factor estimates from
the GBD 2016 study, our analysis offers an improved
assessment of national levels of personal health-care access and
quality from 1990 to 2016. For the first time, we report
subnational levels and trends on the HAQ Index for
seven countries: Brazil, China, England, India, Japan, Mexico,
and the USA. Because of major improvements in cancer
estimation and data availability, we used mortality-to-incidence
ratios rather than risk-standardised death rates from cancer,
ultimately providing a more robust approximation of cancer
detection and treatment effects across countries. To improve
index stability, we used percentiles (ie, first and 99th percentile)
for transforming HAQ Index components to a scale of 0–100.
Finally, we did an exploratory analysis of national HAQ Index
levels and potential correlates of performance, examining
relationships between the HAQ Index and some indicators such
as health financing (eg, total health spending per capita).
Implications of all the available evidence
Globally, personal health-care access and quality improved since
1990, with many countries in sub-Saharan Africa and southeast
Asia accelerating their pace of progress from 2000 to 2016. Such
gains in the more recent time period could reflect the catalytic
effects of the Millennium Development Goals and their focus on
a subset of health service areas (ie, vaccine-preventable diseases,
infectious diseases, and maternal and child health).
Nonetheless, inequalities increased in some parts of the world,
which might be related to many low-to-middle income
countries recording much slower gains for cancers and other
non-communicable diseases. Large disparities in subnational
levels of personal health-care access and quality emerged for
several countries, especially China and India. These results
emphasise the urgent need to improve both access to and
quality of health care across service areas and for all populations;
otherwise, health systems could face widening gaps between
the health services they provide and the disease burden
experienced by local communities. Going forward, the HAQ
Index can provide a robust measure for both informing and
monitoring the effects of policy action on health-care access and
quality, a key component of achieving universal health coverage.
To deliver health systems for the next generation and hasten
progress in the Sustainable Development Goal era, now is the
time to align investments for improving access and quality
across the full range of health-care needs.
era,
4with a heightened emphasis on attaining universal
health coverage in this pursuit. Making progress on
universal health coverage entails all people having access
to quality health services they need without incurring
financial hardship.
5To advance toward this ambition, it is
crucial to monitor where improvements in health-care
access and quality have occurred, and where progress
must be accelerated, across the development spectrum.
Measuring health-care access and quality has become
an increasingly important priority alongside its ascent in
global health policy. In particular, the use of amenable
mortality—deaths from causes that should not occur in
the presence of effective medical care—to approximate
national levels of personal health-care access and quality
has gained greater traction.
6–15Amenable mortality
metrics are thought to provide a strong signal of what
can or should be addressed by the receipt of effective
health care, and thus perform ance on overall personal
health-care access and quality. Combining such measures
with those capturing avertable or preventable health
outcomes (ie, burden that can be avoided through public
health programmes or policies implemented outside the
immediate health sector) can offer a more complete set
of potential pathways for improving health.
1,16The Nolte
and McKee list of causes amenable to health care
6–9remains the most widely used framework to quantify
national levels of health-care access and quality on the
basis of amenable mortality. This is particularly true for
Europe,
11,15,17the Organisation for Economic Co-operation
and Development (OECD),
12and the USA,
13but
in-creasingly also for other country-specific analyses (eg,
Brazil,
14China,
18and Mexico
19). As part of the Global
Burden of Diseases, Injuries, and Risk Factors Study 2015
(GBD 2015),
20the GBD collaboration applied this
framework to develop a novel measure, the Healthcare
Access and Quality (HAQ) Index, to track gains and gaps
in personal health-care access and quality in 195 countries
and territories over time.
The HAQ Index offered several strengths and
in-sights into personal health-care access and quality
across countries, which has prompted calls for further
improvements. First, 32 causes considered amenable
to health care comprise the HAQ Index, representing
a range of health service areas: vaccine-preventable
diseases; infectious diseases and maternal and child
health; non-communicable diseases, including cancers,
cardiovascular diseases, and other non-communicable
diseases such as diabetes; and gastro
intestinal
con-ditions from which surgery can easily avert death
(eg, appendicitis). Other than in high-income countries,
past research rarely accounts for this array of services,
21even though effective preventive interventions, treat ment,
and medical technologies exist; instead, these studies
often focus on infectious diseases and maternal and child
health, and do not shed light on potential challenges
across service areas. Second, because GBD quantifies risk
exposure and risk-attributable deaths, we could account
for local variations in risk exposure and better isolate
differ ences in mortality related to health care. Nonetheless,
challenges can still exist in ensuring that these
mea-sures provide a strong signal on health-care access and
quality. For instance, in the absence of stronger
monitor-ing systems, low rates of cancer mortality could
actually represent inadequate detection and treatment of
cancer rather than good access to cancer screening and
high-quality care.
22Third, although some insights into
the relationship between the HAQ Index and
socio-demographic development were explored in GBD 2015,
20further examination of how health financing and system
measures are related to the HAQ Index has yet to occur.
Fourth, considerable debate continues about how well the
current cause list represents the range of causes amenable
to health care, particularly non-fatal outcomes, as well as
the ages at which health care can substantially
im-prove outcomes. Finally, GBD 2015 highlighted sizeable
in equalities across countries
20but did not capture
sub-national differences in personal health-care access and
quality, a crucial need in light of the magnitude by which
health outcomes can vary within countries.
23–30In this study, we provide updated estimates from
1990 to 2016 for the HAQ Index in 195 countries and
territories, as well as at global and regional levels. For the
first time, we report subnational estimates of the HAQ
Index for seven countries, allowing for a more in-depth
examination of inequalities in personal health-care
access and quality. With the improved estimation of
cancers in GBD 2016,
31–33we use mortality-to-incidence
ratios (MIRs)
for cancers to better reflect potential
differences in cancer diagnostic and treatment capacity
across locations. Finally, we do an exploratory analysis of
the associations between the HAQ Index and potential
correlates of performance.
Methods
Overview
Drawing from methods established in GBD 2015,
20our
analysis involved four steps: mapping the Nolte and
McKee cause list to GBD causes; constructing MIRs for
cancers and risk-standardising non-cancer deaths to
remove variations in mortality not directly amenable to
health care; calculating the HAQ Index on the basis of
principal components analysis (PCA), providing an
overall score of personal health-care access and quality
on a scale of 0–100; and examining associations between
national HAQ Index scores and potential correlates
of performance.
Our study draws from GBD 2016 results,
31–33which
entail several improvements since GBD 2015, including
169 new country-years of vital registration data, 528 new
cancer-registry years with a total of 92 countries’ cancer
registries,
31five new risk factors,
32and cause-specific
mortality modelling updates (eg, cancers, tuberculosis).
31Further information can be found in the appendix
(pp 12–89) and the GBD 2016 capstone series.
31–33In addition to national and aggregated HAQ Index
results, we report estimates at the subnational level
for Brazil (26 states and the Federal District), China
(33 provinces and special administrative regions), England
(nine regions and 150 local government areas), India
(31 states and union territories), Japan (47 prefectures),
Mexico (32 states), and the USA (50 states and the
District of Columbia).
As with all GBD revisions, GBD 2016 HAQ Index
estimates for the full time series published here
supersede previous iterations. This analysis complies
with the Guidelines for Accurate and Transparent Health
Estimates Reporting (GATHER);
34additional information
is found in the appendix (pp 5–7).
Mapping the Nolte and McKee amenable cause list to
GBD causes
We mapped 32 of 33 causes from the Nolte and McKee
cause list
6–9to GBD causes in accordance with International
Classification of Diseases codes (table 1; appendix p 156).
GBD includes thyroid diseases within a larger residual
category, and only non-fatal outcomes are estimated for
benign prostatic hyperplasia; consequently, these causes
were not included in our analyses. GBD provides separate
estimates for diphtheria and tetanus, so we disaggregated
these causes from the original Nolte and McKee list.
Mortality-to-incidence ratios for cancers
GBD cancer mortality estimates are informed by MIRs,
which are derived from incidence and mortality data
recorded in cancer registries; more detail on MIR
estimation is in the appendix (pp 41–49).
31MIRs provide a
good approximation of cancer survival and have been
used to identify countries with higher or lower cancer
mortality relative to incidence.
22,35Because of the
improved quantity and quality of cancer registry data
from GBD 2016, we used cancer-specific MIRs instead of
risk-standardised death rates. As detailed in the appendix
(pp 10–11), cancer-specific MIRs were more strongly
correlated with the Socio-demographic Index (SDI),
a measure of overall development, than were
risk-standardised death rates. These results, and the
dis-tribution of MIRs by SDI quintile (appendix pp 96–111),
showed that cancer MIRs provide a more robust signal of
cancer care access and quality than do risk-standardised
death rates.
Risk-standardisation of death rates for non-cancer causes
To better isolate differences in mortality associated with
health-care access and quality from differences associated
with underlying risk exposure, we risk-standardised
cause-specific deaths to global levels of risk exposure.
32We did not risk-standardise differences in exposure to
three metabolic risk factors (high systolic blood pressure,
high total cholesterol, and high fasting plasma glucose)
given their amenability to health care (eg, diagnosis and
treat ment of hypertension in primary care). For the
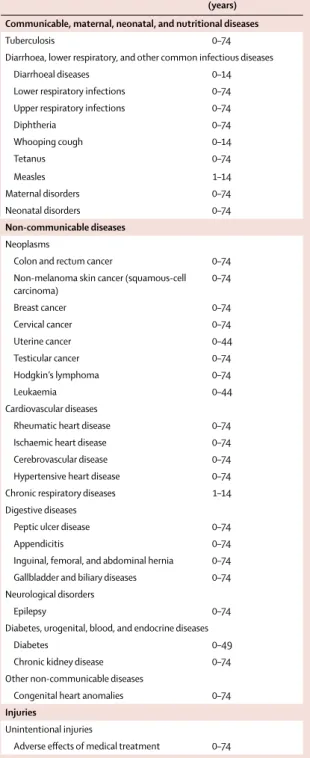
Amenable age range (years)
Communicable, maternal, neonatal, and nutritional diseases
Tuberculosis 0–74
Diarrhoea, lower respiratory, and other common infectious diseases
Diarrhoeal diseases 0–14
Lower respiratory infections 0–74
Upper respiratory infections 0–74
Diphtheria 0–74 Whooping cough 0–14 Tetanus 0–74 Measles 1–14 Maternal disorders 0–74 Neonatal disorders 0–74 Non-communicable diseases Neoplasms
Colon and rectum cancer 0–74
Non-melanoma skin cancer (squamous-cell
carcinoma) 0–74 Breast cancer 0–74 Cervical cancer 0–74 Uterine cancer 0–44 Testicular cancer 0–74 Hodgkin’s lymphoma 0–74 Leukaemia 0–44 Cardiovascular diseases
Rheumatic heart disease 0–74
Ischaemic heart disease 0–74
Cerebrovascular disease 0–74
Hypertensive heart disease 0–74
Chronic respiratory diseases 1–14
Digestive diseases
Peptic ulcer disease 0–74
Appendicitis 0–74
Inguinal, femoral, and abdominal hernia 0–74 Gallbladder and biliary diseases 0–74 Neurological disorders
Epilepsy 0–74
Diabetes, urogenital, blood, and endocrine diseases
Diabetes 0–49
Chronic kidney disease 0–74
Other non-communicable diseases
Congenital heart anomalies 0–74
Injuries
Unintentional injuries
Adverse effects of medical treatment 0–74
Although 0 (at birth) to 1 are listed as the lower bound of age ranges, age restrictions are applied for many causes such that mortality estimates are not produced before a given age group (eg, 15–19 years for many non-communicable diseases). Causes are ordered on the basis of the GBD cause list and corresponding group hierarchies. GBD=Global Burden of Disease.
Table 1: Causes for which mortality is amenable to health care, mapped to GBD causes, and amenable age range
24 non-cancer causes, we risk-standardised deaths by
re-moving the joint effects of location-specific behavioural
and environmental risk exposure, and replaced these
estimates with the global level of joint risk exposure
(appendix pp 9–10).
Joint population attributable fraction (PAF) estimation
accounts for effects of multiple risks combined, including
the mediation of different risk factors through each
other. More detail on the PAF calculations and
risk-standardisation is provided in the appendix (pp 9–10).
Since GBD 2015,
36five risk factors were added,
most notably low birthweight and short gestation,
32which enabled the risk-standardisation of neonatal
dis-order deaths. Risk-standardised deaths equalled observed
deaths for causes in which no risk–outcome pairs
have met evidence thresholds for inclusion in GBD
(eg, diphtheria, appendicitis).
Age-standardisation
Using the GBD world population data,
37we
age-standardised risk-age-standardised death rates, as well
as cancer mortality and incidence estimates, before
pro-ducing MIRs. We rescaled age weights to equal 1, by
cause, a necessary step since included age groups
rep-resented a subset of the age groups comprising the world
population standard.
Constructing the HAQ Index
By cause, we log-transformed age-standardised
risk-standardised death rates (or MIRs for cancers) and scaled
them from 0 to 100 across locations from 1990–2016.
Zero was determined by the first percentile observed (ie,
highest death rates or MIRs), and 100 was applied to the
99th percentile (ie, lowest death rates or MIRs). This
scaling approach differs somewhat from that of
GBD 2015,
20wherein maximum values determined zero
and mini mum values set 100. Using a percentile-based
approach more closely aligns with other index
con-struction methods used in GBD,
38and is less sensitive to
outliers or fluctuations in estimates over time. We then
applied cause-specific thresholds set by the national level
to subnational locations.
We used PCA to construct the HAQ Index on the basis
of scaled cause values, resulting in an overall score on a
scale of 0–100. The GBD 2016 HAQ Index differed in
three main ways from GBD 2015. First, no cause had
negative PCA weights (ie, implying that higher death
rates were associated with access to higher-quality health
care), so all causes contributed to the final index. In GBD
2015, colon and breast cancers had negative PCA weights
in the first PCA iteration, so their weights were ultimately
set to zero. Second, some cancers had PCA weights more
similar to communicable, maternal, and neonatal causes,
which meant these causes were weighted more equally
(appendix p 157). Finally, we derived PCA weights from
country-level estimates and applied them to subnational
results; this approach provides greater stability across
GBD iterations, particularly as the GBD continues to
expand its subnational assessments.
Examining correlates of HAQ Index performance
The HAQ Index reflects many factors that affect service
access and quality across the continuums of care and
therapeutic areas, and thus it is challenging to distinguish
the unique contribution of access versus quality from
other potential drivers.
39To provide an initial examination
of correlates with HAQ Index performance, we ran
Pearson correlations between location-specific HAQ
Index values with financial measures (eg, total health
spending per capita),
40and health system inputs and
outputs (eg, outpatient and inpatient utilisation).
33We
selected these indicators on the basis of data availability
in relation to GBD locations, and thus they do not
represent all possible correlates.
Comparing performance on the HAQ Index across the
development spectrum
As well as examining global patterns, we report
differ-ences in the HAQ Index across levels of development. To
do this, we used SDI, a summary measure of overall
develop ment based on average income per capita,
edu-cational attainment, and total fertility rates.
41Countries are
grouped by SDI quintiles, as established in GBD 2016, on
the basis of their 2016 SDI values.
31Uncertainty analysis
GBD aims to propagate uncertainty throughout its
estimation process, which results in uncertainty intervals
(UIs) accompanying each estimate. We estimated the
HAQ Index for each location-year on the basis of
1000 draws from the posterior distribution for each
included cause of death. 95% UIs were based on the
2·5th and 97·5th quantiles of the draws for each measure.
Role of the funding source
The funder of the study had no role in study design, data
collection, data analysis, data interpretation, or writing of
the report. The corresponding author had full access to
all the data in the study and had final responsibility for
the decision to submit for publication.
Results
National and subnational patterns in personal
health-care access and quality
The HAQ Index performance followed distinct
geo-graphical patterns in 2016 (figure 1), with most countries
in the highest decile clustered in Europe or nearby
(ie, Iceland), and almost all countries in the lowest decile
located in sub-Saharan Africa. Exceptions to this pattern
included Canada, Japan, Australia, and New Zealand in
the tenth decile, and Afghanistan in the first decile.
More heterogeneity emerged among the next deciles of
performance
(eg, USA, UK, Malta, Lebanon, Singapore,
and South Korea, in the ninth decile; Cuba, Chile,
Saudi Arabia, and Russia, in the eighth decile).
Most Latin American countries scored between
the fourth and sixth deciles, whereas southeast Asia
fea-tured a broader range, spanning from the seventh
(Thailand and Sri Lanka) to third deciles (Cambodia,
Indonesia, Laos, Myanmar, and Timor-Leste). By 2016,
many sub-Saharan African coun tries improved their
performance from 1990 and 2000 (appendix pp 113–14),
such as South Africa and Botswana rising to the
fourth decile, and several locations moving to the third
decile (eg, Kenya, Rwanda, Namibia, Nigeria, Ghana).
African countries that remained in the first decile since
1990 were generally concentrated in central and eastern
sub-Saharan Africa.
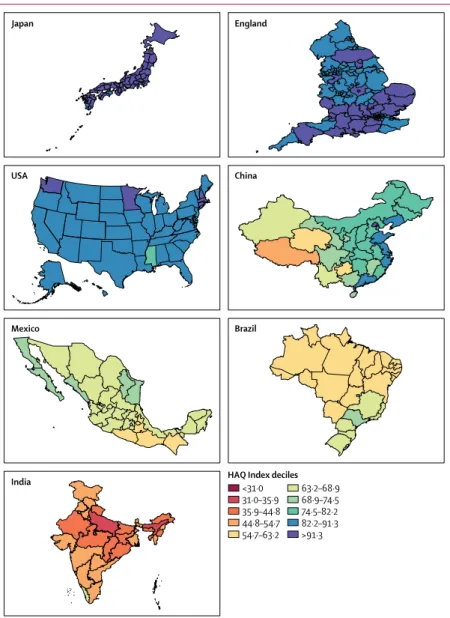
We applied the deciles set by national HAQ Index scores
in 2016 to subnational locations (figure 2), and a more
nuanced landscape surfaced regarding inequalities in
personal health-care access and quality. China was in the
eighth decile in 2016, and had provinces spanning from
the tenth decile (Beijing 91·5, 95% UI 89·1–93·6) to the
fourth decile (Tibet 48·0, 43·5–53·2), with a higher
performance (ie, eighth and ninth deciles) among eastern
provinces and lower (ie, fifth and sixth deciles) in western
provinces. For India, which was in the third decile in 2016,
subnational performance ranged from the sixth (Goa 64·8,
59·6–68·8; Kerala 63·9, 58·6–67·0) to the second deciles
(Assam 34·0, 30·3–38·1; and Uttar Pradesh 34·9,
31·1–38·4). Brazil and Mexico, each in the sixth decile
nationally for 2016, had variable subnational patterns. In
Brazil, performance was as high as the eighth decile for
the Federal District (75·4, 72·3–78·1), but most states,
particularly northern ones, were in the fifth decile.
Conversely, Mexico featured six states in the seventh decile,
whereas most others were in the sixth decile; four states,
all along Mexico’s southern border, fell within the
fifth decile. Both occupying the ninth decile nationally,
England and the USA had subnational locations spanning
from the tenth to seventh deciles in 2016; Blackpool
(79·7 [76·6–82·8]) had the lowest HAQ Index score in
England and Mississippi (81·5 [78·6–84·2]) had the lowest
score in the USA. The USA’s highest HAQ Index scores
were limited to a subset of northeastern states, Minnesota,
and Washington state, and higher performance was
primarily dispersed across southern England. Nearly all
Japanese prefectures occupied the top decile of HAQ
Index performance in 2016. The appendix contains a more
in-depth exploration of subnational trends over time by
country (pp 115–28).
Patterns of performance on the overall HAQ Index and
health areas varied considerably across countries in
Figure 1: Map of HAQ Index values, by decile, in 2016Deciles are based on the distribution of HAQ Index values in 2016. Where lower and upper bounds of deciles appear to overlap, they should be interpreted as values up to but not equalling the upper bound in the preceding decile (ie, exclusive of the upper bound value) and values equalling the lower bound of the following decile (ie, inclusive of the lower bound value). HAQ Index=Healthcare Access and Quality Index. ATG=Antigua and Barbuda. VCT=Saint Vincent and the Grenadines. LCA=Saint Lucia. TTO=Trinidad and Tobago. FSM=Federated States of Micronesia. TLS=Timor-Leste.
Persian Gulf Caribbean LCA Dominica ATG TTO Grenada VCT TLS Maldives Barbados Seychelles Mauritius Comoros
West Africa Eastern Mediterranean
Malta
Singapore Balkan Peninsula Tonga
Samoa FSM Fiji Solomon Isl Marshall Isl Vanuatu Kiribati <31·0 31·0–35·9 35·9–44·8 44·8–54·7 54·7–63·2 63·2–68·9 68·9–74·5 74·5–82·2 82·2–91·3 >91·3
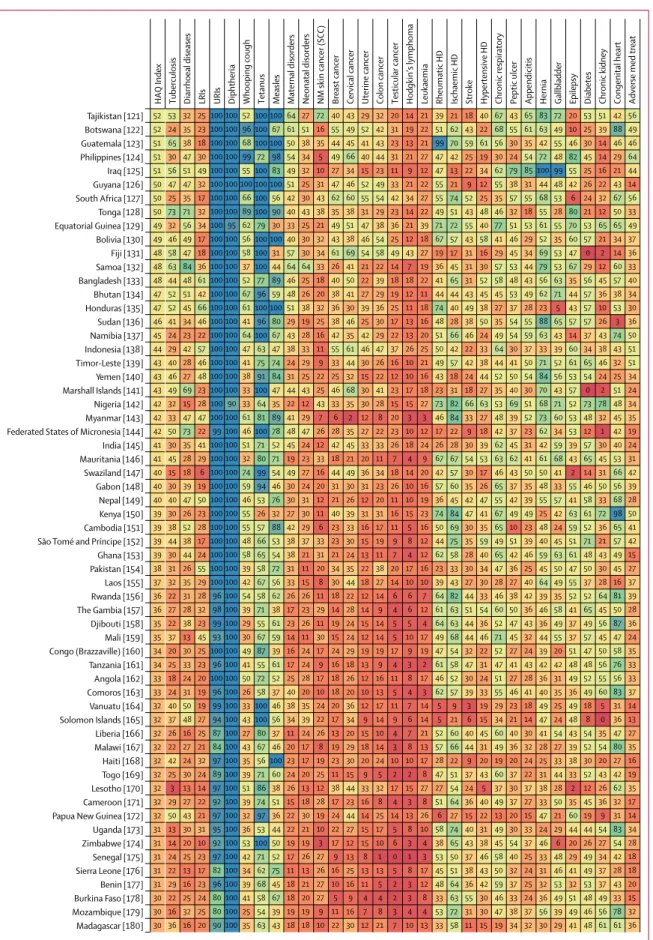
2016 (figure 3). Locations that scored approximately 90 or
higher on the HAQ Index had generally high scores
across broader causes, including vaccine-preventable
dis-eases, infectious diseases and maternal and child health,
and causes that require complex case management
(eg, epilepsy, diabetes, and chronic kidney disease).
Nonetheless, many of these countries had lower scores
for cancers and some non-communicable diseases.
Greater heterogeneity occurred across causes for countries
that scored below 90 on the HAQ Index, though many
locations achieved greater consistency, and high scores,
for vaccine-preventable diseases and gastrointestinal
causes for which surgery could avert death. For these
countries, a mixture of relatively low values on cancers
and some non-communicable diseases, and then
comparably better performance on other health areas, was
commonplace. Among countries with lower HAQ Index
scores in 2016 (ie, lower than approximately 50), most
fared poorly across health areas and recorded particularly
low scores on cancers, some infectious causes like
tuberculosis, and maternal and child health. Nonetheless,
many still exceeded a score of 90 for some causes
(eg, diphtheria, upper respiratory infections).
Progress on personal health-care access and quality
Although global gaps between the highest and low est
HAQ Index values slightly widened over time (from 76·4 in
1990 to 78·5 in 2016), changes by SDI quintile showed
more diverse trends (figure 4A). Low-middle-SDI countries
saw some differences increase since 1990, with HAQ
Index scores ranging from 29·0 to 67·2 by 2016.
Conversely, disparities considerably narrowed among
middle-SDI countries from 1990 (a 46·8-point difference)
to 2016 (a 30·6-point difference). Among countries with
subnational HAQ Index estimates (figure 4B), there was
variation in when and how much local inequalities
changed. In the USA, state-level differences decreased
since 1990, but then comparably little progress occurred
from 2000 to 2016. On the other hand, in Japan, absolute
differences between prefectures narrowed to a 4·8-point
difference between 2000 and 2016. In England, disparities
slightly increased since 1990, from a 13·7-point difference
in 1990, to a 16·9-point difference in 2016. China’s overall
gains quickened since 2000, though absolute differences
between Chinese provinces remained high in 2016
(a 43·5-point gap). Mexico’s progress on the HAQ Index
was much faster from 1990 to 2000, than from 2000 to 2016,
although absolute inequalities somewhat narrowed by
2016 (ie, a 20·9-point difference to a 17·0-point difference).
Brazil’s state-level disparities slightly widened after 2000,
rising from an absolute difference of 17·2 in 1990,
to 20·4 in 2016. However, compared with Mexico, Brazil’s
overall progress was more consistent across time periods.
Although India’s improvements on the HAQ Index
hastened from 2000 to 2016, the gap between the country’s
highest and lowest scores widened (23·4-point difference
in 1990, and 30·8-point difference in 2016).
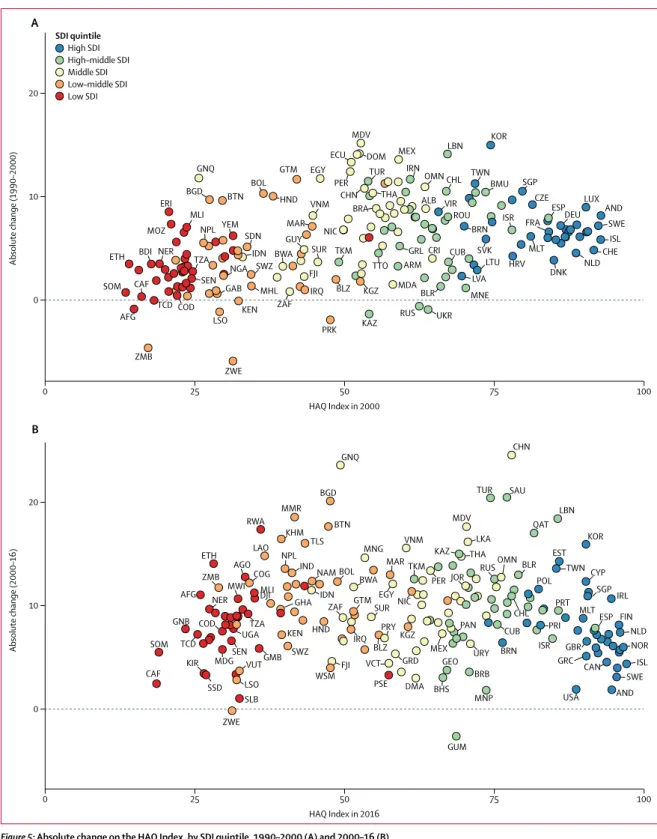
From 1990 to 2016, 186 of 195 countries and territor ies
significantly increased their HAQ Index score, with
several middle-SDI countries, including China, the
Maldives, Equatorial Guinea, Peru, and Thailand
achiev-ing among the most pronounced gains (table 2;
appendix p 130). South Korea, Taiwan (Province of China),
and Cyprus
recorded the largest improvements among
high-SDI countries, and Lebanon, Turkey, and Saudi
Arabia had the most progress for high-middle-SDI
countries. For many low-middle-SDI and low-SDI
coun-tries, advances in the HAQ Index either primarily took
place or accelerated from 2000 to 2016 (figure 5;
appendix pp 133–35). Bangladesh, Myanmar, Bhutan,
Figure 2: Map of HAQ Index values for selected subnational locations in 2016Deciles are based on the distribution of HAQ Index values for countries and territories in 2016 (as shown in figure 1), and then applied for subnational locations. Where lower and upper bounds of deciles appear to overlap, they should be interpreted as values up to but not equalling the upper bound in the preceding decile (ie, exclusive of the upper bound value) and values equalling the lower bound of the following decile (ie, inclusive of the lower bound value). HAQ Index=Healthcare Access and Quality Index.
<31·0 31·0–35·9 35·9–44·8 44·8–54·7 54·7–63·2 63·2–68·9 68·9–74·5 74·5–82·2 82·2–91·3 >91·3
HAQ Index deciles
Japan England
USA China
Mexico
India
77 76 76 76 75 75 75 75 74 64 61 83 100 100 79 51 54 81 81 87 91 81 93 78 84 93 74 53 47 50 56 72 91 49 74 77 100 100 100 100 100 100 100 100 100 100 100 100 100 100 100 100 100 100 97 96 100 100 98 67 100 100 72 100 100 99 100 100 100 100 100 100 99 100 100 100 99 100 100 100 83 100 78 99 78 98 100 91 90 91 68 69 69 81 51 52 70 61 46 23 24 27 28 44 44 23 30 40 71 87 60 66 55 63 67 59 70 50 80 47 60 55 53 68 55 63 72 78 54 80 53 67 80 70 62 63 88 52 77 43 53 64 62 60 65 84 48 59 39 54 60 51 59 58 79 27 43 26 41 66 50 41 44 76 27 32 16 31 74 50 29 91 70 91 73 77 79 65 59 100 46 55 30 52 48 51 27 15 61 51 46 45 46 38 24 30 40 66 83 70 79 57 83 44 49 51 58 92 68 98 86 73 90 100 100 69 100 72 97 73 99 80 53 66 100 98 72 88 69 100 100 89 89 100 100 100 100 69 95 98 76 96 97 91 51 100 70 99 100 74 93 87 78 48 75 89 60 74 99 81 57 84 42 51 81 99 71 83 76 71 25 41 46 50 57 54 75 88 47 59 54 70 66 28 58 56 42 33 30 78 90 82 75 86 59 47 83 Turkey [60] Ukraine [59] Russia [58] Macedonia [57] Albania [56] Cuba [55] Oman [54] Brunei [53] Saudi Arabia [52] 97 97 96 96 96 96 96 95 95 95 95 94 94 94 93 92 92 92 92 92 91 91 90 90 90 90 90 89 89 87 86 86 86 85 85 83 83 83 82 82 82 81 81 81 80 79 78 78 78 77 77 100 100 100 100 100 100 100 100 100 100 97 95 100 100 100 100 100 100 99 99 99 85 100 96 69 100 100 100 100 86 74 83 90 78 100 97 100 95 80 96 86 91 69 83 58 61 60 70 74 82 81 98 99 97 90 96 100 90 99 99 96 97 90 99 95 91 91 90 96 98 89 100 99 94 100 96 83 100 96 82 98 100 91 75 91 90 89 95 81 100 91 89 96 99 85 97 100 73 79 93 88 80 76 90 81 99 93 100 98 86 100 81 85 71 100 81 74 100 84 83 98 89 98 41 68 90 86 98 79 77 58 97 76 71 97 67 73 61 69 44 74 95 88 99 69 56 66 83 50 81 70 89 67 100 100 100 100 100 100 100 100 100 100 100 100 100 100 100 100 100 100 100 100 100 100 100 100 100 100 100 100 100 100 100 100 100 100 100 100 100 100 100 100 100 100 100 100 100 100 100 100 100 100 100 100 100 100 100 100 100 100 100 100 100 100 100 100 100 100 100 100 100 100 100 100 100 100 100 100 100 100 100 100 100 100 100 100 100 100 100 100 100 100 100 100 100 100 100 100 100 100 100 100 100 100 100 100 100 99 100 100 100 100 100 97 100 100 100 100 100 100 100 100 100 100 100 100 100 100 98 100 100 100 100 100 100 100 90 93 100 95 100 100 100 100 98 75 100 100 100 100 100 98 92 78 100 100 100 100 100 100 100 100 100 100 100 100 100 100 100 100 100 100 100 100 100 100 100 100 100 100 100 100 100 100 100 100 100 100 100 100 100 100 100 100 100 100 100 100 100 100 100 100 100 100 100 100 100 100 100 100 100 100 100 100 100 100 100 100 100 100 100 100 100 100 100 100 100 100 100 100 100 100 100 100 100 100 100 100 100 88 100 100 100 100 100 100 99 100 100 100 100 100 100 100 100 100 100 100 100 100 100 100 100 100 100 100 100 100 100 100 100 100 96 100 100 100 100 100 100 100 100 100 100 100 100 81 100 100 100 98 100 99 100 100 93 100 100 97 100 99 100 100 100 92 96 88 95 95 100 95 80 99 83 100 81 95 86 98 88 100 89 70 86 76 79 86 88 84 97 100 78 86 90 89 69 92 67 76 98 92 60 80 91 76 86 63 80 73 66 67 88 70 89 82 69 53 66 59 70 72 75 74 67 100 71 77 73 67 58 73 27 42 57 60 95 53 66 57 62 56 30 80 64 20 52 63 67 92 38 47 54 60 20 62 48 52 40 53 55 53 46 36 33 38 35 43 21 39 45 34 100 97 97 99 99 100 93 98 98 97 92 100 89 94 94 89 87 92 84 89 83 93 85 85 96 92 84 85 100 77 75 80 85 91 75 74 77 83 78 72 68 69 67 73 70 66 66 80 75 65 77 95 95 86 82 69 100 78 86 74 94 89 100 84 79 79 84 86 83 60 79 88 79 77 78 91 71 72 67 86 92 76 66 73 82 73 73 61 66 33 60 50 63 56 49 50 59 61 62 69 58 66 99 95 97 100 86 91 94 96 100 97 92 92 96 94 94 78 91 98 87 87 93 89 93 83 88 85 81 87 99 97 96 79 77 86 72 80 95 100 83 80 64 73 92 78 95 79 79 66 72 73 73 96 95 97 99 100 92 99 88 99 95 89 100 91 92 93 88 88 94 87 86 78 95 87 81 95 98 94 72 93 71 80 76 80 94 68 74 87 99 50 64 59 58 63 69 67 63 72 79 66 59 68 100 100 100 100 100 95 82 100 96 99 95 92 95 97 97 86 98 96 79 90 84 87 99 85 88 91 83 83 96 77 75 72 72 87 71 81 71 86 73 71 63 62 64 72 70 60 67 63 71 68 62 100 100 99 100 100 98 95 94 88 99 95 92 83 100 95 89 85 96 78 86 73 90 94 72 87 86 75 84 100 86 88 63 61 95 58 77 60 82 68 62 41 51 71 59 81 58 63 43 51 53 68 98 95 97 97 99 90 97 79 67 98 83 95 95 97 88 90 99 37 83 69 94 96 96 58 89 83 56 95 79 96 89 34 46 100 29 98 54 79 96 74 32 46 75 66 95 69 69 63 40 28 45 100 100 100 89 97 100 100 100 86 99 97 100 98 91 93 74 100 89 82 91 81 100 97 100 100 70 87 86 80 86 73 87 100 93 79 83 98 91 72 81 100 77 69 99 64 58 79 54 79 92 62 87 91 100 99 96 78 98 81 99 85 83 99 87 76 91 83 97 87 100 100 95 67 85 68 100 74 69 68 66 65 61 100 57 87 86 51 59 61 64 52 50 58 45 48 42 18 52 73 92 64 37 96 90 95 97 100 84 100 90 98 98 99 76 100 93 92 93 89 97 99 100 87 74 90 77 62 93 89 84 78 58 72 74 97 63 82 61 60 68 69 61 87 38 46 68 56 41 38 31 69 49 36 94 100 100 92 100 77 92 96 70 91 97 99 74 100 99 98 100 71 96 98 68 56 84 80 90 76 81 70 55 53 26 92 78 61 98 56 67 50 66 40 94 98 51 33 56 53 36 47 64 61 24 100 100 100 100 91 100 100 100 100 74 95 93 100 93 96 85 98 100 100 100 100 100 80 100 100 98 99 100 76 100 100 98 91 100 91 98 84 86 100 94 82 100 100 85 100 100 100 95 88 98 98 100 87 100 100 100 81 100 83 100 87 90 98 99 98 94 100 75 86 100 100 88 96 76 91 99 100 94 71 95 71 65 95 100 77 100 62 69 96 63 55 100 82 60 97 51 76 75 73 90 61 72 100 100 100 100 100 100 100 100 100 100 100 100 100 100 100 100 100 100 100 100 100 100 100 100 100 100 100 100 100 100 100 100 100 97 100 100 73 87 99 97 100 100 100 88 92 94 98 100 89 97 83 100 100 99 98 100 99 100 100 99 99 99 100 100 100 98 100 98 100 98 99 95 100 87 100 100 100 97 97 99 86 100 96 100 100 99 88 74 97 91 81 100 100 100 100 91 98 88 100 75 86 78 98 99 92 96 99 96 99 98 92 95 94 90 99 99 94 97 90 95 89 97 88 86 81 100 74 74 98 78 94 82 96 82 99 64 89 73 99 74 92 66 100 85 87 100 72 83 96 81 65 83 98 85 78 84 84 88 84 95 90 100 85 86 100 97 97 78 82 84 75 100 79 93 100 71 100 82 97 93 86 100 72 63 94 89 75 76 65 89 74 74 88 91 98 67 83 67 78 81 80 76 72 76 100 85 94 100 89 85 100 86 99 94 100 100 95 82 99 91 78 91 100 96 100 100 93 100 74 72 84 90 62 93 75 91 80 60 84 88 73 46 81 82 71 68 69 92 76 93 90 85 88 71 74 100 100 97 88 87 100 99 97 89 100 91 79 80 84 92 70 86 82 90 99 100 57 100 76 73 66 75 83 54 73 73 76 66 55 56 69 50 36 75 76 48 55 77 50 84 83 67 58 52 56 57 94 88 89 100 87 88 86 92 86 81 80 84 90 79 93 78 83 88 90 83 92 88 72 74 91 94 73 94 71 76 82 88 43 69 88 65 77 71 68 63 46 94 74 39 64 52 55 36 58 55 43 93 100 100 77 88 100 100 99 94 92 98 99 73 93 74 100 95 79 84 63 51 100 84 66 97 72 90 79 70 80 77 75 73 83 62 76 63 54 70 87 76 63 65 60 68 40 84 97 77 76 78 Bulgaria [51] Serbia [50] Chile [49] China [48] Romania [47] Belarus [46] Lithuania [45] Kuwait [44] Latvia [43] Montenegro [42] Qatar [41] Hungary [40] Poland [39] Puerto Rico [38] Bermuda [37] Slovakia [36] Israel [35] Taiwan (Province of China) [34] Lebanon [33] Portugal [32] Estonia [31] Croatia [30] USA [29] Czech Republic [28] Malta [27] Cyprus [26] South Korea [25] Greece [24] UK [23] Singapore [22] Slovenia [21] France [20] Spain [19] Germany [18] Denmark [17] New Zealand [16] Belgium [15] Canada [14] Austria [13] Japan [12] Ireland [11] Andorra [10] Italy [9] Sweden [8] Switzerland [7] Finland [6] Australia [5] Luxembourg [4] Netherlands [3] Norway [2] Iceland [1]
HAQ Index Tuberculosis Diarrhoeal diseases LRIs URIs Diphtheria Whooping cough Tetanus Measles Maternal disorders Neonatal disorders NM skin cancer (SCC) Breast cancer Cervical cancer Uterine cancer Colon cancer Testicular cancer Hodgkin’s lymphoma Leukaemia Rheumatic HD Ischaemic HD Stroke Hypertensive HD Chronic respiratory Peptic ulcer Appendicitis Hernia Gallbladder Epilepsy Diabetes Chronic kidney Congenital heart Adverse med treat
54 53 53 72 45 51 44 97 51 41 47 65 100 100 100 100 100 100 77 69 64 100 100 96 100 43 99 64 62 53 20 37 31 33 61 10 52 50 28 48 49 48 64 45 16 56 40 27 42 36 13 27 20 10 29 20 11 70 40 29 48 35 59 23 14 14 34 48 42 44 67 78 45 29 50 53 25 93 45 86 99 49 36 51 47 46 56 45 65 67 20 38 47 28 41 15 8 71 72 North Korea [120] Mongolia [119] Suriname [118] 74 74 74 72 72 72 71 71 71 71 71 70 70 70 70 69 69 69 69 69 68 68 68 68 68 68 67 67 67 66 66 66 66 64 64 64 63 63 63 63 62 62 62 62 61 61 61 60 59 58 58 58 57 57 57 56 55 89 83 69 72 78 76 70 80 89 67 66 67 78 92 91 59 72 53 83 67 74 58 76 61 68 63 55 93 60 69 70 54 75 58 77 67 68 78 67 48 62 89 63 47 65 62 47 44 79 82 76 34 66 100 59 54 51 86 73 100 83 90 71 70 76 76 73 83 82 92 78 69 74 77 77 67 92 66 48 74 79 54 80 79 83 75 74 58 53 82 63 68 59 69 56 69 73 61 64 66 53 51 49 49 83 79 72 33 42 61 76 58 62 57 54 75 45 100 67 64 59 52 40 62 61 85 68 58 38 44 63 52 56 34 58 44 33 22 56 47 44 65 72 36 54 35 24 28 49 39 47 43 56 27 38 55 39 30 56 50 39 63 35 23 44 48 34 40 52 31 33 100 100 100 100 100 100 100 100 100 100 100 100 100 100 100 100 100 100 100 100 100 100 100 100 100 100 100 100 100 100 100 100 100 100 100 100 100 100 100 100 100 100 100 100 100 100 100 100 100 100 100 100 100 100 100 100 100 100 100 100 100 100 100 100 100 100 100 100 100 100 100 100 100 100 100 100 100 100 100 100 100 100 100 100 100 100 100 100 100 100 100 100 100 100 100 100 100 100 100 100 100 100 100 100 100 100 100 100 100 100 100 100 100 100 70 100 98 76 100 100 86 99 100 100 99 74 92 95 100 71 96 100 100 92 92 89 81 91 88 87 100 42 99 100 91 61 100 64 100 84 97 61 92 100 90 79 89 75 80 54 100 52 90 100 81 80 100 74 54 98 72 100 100 100 100 100 100 100 100 100 100 100 100 70 100 100 100 100 100 100 100 100 100 100 100 100 100 100 100 100 100 100 100 99 100 100 100 100 100 100 100 100 100 100 100 100 91 100 94 100 100 90 84 100 100 100 100 100 45 100 86 92 100 99 81 100 100 100 99 98 99 100 100 96 89 100 100 61 100 100 100 81 100 49 100 94 100 100 100 100 98 100 100 100 100 100 83 100 100 100 100 100 100 100 100 99 64 100 97 87 100 77 100 92 69 94 84 78 100 91 92 88 81 72 88 77 72 100 67 77 90 81 83 75 69 70 62 66 69 62 72 92 89 75 64 69 79 78 56 74 66 68 73 60 75 60 67 87 90 63 63 62 87 56 77 64 64 70 66 55 78 72 56 55 100 71 76 42 56 66 41 59 63 60 86 43 56 74 50 53 43 54 43 52 53 78 41 44 58 62 34 58 50 31 51 47 30 41 33 58 40 39 46 34 24 29 49 25 25 56 74 40 58 39 38 39 39 46 44 36 50 31 39 35 33 29 38 38 74 4 15 35 23 36 5 27 72 18 32 50 45 31 14 46 62 31 37 63 35 79 66 23 38 22 41 36 43 24 71 43 27 30 66 40 31 72 9 38 31 22 22 29 24 28 31 36 87 66 71 54 62 71 70 64 72 62 55 54 68 55 68 61 57 63 66 75 65 75 66 70 71 70 46 50 60 69 71 69 64 56 63 63 57 55 49 56 55 55 61 66 47 56 43 43 61 54 56 53 49 26 53 43 39 60 57 72 51 46 60 41 67 57 58 59 61 49 48 52 66 44 65 64 75 54 59 72 66 63 74 51 54 56 55 52 63 68 50 55 56 52 51 37 57 50 53 53 60 46 51 48 46 60 44 57 48 45 34 51 52 44 100 72 71 56 59 64 67 60 87 62 51 49 60 46 81 56 48 62 61 74 69 79 63 66 77 71 53 39 59 84 76 64 59 61 78 66 68 56 41 50 58 65 71 61 45 64 38 38 58 62 42 39 56 14 56 50 29 98 71 67 44 52 59 60 54 80 51 50 52 55 47 76 56 46 54 63 74 68 77 58 66 75 62 41 40 49 77 76 56 58 77 73 66 60 56 37 45 72 58 65 53 47 59 36 39 57 57 44 39 51 25 52 41 27 88 51 65 41 49 53 59 57 63 49 44 43 52 43 58 51 41 49 56 73 45 53 61 59 52 73 33 32 48 61 57 56 49 40 62 50 45 36 32 39 39 40 49 54 26 42 26 29 54 41 32 30 36 12 38 28 16 88 30 64 27 28 41 55 33 54 36 29 27 33 24 42 36 25 39 49 77 25 34 37 53 33 48 25 16 32 50 33 44 39 19 44 31 28 17 21 28 22 26 31 42 14 25 17 18 44 23 21 18 20 11 19 17 10 95 24 61 23 27 30 35 27 38 27 29 30 15 20 35 32 16 31 39 79 26 23 29 50 23 36 24 19 25 32 29 30 32 26 28 27 28 22 13 25 24 21 24 25 20 22 23 24 36 20 21 18 22 16 24 28 16 85 84 55 88 82 80 83 73 77 56 76 66 47 94 77 100 91 49 74 53 100 89 54 72 100 69 60 74 43 74 82 57 70 91 75 78 66 97 84 38 78 70 66 47 94 80 44 69 40 52 68 77 64 81 82 65 71 27 73 60 63 41 36 38 79 65 38 56 50 29 51 59 90 44 24 45 16 67 71 59 36 51 49 20 24 41 43 70 19 56 94 37 50 70 64 46 7 83 72 58 4 80 42 23 71 45 42 17 26 42 18 52 47 56 42 81 35 46 71 46 53 58 41 55 62 60 36 55 36 56 54 31 50 32 69 57 59 40 54 35 26 49 33 28 68 33 49 78 37 41 38 77 50 26 57 28 40 10 70 35 21 30 33 24 25 39 24 25 37 37 48 34 65 56 73 66 24 63 66 53 58 55 55 60 26 38 90 67 40 34 25 56 71 54 80 40 62 40 74 31 12 60 56 3 89 36 48 39 60 57 0 48 40 22 32 52 46 43 46 38 34 46 62 21 43 46 33 55 82 75 88 100 77 70 80 73 77 100 68 54 88 91 71 73 77 92 50 59 58 52 70 77 76 97 100 48 62 68 64 66 75 64 55 68 57 68 71 100 67 45 56 64 62 52 100 73 66 59 49 71 70 84 68 52 83 73 77 69 78 69 71 85 83 62 52 100 98 76 90 75 80 89 62 69 75 74 79 80 53 71 40 50 100 59 62 63 63 36 74 49 67 67 57 84 46 69 53 58 53 70 63 63 56 57 50 60 75 43 74 66 57 82 54 76 73 91 60 86 81 76 67 86 90 100 83 99 69 74 89 89 97 50 60 63 80 74 67 65 95 68 88 62 51 94 24 58 66 60 61 49 82 93 48 68 66 75 61 77 91 71 45 54 63 78 53 75 50 58 57 81 79 100 82 95 99 100 75 73 68 96 100 100 100 88 100 100 78 100 97 70 79 83 86 66 82 77 100 80 72 51 100 100 79 53 61 82 65 99 94 71 69 71 79 64 97 91 100 70 52 86 99 53 99 43 59 69 51 71 45 75 77 89 85 60 85 48 100 100 83 81 76 51 88 73 91 70 48 70 66 53 73 59 80 100 96 54 46 92 86 59 70 43 78 70 84 74 53 86 78 75 75 97 68 65 50 61 23 80 78 73 45 49 78 72 79 91 68 59 70 66 74 63 97 65 61 68 74 38 81 73 65 54 84 77 71 96 77 63 44 71 89 81 66 64 46 72 97 45 76 49 77 68 19 63 62 38 50 68 80 39 50 50 47 87 42 40 43 71 55 28 53 86 37 62 46 65 66 79 42 59 53 79 67 61 46 62 72 74 23 45 77 61 72 64 54 87 84 76 63 44 38 54 66 76 27 58 40 44 65 47 55 39 39 52 50 58 76 64 22 33 50 56 31 54 51 38 61 34 38 21 60 34 48 25 60 39 64 39 30 26 27 33 34 36 53 4 25 47 34 45 44 25 68 80 40 52 30 5 48 17 44 27 45 31 5 36 40 24 29 21 32 6 40 48 40 11 17 28 28 25 16 22 17 45 60 50 91 63 66 38 51 48 38 43 52 78 53 28 46 73 39 41 45 49 39 36 48 59 38 54 47 39 53 54 33 26 39 52 31 40 52 38 30 53 40 37 30 17 46 36 36 32 64 38 43 38 42 32 36 54 57 46 53 49 56 72 54 51 48 36 60 63 76 10 80 46 57 57 47 35 45 84 79 34 47 71 71 71 64 47 35 61 48 77 48 37 58 37 76 51 68 57 42 25 41 72 32 72 60 20 14 65 51 35 60 43 12 47 Cape Verde [117] Belize [116] Paraguay [115] Palestine [114] Saint Vincent and the Grenadines [113] Morocco [112] Egypt [111] Grenada [110] American Samoa [109] Vietnam [108] Kyrgyzstan [107] Dominican Republic [106] Nicaragua [105] Turkmenistan [104] Dominica [103] Jamaica [102] Ecuador [101] Uzbekistan [100] Algeria [99] El Salvador [98] Saint Lucia [97] Brazil [96] Trinidad and Tobago [95] Peru [94] Seychelles [93] Azerbaijan [92] Mexico [91] The Bahamas [90] Georgia [89] Syria [88] Moldova [87] Greenland [86] Venezuela [85] Malaysia [84] Argentina [83] Panama [82] Colombia [81] Guam [80] Mauritius [79] Kazakhstan [78] Tunisia [77] Thailand [76] Antigua and Barbuda [75] Jordan [74] United Arab Emirates [73] Maldives [72] Sri Lanka [71] Armenia [70] Barbados [69] Uruguay [68] Libya [67] Iran [66] Bahrain [65] Bosnia and Herzegovina [64] Northern Mariana Islands [63] Costa Rica [62] Virgin Islands [61]
HAQ Index Tuberculosis Diarrhoeal diseases LRIs URIs Diphtheria Whooping cough Tetanus Measles Maternal disorders Neonatal disorders NM skin cancer (SCC) Breast cancer Cervical cancer Uterine cancer Colon cancer Testicular cancer Hodgkin’s lymphoma Leukaemia Rheumatic HD Ischaemic HD Stroke Hypertensive HD Chronic respiratory Peptic ulcer Appendicitis Hernia Gallbladder Epilepsy Diabetes Chronic kidney Congenital heart Adverse med treat
52 52 51 51 51 50 50 50 49 49 48 48 48 47 47 46 45 44 43 43 43 42 42 42 41 41 40 40 40 39 39 39 39 38 37 36 36 35 35 34 34 33 33 32 32 32 32 32 32 32 32 32 31 31 31 31 31 30 30 30 53 24 65 30 56 47 25 73 32 46 58 63 44 52 52 41 24 29 40 46 49 32 33 50 30 45 15 30 40 30 38 44 30 31 32 22 27 22 37 20 25 18 24 40 37 26 22 42 25 3 29 50 13 14 24 22 29 22 16 36 32 35 38 47 51 47 35 71 56 49 47 84 48 51 45 34 23 42 28 27 69 15 47 73 35 28 18 39 47 26 52 38 44 26 35 31 28 38 13 30 33 24 31 50 48 16 27 24 30 13 27 43 30 20 25 13 16 25 32 16 25 23 18 30 49 32 17 32 34 17 18 36 61 42 66 46 22 57 46 48 23 28 47 22 41 29 6 19 50 23 28 17 24 55 29 28 32 23 45 25 23 20 19 19 27 25 21 32 24 14 22 21 31 10 23 17 23 24 25 20 100 100 100 100 100 100 100 100 100 100 100 100 100 100 100 100 100 100 100 100 100 100 100 99 100 100 100 100 100 100 100 100 100 100 100 96 98 99 93 100 96 100 96 99 94 87 84 97 89 97 92 97 95 92 97 82 96 80 80 90 100 100 100 100 100 100 100 100 95 100 100 100 100 100 100 100 100 100 100 100 100 90 100 100 100 100 100 100 100 100 100 100 100 100 100 100 100 100 100 100 100 100 100 100 100 100 100 100 100 100 100 100 100 100 100 100 100 100 100 100 52 96 68 99 55 100 66 89 62 56 58 37 52 67 61 41 64 47 41 38 33 33 61 46 51 32 74 59 46 55 55 48 58 39 42 54 39 29 30 49 41 50 26 33 43 27 43 35 39 51 39 32 36 53 42 34 39 41 25 35 100 100 100 72 100 100 100 100 79 100 100 100 77 96 100 96 100 63 75 91 100 64 81 100 71 80 99 94 53 26 57 66 65 58 67 58 71 55 67 87 55 72 58 100 100 80 67 56 71 86 74 97 53 100 71 62 68 58 54 63 100 67 100 98 83 100 56 90 30 100 31 44 89 59 100 80 67 47 74 84 47 35 89 78 52 71 54 46 76 32 88 53 54 72 56 62 38 61 59 39 61 52 37 46 56 37 46 100 60 38 51 36 44 50 52 75 45 67 39 43 64 61 50 54 49 51 42 40 33 40 57 64 46 48 51 29 43 38 24 31 44 22 41 48 45 19 49 30 30 27 42 38 38 31 33 26 17 23 14 16 17 25 40 38 34 11 20 23 24 26 15 22 22 19 17 11 18 18 19 18 27 51 38 34 32 25 30 43 25 30 30 64 25 26 38 19 28 33 29 25 43 12 29 47 24 23 27 24 31 30 29 37 21 11 15 26 23 26 11 24 24 28 20 35 39 24 17 17 20 13 18 30 21 19 26 13 21 20 19 18 72 16 35 5 10 31 43 38 21 32 34 33 18 20 32 25 16 11 9 22 25 43 7 26 12 33 16 20 12 11 6 33 31 20 8 11 29 11 30 17 9 17 10 24 22 26 8 19 25 12 28 19 10 3 27 26 27 27 9 10 40 55 44 49 27 47 62 35 49 43 61 26 40 38 36 38 42 55 33 25 46 33 6 28 42 18 44 31 21 40 23 23 21 34 30 18 14 19 15 24 16 18 18 20 17 13 19 23 11 38 17 24 22 17 9 16 10 5 11 22 43 49 45 66 34 46 60 38 51 38 69 41 50 41 30 46 35 61 44 32 68 35 2 35 45 21 49 30 26 39 33 30 24 35 44 22 28 24 24 29 18 26 20 36 34 20 29 30 15 44 23 44 27 12 13 25 16 9 16 30 29 52 41 40 15 52 55 31 47 46 54 21 22 27 39 25 42 46 30 15 30 30 12 27 33 20 36 31 12 31 16 15 13 22 18 12 14 15 12 19 13 12 10 12 9 15 18 20 9 33 16 14 15 15 8 13 11 4 7 12 32 42 43 44 23 49 54 29 38 54 58 22 39 29 36 30 29 47 26 22 41 28 8 22 33 11 34 23 20 31 17 19 11 38 27 14 9 14 14 19 9 16 13 17 14 10 14 24 5 32 8 25 17 10 1 13 5 4 8 21 20 31 23 31 11 33 42 23 36 25 49 14 18 19 25 17 22 37 16 12 23 15 20 23 26 7 18 26 11 16 11 9 7 20 14 6 4 5 5 17 4 11 5 11 9 4 3 10 2 17 4 14 5 6 0 5 2 2 3 7 14 19 13 21 9 21 34 14 21 12 43 7 18 12 11 13 13 26 10 10 17 15 3 10 18 4 14 10 10 15 5 8 4 17 10 6 6 5 10 9 3 8 4 7 6 7 8 10 2 15 3 13 8 3 1 8 3 3 4 10 21 22 21 27 12 22 27 22 39 18 27 19 22 11 18 16 20 25 21 16 18 27 3 12 24 9 20 16 19 23 16 12 12 16 10 7 12 4 17 19 2 17 3 14 14 21 13 17 8 27 8 26 10 4 3 17 12 8 4 13 39 51 99 47 47 55 55 49 71 67 19 36 41 44 74 48 51 50 49 43 23 73 46 17 26 67 42 57 36 74 50 44 62 23 39 64 61 64 49 47 61 46 62 5 5 52 57 28 47 27 51 6 58 38 53 45 48 33 53 33 21 62 70 42 13 21 74 51 72 57 17 45 65 44 40 28 66 42 57 18 31 82 84 22 28 67 57 60 45 84 69 75 58 33 43 82 63 63 68 54 58 52 57 9 21 60 66 22 51 54 64 27 74 65 50 51 64 63 72 58 18 43 59 25 22 9 52 43 55 43 31 31 31 43 49 38 46 22 42 24 18 66 33 9 30 54 30 35 42 47 30 35 28 30 27 44 51 44 44 32 47 30 39 3 6 40 44 9 37 24 36 15 40 43 37 38 36 55 31 11 40 22 61 19 34 12 25 48 40 58 16 30 52 45 38 50 24 33 38 44 27 63 27 18 39 53 17 26 47 41 35 59 40 34 30 33 54 36 46 22 31 24 33 19 15 45 31 20 43 5 40 22 31 38 46 43 42 30 30 15 67 68 56 30 62 55 35 46 77 41 29 57 58 45 27 35 49 64 44 52 35 53 48 42 62 63 46 65 55 67 65 49 65 47 28 46 60 52 71 52 47 51 55 29 34 60 49 19 60 37 49 13 49 45 58 50 59 46 47 19 43 55 30 24 79 38 57 32 51 46 45 53 48 53 37 54 54 30 41 50 40 69 39 37 45 62 43 37 42 49 10 51 42 36 27 38 50 47 45 27 41 27 46 23 21 40 36 20 37 30 37 20 30 54 40 32 37 33 38 34 65 61 35 54 85 31 55 18 53 29 34 44 43 49 28 55 59 37 50 54 30 51 52 23 31 41 50 35 39 49 23 39 46 25 40 42 36 43 32 24 43 28 41 18 14 30 32 24 22 37 27 15 33 37 25 24 25 24 37 32 83 63 42 72 100 44 68 55 61 52 69 79 56 62 23 88 63 33 71 84 70 68 73 62 42 61 50 48 55 25 48 40 59 45 64 39 46 36 44 39 42 36 40 49 47 41 28 25 31 38 33 47 24 46 33 31 32 36 56 30 72 49 55 48 99 48 53 28 55 35 53 53 63 71 5 65 43 39 52 56 43 71 60 34 59 68 41 33 57 42 24 45 63 50 49 35 58 49 55 20 42 31 35 25 24 54 27 33 44 28 50 21 29 6 48 46 53 49 39 29 20 10 46 82 55 42 6 80 70 60 47 67 35 44 43 57 14 60 61 53 57 52 53 53 39 43 2 55 41 63 59 51 61 47 55 52 41 37 37 51 48 49 36 49 48 43 39 38 33 2 35 60 44 20 29 41 32 51 49 41 53 25 30 45 25 26 24 21 53 57 0 29 56 57 57 57 37 34 65 54 0 73 48 12 57 65 14 46 58 61 52 71 48 50 37 52 65 49 57 47 48 52 49 18 8 54 52 30 52 12 45 19 44 26 49 49 53 48 46 48 51 39 14 14 16 22 32 12 65 21 2 12 45 36 10 26 43 38 46 24 2 78 32 1 30 45 31 50 33 72 36 21 43 30 28 64 45 56 45 50 56 55 60 5 0 35 54 20 43 26 36 9 54 27 34 37 37 49 56 61 42 88 46 29 21 43 67 50 65 34 14 60 57 38 53 3 74 43 32 25 51 48 45 42 40 53 66 56 68 98 65 57 49 45 16 81 50 87 47 58 76 56 83 31 36 47 80 27 42 62 32 31 83 54 42 28 43 33 78 61 56 49 46 64 44 14 56 33 49 37 36 33 40 34 30 36 50 51 51 34 24 34 35 19 24 31 42 39 28 50 41 42 15 27 37 39 28 36 24 35 33 33 37 14 13 27 35 16 19 35 17 14 34 28 18 18 20 15 32 36 Madagascar [180] Mozambique [179] Burkina Faso [178] Benin [177] Sierra Leone [176] Senegal [175] Zimbabwe [174] Uganda [173] Papua New Guinea [172] Cameroon [171] Lesotho [170] Togo [169] Haiti [168] Malawi [167] Liberia [166] Solomon Islands [165] Vanuatu [164] Comoros [163] Angola [162] Tanzania [161] Congo (Brazzaville) [160] Mali [159] Djibouti [158] The Gambia [157] Rwanda [156] Laos [155] Pakistan [154] Ghana [153] São Tomé and Príncipe [152] Cambodia [151] Kenya [150] Nepal [149] Gabon [148] Swaziland [147] Mauritania [146] India [145] Federated States of Micronesia [144] Myanmar [143] Nigeria [142] Marshall Islands [141] Yemen [140] Timor-Leste [139] Indonesia [138] Namibia [137] Sudan [136] Honduras [135] Bhutan [134] Bangladesh [133] Samoa [132] Fiji [131] Bolivia [130] Equatorial Guinea [129] Tonga [128] South Africa [127] Guyana [126] Iraq [125] Philippines [124] Guatemala [123] Botswana [122] Tajikistan [121]
HAQ Index Tuberculosis Diarrhoeal diseases LRIs URIs Diphtheria Whooping cough Tetanus Measles Maternal disorders Neonatal disorders NM skin cancer (SCC) Breast cancer Cervical cancer Uterine cancer Colon cancer Testicular cancer Hodgkin’s lymphoma Leukaemia Rheumatic HD Ischaemic HD Stroke Hypertensive HD Chronic respiratory Peptic ulcer Appendicitis Hernia Gallbladder Epilepsy Diabetes Chronic kidney Congenital heart Adverse med treat
Cambodia, and Laos (low-middle SDI), and Rwanda and
Ethiopia (low SDI), exemplified this trend. Some
countries in eastern Europe and central Asia (eg, Russia,
Belarus, Kazakhstan) also experienced substantive
progress from 2000 to 2016, after stalled gains or
falter-ing performance from 1990 to 2000. A sub set of countries,
including Vietnam and Nepal, rec orded more comparable
rates of change for each time period, whereas others,
including several countries in Latin America and the
Caribbean (eg, Guatemala, Mexico, Dominican Republic;
table 2, appendix pp 133–35), had much slower progress
after making considerable gains from 1990 to 2000.
Nine countries, all low-to-middle SDI, did not record
significant increases from 1990 to 2016. Table 2 and the
appendix (pp 158–64) provide estimates of HAQ Index
values, as well as absolute change and annualised rates of
change for 1990–2000, 2000–16, and 1990–2016.
Focusing on 2000–16, examining improvement across
health areas highlights a mixture of progress and
potential for worsening performance if past trends are
not addressed (appendix pp 136–41). Across locations,
the largest gains primarily took place for
vaccine-prevent able diseases (eg, measles), some infectious
diseases (eg, diarrhoeal diseases), some cancers (eg,
leukaemia), and some non-communicable diseases.
Such advances were most pronounced among
coun-tries that also recorded substantive increases in their
overall HAQ Index (eg, China, Turkey). At the same
time, many low-to-middle SDI countries experienced
relatively few gains across most non-communicable
diseases. Further more, countries with minimal
pro-gress on overall HAQ Index performance had
com-paratively small advances, even for health areas in
which improvements have been more widespread. The
main exception was vaccine-preventable diseases,
especially measles, for low-SDI to middle-SDI countries
(appendix pp 136–41).
Correlates of HAQ Index performance
Although total health spending per capita was strongly
correlated with HAQ Index performance in 2016
(r=0·94; figure 6), large variation existed at similar
spending levels. For instance, some countries with
HAQ Index scores between 40 and 70 spent at least
three times more than did peers with similar
performance. Govern ment spending as a fraction of
total health spending had positive, albeit moderate,
correlation with HAQ Index performance in 2016
(r=0·76; appendix p 145), whereas develop ment assist
-ance for health showed an opposite pattern (r=–0·71;
appendix p 147). Country-level HAQ Index scores in
2016 were positively associ ated with physicians, nurses,
and midwives per 1000 (r=0·79), and similar, though
more moderate, corre lations were found for hospital
beds per 1000 and utilisation (appendix pp 149–52).
Nonetheless, sizeable heterogeneity emerged across
28 28 27 27 27 26 26 26 25 23 19 19 19 13 8 25 16 24 21 19 24 15 8 0 29 23 13 17 26 39 27 33 9 23 24 13 27 15 25 16 20 33 14 30 17 17 10 12 96 83 66 96 97 82 81 78 87 76 42 46 100 100 100 100 59 100 100 100 66 100 41 87 20 53 38 43 24 43 23 27 21 32 7 17 48 43 45 64 19 100 52 57 39 51 12 33 31 50 55 54 25 30 34 54 30 27 40 14 19 13 14 13 10 38 11 14 6 19 6 4 27 29 17 15 21 21 15 20 16 17 19 8 9 9 8 20 10 30 27 15 27 22 8 11 10 13 17 10 17 8 11 8 13 8 12 22 13 15 24 5 25 25 23 14 22 14 17 37 6 10 10 9 15 5 12 1 18 6 8 17 9 9 16 4 19 7 7 8 10 4 13 22 4 4 6 1 7 7 2 6 4 1 5 12 5 4 8 1 12 2 6 4 7 1 7 14 7 6 12 4 23 5 12 5 14 3 11 29 54 47 46 43 51 9 44 27 45 36 38 24 53 57 66 42 66 40 51 2 62 41 42 40 36 24 37 25 38 12 24 7 43 22 22 14 31 26 28 39 32 21 41 33 46 36 22 16 59 46 37 54 43 15 49 40 41 49 35 32 29 26 21 32 29 17 34 18 35 25 20 4 31 25 28 19 32 9 20 28 22 14 20 6 28 21 22 23 24 39 25 54 28 16 17 9 26 23 24 39 42 21 42 36 43 44 20 4 36 34 46 32 37 29 30 30 36 26 27 40 47 43 46 41 48 1 51 22 55 38 39 38 49 54 56 31 57 14 42 2 37 26 45 44 99 95 77 33 97 30 37 9 48 42 95 50 34 29 30 13 32 0 17 10 16 10 24 23Central African Republic [195] Somalia [194] Guinea-Bissau [193] Chad [192] Afghanistan [191] Guinea [190] Kiribati [189] South Sudan [188] Côte d’Ivoire [187] Burundi [186] Eritrea [185] Ethiopia [184] 0 25 50 75 100
HAQ Index score 30 29 28 9 11 25 26 28 13 26 16 23 78 97 75 100 100 100 28 47 31 66 46 48 60 51 53 9 29 8 16 24 22 13 9 24 16 18 11 28 20 20 15 12 13 15 12 8 9 7 3 11 4 7 27 5 19 41 53 40 66 55 58 32 38 39 27 24 47 43 49 46 21 26 35 21 21 23 31 17 27 15 16 45 48 38 31 50 41 53 58 46 42 53 90 53 35 26 20 Niger [183] Zambia [182] Democratic Republic of the Congo [181]
HAQ Index Tuberculosis Diarrhoeal diseases LRIs URIs Diphtheria Whooping cough Tetanus Measles Maternal disorders Neonatal disorders NM skin cancer (SCC) Breast cancer Cervical cancer Uterine cancer Colon cancer Testicular cancer Hodgkin’s lymphoma Leukaemia Rheumatic HD Ischaemic HD Stroke Hypertensive HD Chronic respiratory Peptic ulcer Appendicitis Hernia Gallbladder Epilepsy Diabetes Chronic kidney Congenital heart Adverse med treat
Figure 3: Performance on the HAQ Index and 32 individual causes, by country or territory, in 2016
Countries are ranked by their HAQ Index score from highest to lowest in 2016. The HAQ Index and individual causes are reported on a scale of 0–100, with 0 representing the worst levels observed from 1990 to 2016, and 100 reflecting the best during that time. HAQ Index=Healthcare Access and Quality Index. LRIs=lower respiratory infections. URIs=upper respiratory infections. NM=non-melanoma. SCC=squamous-cell carcinoma. Colon cancer=colon and rectum cancer. HD=heart disease. Chronic respiratory=chronic respiratory diseases. Peptic ulcer=peptic ulcer disease. Hernia=inguinal, femoral, and abdominal hernia.
Gallbladder=gallbladder and biliary diseases. Chronic kidney=chronic kidney disease. Congenital heart=congenital heart anomalies. Adverse med treat=adverse effects of medical treatment.
these health system measures and their relationships
to the HAQ Index, particularly among middle-to-high
SDI countries. All correlations and additional figures
are in the appendix (pp 142–52, 165).
Discussion
Summary of findings
Amid gains on personal health-care access and quality,
striking disparities remained regarding HAQ Index
scores achieved by 2016, and how quickly locations
improved over time. In 2016, HAQ Index performance
diverged along the development spectrum, ranging
from more than 97 in Iceland to less than 20 in the
Central African Republic and Somalia. Subnational
inequalities were particularly pronounced in China
and India, although high-income countries, including
England and the USA, also saw considerable local gaps
in performance. The global pace of progress
accel-erated from 2000 to 2016, a trend fuelled by many
low-SDI and low-middle-SDI countries in
sub-Saharan Africa and southeast Asia. By contrast, several
countries saw slowed or minimal improvement from
2000 to 2016 after recording larger gains from 1990
to 2000. Examining patterns in broader causes
unveiled considerable heterogeneity in country-level
im
prove
ments across health areas. These findings,
coupled with the variable relationships between
national HAQ Index values and potential correlates of
per formance, underscore the complexities of orienting
health systems toward providing access to quality
services across health needs and along continuums
of care.
Inequalities in personal health-care access and quality
within countries
Our subnational assessment of HAQ Index
per-formance shows the importance of monitoring
health-care gaps and gains at more local levels. Further,
because some factors might be more uniform because
of country-level policy or health-care characteristics
(eg, national insurance schemes, federally-maintained
referral sys tems), this analysis offers the opportunity to
consider if or how challenges in access and quality are
experienced within countries. For instance, Mexico’s
subnational differ ences could be more related to
state-level vari ations in quality given the country’s concerted
efforts to expand access and service coverage through
a tiered insurance system.
42,43Similar factors might
under lie disparities in England, where the National
Health Service ought to minimise financial barriers to
accessing health care.
30Nonetheless, other obstacles
probably exist, including inadequate utilisation of
care across Mexican states,
44and local variations in
health funding
45or human resource constraints within
England.
46Striking disparities in China and India
might represent myriad factors, including large
vari-ations in physical access to health facilities, health
system infrastructure and scale-up of medical
tech-nologies, and provision of effective services across
continuums of care. Brazil’s universal health
coverage-focused initiatives, includ ing expanding
community-based health programmes and governance functions,
seem to have contributed to local reductions in
amenable mortality from 2000 to 2012.
14However,
state-level progress on the HAQ Index was generally
faster from 1990 to 2000 than from 2000 to 2016,
suggest ing that advances in access might not always
be accompanied by improved quality of care ac ross
health services, especially for non-communicable
dis eases. State-level differences in the USA could be
Global High SDI High–middle SDI Middle SDI Low–middle SDI Low SDI 0 20 40 60 80 100 HA Q Index
A
Japan England USA China Mexico Brazil India 0 20 40 60 80 100 HA Q Index
B
1990 2000 2016 YearFigure 4: Median, IQR, and range of the HAQ Index in 1990, 2000, and 2016, globally and by SDI quintile (A), and for seven countries with subnational estimates (B)
Black lines represent the median, dark-coloured boxes represent the IQR, and the light-coloured boxes represent the full range of values within a given group. Subnational locations represented in panel B are as follows: 47 prefectures in Japan; 150 local government areas in England; 50 states and the District of Columbia in the USA; 33 provinces and special administrative regions in China; 32 states in Mexico; 26 states and the Federal District in Brazil; and 31 states and union territories in India. HAQ Index=Healthcare Access and Quality Index. SDI=Socio-demographic Index.