Artigo
DOI: 10.14295/2238-6416.v70i3.412PHYSICOCHEMICAL AND RHEOLOGICAL
CHARACTERIZATION OF COMMERCIAL
DAIRY FERMENTED BEVERAGES
Caracterização físico-química e reológica de bebidas
fermentadas comerciais
Kamilla Soares Mendonça1*, Bárbara Jordana Gonçalves1, Jacyara Thaís Teixeira1,
Sandra Maria Pinto1, Luiz Ronaldo de Abreu1
ABSTRACT
The Technical Regulation on Identity and Quality of Whey-based Drinks establish few parameters to dairy beverages, which may impair standardized product providing to the consumer. The ingathering of the physicochemical characteristics provides information that allow the standardization of the product and provide safety to the consumer, whereas the rheological characterization in important for the processing. Samples of five commercial brands of strawberry flavored dairy beverages, with ten to fourteen days of manufacture, from three different batches were analyzed in triplicate in order to study the percentage of protein, fat, pH, titratable acidity, total dry extract, fixed mineral residue and lactose. It was performed a colorimetric determination and verification of the presence of starch .The rheological tests were carried out in a rotational rheometer and the data was adjusted by Herschel-Bulkley’s model. The statistical analysis was executed by an analysis of variance and the Tukey’s test with 5% significance. The analysis showed that the percentages of lipids of three brands were below the required by legislation. Furthermore, the presence of starch in the composition was detected for all analyzed beverages. Both for the physicochemical and rheological parameters the brands of dairy beverage examined differed between themselves in several parameters. These results indicated the need to establish well-defined identity and quality standards aiming at product quality control and consumer safety improvement.
Keywords: composition; Herschel-Bulkley; standardization.
1 Universidade Federal de Lavras (UFLA), avenida Doutor Sylvio Menicucci, 1001, bairro Kennedy, 37200-000, Lavras, MG, Brasil. E-mail: keamendonca@msn.com.
* Autor para correspondência. Recebido / Received: 06/04/2015 Aprovado / Approved: 13/08/2015
RESUMO
O Regulamento Técnico de Identidade e Qualidade de Bebida Láctea estabelece poucos parâmetros às bebidas lácteas, o que pode comprometer o fornecimento de um produto padronizado ao consumidor. O levantamento das características físico-químicas fornece informações que permitem a padronização e conferem mais segurança ao consumidor, enquanto a caracterização reológica é importante para o processamento. Amostras de cinco marcas comerciais de bebidas lácteas fermentadas sabor morango, com dez a quatorze dias de fabricação, de três diferentes lotes foram analisadas em triplicata quanto aos teores de proteína, gordura, pH, acidez titulável total, extrato seco total, resíduo mineral fixo e teor de lactose. Foi executada ainda a determinação colorimétrica e verificação da presença de amido. Os testes reológicos foram executados em reômetro rotacional e os dados ajustados pelo modelo de Herschel-Bulkley. A análise estatística foi feita por análise de variância e teste de médias de Tukey com 5% de significância. As análises mostraram que os teores de lipídios de três marcas estavam abaixo dos exigidos na legislação. Além disso, foi detectada a presença de amido na composição de todas as bebidas analisadas. Tanto para os parâmetros físico-químicos como reológicos as marcas de bebidas lácteas examinadas diferiram entre si em relação a diversos parâmetros. Esses resultados indicaram a necessidade de se estabelecer padrões bem definidos de identidade e qualidade objetivando o controle de qualidade do produto e a segurança do consumidor.
Palavras-chave: composição; Herschel-Bulkley; padronização. INTRODUCTION
The consumption of dairy beverages has risen in the last few years, driven by the pursuit of a healthy life and food with high nutritional value (THAMER; PENNA, 2006). Fermented dairy beverage is an established product in the dairy segment and it is of high economic importance to the dairy industry world wide. Increased consciousness about health benefits of dairy proteins, and an increasing amount of scientific documentation claiming health promotional effects of protein intake (MELLENTIN, 2013), bring along expanded whey-based market opportunities. The market offers a great variety of products, as dairy beverages with a functional appeal (probiotics and prebiotics), reduced caloric value, enriched with nutrients and added with cereal and fruits (SEIBEL; CANSIAN,
2000; KRÜGER et al., 2008; CALDEIRA et al., 2010).
According to the Technical Regula-tion on Identity and Quality of Whey-based Drinks (BRASIL, 2005), dairy beverage is produced from milk, cheese whey or its deriva-tives, with or without the addition of other ingredients. The dairy basis must represent at least 51% (v/v) of the formulation. Fer-mented dairy beverages can be submitted to a fermentation process using yogurt cultures and/ or also can be added fermented milk. Be sides milk, cheese whey and dairy bacteria, the for-mulation of dairy beverages may contain optio nal ingredients (dairy or not), acidulants, flavorings, acidity regulators, stabilizers, thi-ckeners, emulsifiers, colorings, conserva tives, pieces, pulp or juice of fruits and honey.
High protein content fluids, as fermen -ted dairy beverages, can show wide variation
of rheological properties in different con-ditions, due to the structural role of protein and the strong influence of composition and in gredient interaction (MASSON et al., 2011). Understanding rheological proper-ties of dairy beverages is critical for product development, design of flow processes, equipment design, quality control, storage and processing and in predicting the texture of foods (STEFFE, 1996).
The physicochemical composition of the fermented dairy beverages are not fully established by legislation. This work aimed to characterize physicochemical attributes of commercial fermented dairy beverages and verify whether the samples are in agreement with legislation. In addition, the rheological properties of commercial fermented dairy be verages will be evaluated.
MATERIAL AND METHODS
Samples of five commercial brands of strawberry flavored fermented dairy beve-rages were acquired in April and May of 2012 in the local market of Lavras, in the state of Minas Gerais – Brazil. To ensure the comparability of characteristics that vary throughout the shelf life, all the samples had between 10 to 14 days of manufacture and three distinct batches of each brand were taking into analysis. The strawberry flavored samples were chosen because they are preferred in the market. The samples were taken to the Laboratory of Physicochemical Analysis from the dairy sector of the Food Science Department of Federal University of Lavras, where the physicochemical analysis were performed. A completely randomized design was adopted, with five samples of fer-mented dairy beverage, from three different batches and three repetitions. The beverages were stored under refrigeration until the con-sumer test.
The fermented dairy beverages were
evaluated according to the Technical Regu-lation on Identity and Quality of Whey-based Drinks by the Normative Instruction number 16 of the Ministry of Agriculture, Livestock and Supply (BRASIL, 2005), that establishes the minimal percentage of dairy protein and dairy fat. Analysis of fat content, titratable acidity (TA), total solids content (TSC), ash content (AC), lactose content and presence or absence of starch were carried out in accordance to BRASIL (2006). pH was deter-mined by direct reading on a digital potentio-meter (Microprocessor pH Meter HI 9321 Hanna, Instruments, Cluj County, Romania).
The total nitrogen content was deter-mined by the micro-Kjeldahl method for milk (33.2.11 method, AOAC, 1995). The to tal nitrogen content was used to determine the total protein by multiplying the total nitrogen content for a conversion factor of 6.38, in accordance to BRASIL (2006). Soluble nitrogen in pH 4.6 (Nsoluble pH 4.6)was determined by the macro-Kjeldahl method (33.2.18 method, AOAC, 1995). The fraction of soluble nitrogen in TCA 12% (NsolubleTCA 12%) was executed by the micro-Kjeldahl method for milk (33.2.12 method, AOAC, 1995). The true protein was calculated multiplying the difference between the total nitrogen and the soluble nitrogen in TCA 12% by 6.38 (PEREIRA et al., 2001).
The color of the samples was determi-ned using the colorimeter Konica Minolta®
CM-5, with illuminant D65, specular reflec-tance excluded, 30mm diameter and an observer angle of 10º. The following values were measured: a* -shades of colors that go from aquamarine (-60) until purplish red (+60); b* - shades that go from blue (-60) to yellow (+60); and L* - luminosity between shades from black to white.
The rheological measures were per-formed in a rotational rheometer (Brookfield Engineering Laboratories® DVIII Ultra
cylinders, adapter for small samples 13R/ RP (19.05mm diameter and 64.77mm depth; Brookfield Engineering Laboratories®,
Stoughton, USA) and coaxial shearing sen-sor SC4-25 (4.78 mm diameter and 13.21 length; Brookfield Engineering Laboratories®,
Stoughton, USA). An ultra thermostatic bath (Nova Ética, Vargem Grande Paulista, SP, Brazil) was coupled to the rheometer to adjust the temperature of the sample. Samples with approximately 9.5 mL each were allowed to equilibrate at 5 ºC for 10 min and subjected to a pre-shear treatment.The flow curves of the beverages were determined using the increasing ramp of distortion rate (0.02 at 37.42 s-1). Each test took 8 minutes and 50
seconds, with 17 points taken. The tests were carried out in triplicate. A new sample was used for each repetition, to avoid possible time effects. For the shearing tension values and distortion rate, the rheological parame-ters were calculated by Herschel-Bulkley’s method, represented by Equation (1) (PENNA et al., 2001; OZEN; KILIC, 2009).
γ
σ
σ
K
n+
= 0 (1)
In which s : shear stress [Pa], g : dis-tortion rate [s-1], s
0: initial shear stress [Pa] K,
consistency index [Pa·s] and n : fluid behavior index (dimensionless).
An analysis of variance was performed for the physical and chemical results, with the objective of detecting significative differences between the commercial brands of fermen-ted dairy beverages. The differences between the means were compared by Tukey’s test, at 5% of significance. The statistical analysis were performed using the statistical software SISVAR® (FERREIRA, 1999).
RESULTS AND DISCUSSION
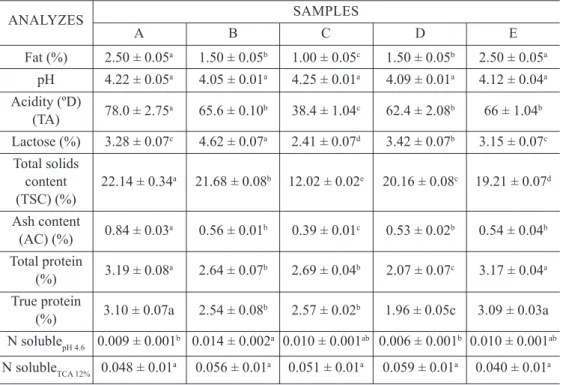
Table 1 presents the results of the physicochemical analysis performed on the
commercial dairy beverages. With respect to fat content, samples B, C and D did not fulfill the requirements of the Technical Regulation on Identity and Quality of Whey-based Drinks. These brands presented fat content less than 2%, which is the minimum required by legislation (BRASIL, 2005) for this product. This result indicates the use of raw material with low amount of lipids in the formulation of the beverages, without the proper label indication.
The pH values did not present any significant difference (p > 0.05), varying between 4.05 and 4.22 (Table 1). Similar values were reported by Donkor et al. (2006), Pescuma et al. (2010) e Debon et al. (2010) (4.08, 4.2 and 4.27) for commercial dairy beverages, fermented dairy beverages and fermented milk, respectively, along the storage. The lactic acid level (TA), expressed in Dornic degrees, was distinct for different brands, being greatest in sample A, follo-wed by B, D, and E; brand C presented the lowest level of TA. The values found were similar to those found in fermented dairy beverages with 7 days of storage 69.17 ± 9.06 ºD by Bassi et al. (2012), except for brand C. As observed, independently from the acidity of the beverages, the pH value did not alter proportionally. That is due to the great buffering capacity of the proteins and phosphates present in the formulation of the beverage (WALSTRA et al., 2006).
The analyzed samples presented diffe-rences with respect to the amount of lactose. Brands A and E presented the lowest lactose content and the greatest TA index among the analyzed brands. High tritratable acidity indices were related to the low lactose content due to the action of lactic bacteria, which consume lactose generating lactic acid. This relationshipwas not observed in brand C, which presented low level of TA%, lactose content, total solidsand ash content. Borges et al. (2010) researched the lactose level in
liquid yogurts commercialized in Portugal; the found valued vary from 2.10 to 4.18 g/100g, amounts similar to those found in the dairy beverages analyzed in this study.
The percentage of both total solids content and ash content was different for every examined sample. Except for brand C, the values found were close to those obtained by Penna et al. (2001) (19.01 to 21.71%) and Thamer; Penna (2006) (0.61 to 0.53%), who analyzed fermented dairy beverages. Concerning to total protein, every sample was within the requirements of the Technical Regulation on Identity and Quality of Whey-based Drinks, since protein levels were superior to 1.7g/100g for all brands. The samples A and E showed greater protein content, followed by samples B and C. The
smallest protein fraction was found on sample D. All the values found were above those observed in fermented dairy beverages (2%) produced with up to 50% cheese whey by Almeida et al. (2001) and similar to those obtained by Castro et al. (2008), of 2.70% for beverages formulated with 30% of cheese whey. The regulation of the proteolysis intensity of the dairy cultures is necessary to avoid the development of serious flaws in the products along their shelf life, such as consistency reduction and increase of acidity (GURGEL; OLIVEIRA, 1995). Almeida et al. (2001) observed low proteolytic activity during the stocking of fermented dairy beverages formulated with yogurt culture.
It was possible to verify that every brand had starch in its formulation. Starch is largely
Table 1 – Physicochemical characterization of commercial dairy beverages
ANALYZES SAMPLES A B C D E Fat (%) 2.50 ± 0.05a 1.50 ± 0.05b 1.00 ± 0.05c 1.50 ± 0.05b 2.50 ± 0.05a pH 4.22 ± 0.05a 4.05 ± 0.01a 4.25 ± 0.01a 4.09 ± 0.01a 4.12 ± 0.04a Acidity (ºD) 78.0 ± 2.75a 65.6 ± 0.10b 38.4 ± 1.04c 62.4 ± 2.08b 66 ± 1.04b (TA) Lactose (%) 3.28 ± 0.07c 4.62 ± 0.07a 2.41 ± 0.07d 3.42 ± 0.07b 3.15 ± 0.07c Total solids content 22.14 ± 0.34a 21.68 ± 0.08b 12.02 ± 0.02e 20.16 ± 0.08c 19.21 ± 0.07d (TSC) (%) Ash content 0.84 ± 0.03a 0.56 ± 0.01b 0.39 ± 0.01c 0.53 ± 0.02b 0.54 ± 0.04b (AC) (%) Total protein 3.19 ± 0.08a 2.64 ± 0.07b 2.69 ± 0.04b 2.07 ± 0.07c 3.17 ± 0.04a (%)
True protein 3.10 ± 0.07a 2.54 ± 0.08b 2.57 ± 0.02b 1.96 ± 0.05c 3.09 ± 0.03a
(%)
N solublepH 4.6 0.009 ± 0.001b 0.014 ± 0.002a 0.010 ± 0.001ab 0.006 ± 0.001b 0.010 ± 0.001ab
N solubleTCA 12% 0.048 ± 0.01a 0.056 ± 0.01a 0.051 ± 0.01a 0.059 ± 0.01a 0.040 ± 0.01a
Averages with the same letters, on the same line, are not significantly different among themselves according to the Tukey test (p > 0.05).
employed in foods as additive to achieve the desirable stability, elasticity, viscosity and to create the desired texture (MARUYAMA et al., 2006). Starch is within the optional non-dairy ingredients foreseen by the Technical Regulation on Identity and Quality of Whey-based Drinks. However, the same legislation foresees that its addition must be indicated on the label (BRASIL, 2005). This information was not observed on the labels of any of the studied brands, which implies that such brands are not within the requirements of product regulation.
Table 2 presents the results of the ave-rage values and the standard deviation of the luminosity parameters (L*) and the color coordinates (a* and b*). All samples diffe-red among themselves with respect to color (p < 0.05). Brand B stood out as the darkest tone (least value of L), followed by sample E. The use of low concentrations of cheese whey in the composition of dairy beverages can decrease the L* values of samples due the increase in the total solids in the product. High solids content decreases the reflection of light, making product darker, as obser-ved in strawberry flavored dairy beverages from buffalo milk (CALDEIRA et al., 2010). Taking into consideration that the studied beverages were strawberry flavored, the a* parameter must be analyzed with relevance,
since it expresses how red the sample is. All samples presented positive a* values, tending to red color. Brand B had the most intense red coloration, followed by brand E. The differences found among the brands could be attributed to the different combinations of colorant and other ingredients used in their formulation. The a* parameter expresses the variation of colors from blue to yellow. All analyzed brands somewhat tended to the color yellow, except from brand C, which presen-ted a negative b* value. Similar results were observed by Caldeira et al. (2010), in which the coloration of the samples of strawberry flavored dairy beverages tended to the color red (a* > 0) and to yellow (b* > 0).
The rheological parameters obtained using the Herschel-Bulkley model are shown in Table 3. The correlation coefficients (R²) were greater than or equal to 0.982 for all samples, evidencing good fit of the expe-rimentation points with the proposed model. All brands of analyzed dairy beverages pre-sented a typical non-Newtonian fluid beha-vior, evidenced in Figure 1, which shows the non-linear relation of the shear stress with the shear rate of the beverages. Similar beha vior was obtained by Pena et al. (2001) and Castro et al. (2008), for commercial dairy beverages and for probiotic fermented dairy beverages, respectively.
Table 2 – Average values and standard deviation of the luminosity parameters (L*) and
chromaticity (a* e b*) of the color analysis of strawberry flavored fermented dairy beverages
SAMPLES L* a* b* A 75.73 ± 0.01b 16.51 ± 0,01c 2.02 ± 0.01c B 68.98 ± 0.01e 30.74 ± 0.02a 5.48 ± 0.02a C 74.96 ± 0.02c 13.24 ± 0.03e -0.36 ± 0.02e D 78.52 ± 0.01a 15.04 ± 0.01d 0.96 ± 0.01d E 73.05 ± 0.01d 27.60 ± 0.01bb 4.27 ± 0.01b
Averages with the same letters, on the same line, are not significantly different among themselves according to the Tukey test (p > 0.05).
As seen in Table 3, the beverages pre-sented a pronounced pseudo-plastic behavior. This trend can be observed by low value of flow index (n), less than 1 (between 0.28 and 0.45) and the high value of consistency in-dex (K). According to Chhabra; Richardson (2008), these characteristics are typical of a pseudo-plastic non-Newtonian fluid behavior.
The consistency index (K) is a parame-ter that informs about the viscous properties of fluids – greater values of K indicate more viscous behavior (KARACA et al., 2009).
Sam ple A presented the greatest consistency index (K), while sample E proved to be the least viscous sample among the analyzed ones.
The initial shear stress (s0) refers to
the independent term of the proposed mo del (Equation 1). Negative values of s0 can be attributed to an insufficient number of points taken from the initial region of the curve of shear stress vs. shear rate during the rheo-logical evaluation (OZEN; KILIC, 2009). Ne-gative values for s0 were also observed by PENNA et al. (2001).
Table 3 – Rheological parameters obtained through the Herschel-Bulkley model of the strawberry
flavored fermented dairy beverages at 5 ºC
RHEOLOGICAL PARAMETERS
SAMPLES Consistency index, Flow behavior Initial shear stress, R²
K (Pa s) index, n σ0 (mPa)
A 2.866 ± 0.07a 0.28 ± 0.03b 1.01 ± 0.06a 0.996
B 2.160 ± 0.07b 0.44 ± 0.01a -0.02 ± 0.07d 1.000
C 2.060 ± 0.12b 0.45 ± 0.02a 0.12 ± 0.09c 1.000
D 2.022 ± 0.09b 0.28 ± 0.03b -0.36 ± 0.06e 0.991
E 0.970 ± 0.15c 0.42 ± 0.02a 0.29 ± 0.07b 0.982
Averages with the same letters, on the same column, are not significantly different among themselves according to the Tukey test (p > 0.05).
Figure 1 – Relation between the shear rate and the shear stress described by the Herschel-Bulkley
On Figure 2, a decrease in apparent vis-cosity was noticed, as the shear rate increased for all the fermented dairy beverages.
According to Vidal et al. (2006), this behavior is due to modifications on the structure of the molecules with the increase of the velocity gradient. The chains of molecules tend to align themselves in parallel to the chain lines, which contributes to the decrease of leaking resistance. According to Horne (1998) and Lucey (2002), the decrease of apparent viscosity in the samples, with the increase of the distortion rate, may have occurred due to the destruction of the weak existing physical bonds and to the decrease of interaction energy among the molecules. Horne (1998) defines molecular energy interaction as the sum of electrostatic repulsion and hydrophobic interaction; therefore, the decrease of apparent viscosity in samples with the increase of the distortion rate could be the result of the destruction of these interactions.
CONCLUSIONS
This study revealed that samples from different brands of fermented dairy beverages commercialized in the southern region of
Minas Gerais present a wide diversitywith respect to the physicochemical and rheological characteristics. It was observed that some samples presented a lowerlevel of dairy lipids than that required by legislation, as well as the unlabeled presence of starch in their composition.
The Hershel-Bulkley model allowed the determination of the rheological parameters for commercial fermented dairy beverages. All samples presented a pseudo-plastic non-Newtonian characteristic. Sample A presented the more viscous behavior while sample E proved to be the least viscous among the analyzed samples.
ACKNOWLEDGEMENTS
We would like to thank Universida-de FeUniversida-deral Universida-de Lavras (UFLA) for structural support and “Conselho Nacional de Desen-volvimento Científico e Tecnológico” (CNPq) for the financial support.
REFERENCES
ALMEIDA, K. E.; BONASSI, I. A.; ROÇA, R. O. Características físicas e químicas de bebidas lácteas fermentadas e preparadas
com soro de queijo minas frescal. Ciência e Tecnologia de Alimentos, v. 21, n. 2, p.
187-192, 2001.
ASSOCIATION OF OFFICIAL ANALY-TICAL CHEMISTS (AOAC). Official me thods of analysis of AOAC international.
16ª ed. Washington:AOAC, 1995. v. 1-2. BASSI, L. G. et al. Evaluation of physicochemical, microbiological and sensorial characteristics of fermented milk beverages with buttermilk addition.
International Journal of Dairy Technology,
v. 65, n. 2, p. 282-286, 2012.
BORGES, T. et al. Quanta lactose há no meu iogurte? Acta Pediatrica Portuguesa, v. 41.
n. 2, p. 75-78, 2010.
BRASIL. Ministério da Agricultura, Pecuá-ria e Abastecimento. Instrução Normativa nº 16,de 23 de agosto de 2005. Aprova o Regulamento Técnico de Identidade e Qua-lidade de Bebida Láctea. Diário Oficial da República Federativa do Brasil, Brasília,
24 ago. 2005. Seção 1, p. 7.
BRASIL. Ministério da Agricultura, Pecuária e Abastecimento. Instrução Normativa nº 68, de 12 de dezembro de 2006. Oficializa os métodos analíticos oficiais físico-químicos, para controle de leite e produtos lácteos.
Diário Oficial da República Federativa do Brasil, Brasília, 14 dez. 2006. Seção 1, p. 8.
CALDEIRA, L. A. et al. Desenvolvimento de bebida láctea sabor morango utilizando diferentes níveis de iogurte e soro lácteo obtidos com leite de búfala. Ciência Rural,
v. 40, n. 10, p. 2193-2198, 2010.
CASTRO, F. P. et al. Effect of oligofructose incorporation on the properties of fermented probiotic lactic beverages. International
Journal of Dairy Technology, v. 62, n. 1, p.
68-74, 2008.
CHHABRA, R. P.; RICHARDSON, J.
F. Non-Newtonian flow and applied
rheology: engineering applications. Oxford:
Butterworth-Heinemann, 2008. 519p. DEBON, J.; PRUDÊNCIO, E. S.; PETRUS, J. C. C. Rheological and physico-chemical characterization of prebiotic microfiltered f e r m e n t e d m i l k . J o u r n a l o f F o o d Engineering, v. 99, n. 2, p. 128-135, 2010.
DONKOR, O. N. et al. Effect of acidification on the activity of probiotics in yoghurt during cold storage. International Dairy Journal,
v. 16, n. 10, p. 1181-1189, 2006.
FERREIRA, D. F. SISVAR: Sistema de Análise de Variância para dados balan-ceados, versão 4.0. Lavras: DEX/UFLA,
1999.
GURGEL, M. S. C. A.; OLIVEIRA, A. J. Avaliação das características físico-químicas do iogurte. Leite e Derivados, v. 22, p.
38-43, 1995.
HORNE, D. S. Casein interactions: casting light on the Black Boxes, the structure in dairy products. International Dairy Journal, v. 8,
n. 3, p. 171-177, 1998.
KARACA, O. B. et al. The functional, rheo-logical and sensory characteristics of ice cream with various flat replacers. Inter-national Journal of Dairy Technology, v.
62, n. 1, p. 93-99, 2009.
KRÜGER, R. et al. Desenvolvimento de uma bebida láctea probiótica utilizando como substratos soro de leite e extrato hidrossolúvel de soja. Alimentos e Nutrição, v. 19, n. 1, p.
LUCEY, J. A. Formation and physical properties of milk protein gels. Journal of Dairy Science, v. 85, n. 2, p. 281-294, 2002.
MARUYAMA, L. Y. et al. Textura instru-mental de queijo petit-suisse potencial-mente probiótico: influência de diferentes combinações de gomas. Ciência e Tecnologia de Alimentos, v. 26, n. 2, p. 386-393, 2006.
MASSON, L. M. P. et al. Effect of ultra-high pressure homogenization on viscosity and shear stressof fermented dairy beverage.
LWT-Food Science and Technology, v. 44,
n. 2, p. 495-501, 2011.
MELLENTIN, J. 12 key trends in food nutrition and health 2014. London; New
Nutrition Business, 2013.
OZEN, A. E.; KILIC, M. Improvement of physical properties of nonfat fermented milk drink by using whey protein concentrate.
Journal of Texture Studies. v. 40, n. 3, p.
288-299. 2009.
PENNA, A. L. B.; SIVIERI, K.; OLIVEIRA, M. N. Relation between quality and rheo-logical properties of lactic beverages. Jour nal of Food Engineering, v. 49, n. 1, p. 7-13,
2001.
PEREIRA, D. B. C.; SILVA, P. H. F. da;
COSTA JUNIOR, L. C. G.; OLIVEIRA, L. L. de. Físico-química do leite e derivados: métodos analíticos. 2ªed. Juiz de Fora:
Epamig, 2001. 234p.
PESCUMA, M. et al. Functional fermented whey-based beverage using lactic acid bacteria. International Journal of Food Microbiology, v. 141, n. 1-2, p. 73-81, 2010.
SEIBEL, N. F.; CANSIAN, R. L. Análise de diferentes concentrações de soro na produção de bebida láctea. Leite e Derivados, v. 9, n.
52, p. 44-49, 2000.
STEFFE, J. F. Rheological methods in food process engineering. 2 ed. East Lansing:
Freeman Press, 1996. 418 p.
THAMER, K. G.; PENNA, B. Caracteriza-ção de bebidas funcionais fermentadas por probióticos e acrescidas de prebiótico. Ciên-cia e Tecnologia de Alimentos, v. 26, n. 3,
p. 589-595, 2006.
VIDAL, J. R. M. B. et al. Propriedades reo-lógicas da polpa de manga centrifugada. Re-vista Ciência e Agrotecnologia, v. 30, n. 5,
p. 955-960, 2006.
WALSTRA, P.; WOUTERS, J. T. M.; GEURTS, T. J. Dairy Science and Technology. Boca