Who Are They? Making Non-Traditional Students Visible
Teresa Gonçalves1, António Fragoso2, C. Miguel Ribeiro2, Rute Monteiro2, Helena Quintas2, Joana Bago3, Henrique M. A. C. Fonseca3, & Lucília Santos4
Abstract
The implementation of the Bologna processes in Portugal allowed a national Law to be changed so that the access to Higher Education was made easier for mature students older than 23, who have some sort of professional experience. In this paper we’ll report the first (still superficial) results of a research project which, involving the universities of Aveiro and Algarve5, aims to study deeply non-traditional student’s situation in order to create conditions for improving their academic success and reduce dropout.
1. Theoretical Framework
The term ‘non-traditional student’ does not represent a rigid concept or points to fixed indicators to be applied in every context. Rather, it is useful for describing different groups of students that are in some way underrepresented in Higher Education (HE) (Bamber, 2008) and whose participation in HE is constrained by structural factors (RHANLE, 2009): disabled or mature students, women, students whose family has not been to university before, working-class or specific ethnic groups who do not fit the so-called ‘traditional’ major group are included, among other, in this category.
The earlier studies on non-traditional students focused on withdrawal causes (see Bean and Metzner, 1985; Tinto, 1993). Also the issues around access and widening participation had worried a number of researchers and policy-makers. In recent years, as some debates on HE are heavily focused in outcomes and productivity, retention has taken a central role. “In mass higher education systems, retention is an important and rising concern for policy-makers at national and European levels as it is considered as measure of the efficiency of higher education, in terms of the needs of the economy and as a return on investment to individuals, society and the EU” (RAHNLE, 2009, p. 2). Recent investigations are centred in understanding the causes of retention and high dropout among non-traditional students, widening traditional factors to consider social class (Bamber and Tett, 1999), gender and ethnicity, the shock of transitions accompanied by feelings of personal powerlessness (Bowl, 2001) or the level of student’s expectations (Laing, Chao and Robinson 2005). Recent studies ceased to present non-traditional students as ‘problems’, or as the ones who need to ‘adjust’ Higher Education Institutions (HEI), their organizational setting, or particular culture. The key-factors identified as causing both retention and dropout are very diverse, as we can see clearly in the literature review made by the authors of an European study on access and retention (RAHNLE, 2009), but most acknowledge learning to be crucial.
1 ESEC (Higher School of Education and Communication), University of Algarve, tigoncalves@ualg.pt,
Portugal
2 CIEO (Research Centre on Spatial and Organizational Dynamics; this centre is funded by the
Portuguese Foundation for Science and Technology - FCT), University of the Algarve, Portugal, aalmeida@ualg.pt; cmribeiro@ualg.pt; rutemonteiro@ualg.pt; hquintas@ualg.pt
3 University of Aveiro, Portugal, joanabago@ua.pt; hfonseca@ua.pt 4 CIDTFF, University of Aveiro, Portugal, lucilia.santos@ua.pt 5
Project PTDC/CPE-CED/108739/2008, Non-traditional students in HEI: searching solutions to improve the academic success, funded by the FCT.
The way that students generally perceive learning and specifically teaching situations is fundamental to the quality of their learning (Prosser and Trigwell, 1999). Consequently one must give greater attention to the underlying nature of an institution’s teaching and learning environment, the manner in which this environment influences student non-completion and the student perceptions and expectations (Laing and Robinson, 2003). In a paper based on a project designed to support non-traditional students in their transitions trough HE (in which a central assumption was inclusivity), Bamber and Tett (2000) formulate a number of propositions adapted from Bould and Miller with strong implications for the role of the educator: experience is shaped by concrete social conditions and represents the base and stimulus for learning; learning is socially and culturally constructed; learners actively construct their experience; learning is influenced by the social-emotional context in which occurs.
In the last decades, the number of students in HE Portugal has been increasing progressively (Barreto, 2002), especially when we consider women (Barreto and Preto, 2000): in the European context, Portugal is the country presenting the highest proportion of women in HE (130 for each 100 men), followed by Sweden (124), Denmark (122) and France (121). Other European countries are far away from these numbers, and in Germany, Greece, or Austria the number of men is clearly superior. In the Portuguese scenario, however, huge contradictions subsist. Again within the European context, we have the highest number of illiterates, and the highest portion of population with low levels of school certification (Barreto, 2002), calling for our attention to the issues of access – among others – of non-traditional students.
The Bologna process, recently implemented in Portugal, brought many changes to HEI. One of these changes refers to a Law that made possible students older than 23 to have special conditions to access HE. From the academic year of 2006/07 on, Portuguese universities opened their doors to these students, increasing the number of non-traditional students in HE in Portugal. Therefore, the present situation could eventually lead to the notion that access problems are partial ‘solved’. However, it makes no difference to make access easier, if dropout and retention is high. Widening the accessibility of HE has intended to promote social mobility and social development, but to reach these aims students have to stay in HE with significant levels of success (whatever the senses associated with the term) and satisfaction. And as we have argued above, learning seems important in this context. A study done in Portugal with the aim to reflect on the teaching practices at the University of Minho identified a set of factors influencing the quality of the teaching processes (Vieira et al, 2002), summarized here in three primary dimensions: 1) factors directly related to the activities of teaching; 2) the position taken by students in the context of the classroom, and factors regarding the institutional environment, 3) adequacy of organization and infrastructural support for teaching.
Taking into consideration these general trends of our theoretical framework, it is important to have a closer look to the research project’s methodology and our particular situation within the research design. Following this explanation, it will be possible to give specific details on the data we used to this paper.
3. Methodology
This recent research project will go on until 2013. It includes a first phase in which we try to reach the highest possible number of students of both universities, and that can
only be done through a parallel survey to students and teachers. It is important to have basic elements that can characterise those students for us to begin to know them. Qualitative, in-depth techniques will come after, benefiting from the analysis of the questionnaires: we intend to conduct a significant number of interviews to students, teachers and academic management, as well as biographic interviews. The focus-group interviews will be organised close to the projects end.
In this paper we will present a preliminary analysis of the University of Algarve’s student’s questionnaires. We will consider the responses we got until December 2010, in a total of 235 (from a total universe of around 470 students that entered university through this new kind of access modality to students older than 23 years). The majority of the questionnaires were answered through the internet/email, although some were answered in class.
The questionnaire is divided into several dimensions: a) Students and family characterization (age, civil status, family basic elements, education level of parents, etc.); b) Academic and professional courses (including also main reasons to entry higher education, time dedicated to studies, etc.); c) Processes of learning and teaching (feedback of learning evolution during courses, tutorials, class participation, evaluation criteria, etc.); d) socialization data (including the relationships between teacher/student and student/student, participation in academic life and even participation in cultural, religious or civic organizations outside the university).
As this represents a considerable amount of data, we had to define a particular focus to this paper and, accordingly, to choose only a few dimensions (questions / answers) of the questionnaire to present. At this stage of the project, it is important for us to know who are the students accessing university through this special access mode. Only having a good idea of who are they, can we proceed in refining our analysis and, at the same time, to be able to explore more concrete bodies of theory to frame our results. Hence we have chosen basic social-demographic data of the student’s and their families. On the other hand, we want to have a first glance on some of the factors related to the processes of learning and teaching. Thus we are going to look at some results on the methods and processes of learning and in some obstacles students reported.
We have to make clear that this questionnaire was answered by students from the 2nd and 3rd years of the bachelor and for those already enrolled in master programmes. Our team thinks this survey is not adequate for newcomers. So we built a very similar, parallel questionnaire, but adapted in some questions to students from the 1st year of bachelor degrees. We had this academic year 110 new non-traditional students and their survey is, right now, being applied (the 470 students mentioned as the total universe included newcomers). Finally, it is important to note that we intend to perform a cluster analysis; however, here we are only going to use a regular descriptive analysis of some of the items.
4. Preliminary results of the survey
4.1. Student’s social-demographic background
Contrarily to what happens to traditional students, there is a large percentage of male non-traditional students at the University of Algarve (59, 6%), and a small percentage of women (40, 4%). Some explanations can be given if we look at the scientific areas of
the bachelors these students choose. We arranged bachelor programme into two big scientific areas. In human and social sciences, arts, education and health technologies, there are more women than men (only a small difference tough). But when we look at positive sciences, engineering and management, there are more men than women. But equally important is to look at the bachelor programmes that offer night courses. In the University of Algarve management, tourism management and engineering are strong night-course offers. By the contrary, the number of night bachelor programmes on social sciences, education, etc., is scarce.
In table 1 we can observe the distribution of students by the different age groups. Using 5 year groups to do this distribution, one can see that the biggest proportion of students stands in the group from 29-34. However, the percentages of students are similar in the following age groups; only after 51 years old there is a strong decrease. Roughly this means that this form of access is being elected by a wide range of working adult population. Also this means that at the long run, the age composition of students is to be changed, with an increasing proportion of mature students. In a small university such as this (we have around 10.000 students) these numbers are significant.
Table 1. Age-groups of non-traditional students Age group Percentage (%) Percentage (%)
24-28 18,7 44,7 29-34 26 35-40 17,4 32,3 41-45 14,9 46-51 15,7 19,5 52-57 3,8 58-63 0,9 1,3 64-69 0,4 (no answer) 2,1 2,1 Total 100 100
Among these 235 students, more than half (52,7%) are married (39,1%) or live with their partners (13,6%); 10,6% are divorced and, most important, approximately half of them have children (49,8%). Their working condition leaves no doubts whatsoever. In fact, the great majority of students have full time jobs (76,2%) and 8,5% has a part-time job (the sum of this two figures is 84,7%). It is equally relevant that only a small percentage of people are full-time students (5,1%).
The numbers of unemployment are very low among our students, especially when we consider that the national average is, nowadays, more than 10%. Only 2,1% are unemployed; but taking into account that the numbers of low qualified workers is huge in Portugal, the assumption that unemployment is higher among them seems logical. The educational level of the student’s fathers and mothers represents a fundamental indicator (see table 2). The first striking fact is that a great majority has very low educational levels: as much as 83,8% of the fathers and 81,7% of the mothers, data that confirm what we are used to recognize as the educational structure of a high portion of the older adult Portuguese population. Also it is important to stress that these figures include as much as 10,2% of the student’s fathers and mothers who cannot read or write/have never went to school. If we disaggregate these numbers further, one get to see that almost half of the student’s parents have only spent four years in school (46,4%, the same number for men and women). As to secondary school level (from year 9 to year 12), there is only 8,1% of fathers and 6,8 of mothers who completed this
educational level. The numbers of persons who have some kind of HE degree is 7,7% for fathers and 6,8% for mothers. This table data was a total surprise for us: the comparison between mothers and fathers shows no significant differences between women and men. Traditional educational patterns in Portugal always have included huge differences between women and men. As a pure speculation, it is possible that the big amount of resources allotted to recognition of prior learning is positively affecting this educational gender balance among older adults in Portugal.
Table 2 - Education level of non-traditional student’s parents Educational Level Father
(%) Father (%) Mother (%) Mother (%)
Cannot read or write 7,2
10,2 7,2 10,2 Can read without schooling 3,0 3,0
Up to 4th grade (or equivalent) 46,4
73,6 46,4 71,5 Up to 6th grade 9,8 6,4 Up top 9th grade 17,4 18,7 Up to 12th grade 8,1 8,1 11,1 11,1 Bachelor (1st cycle) 2,6 7,7 3,0 6,8 5 year 1st degree 3,0 3,4
1 year specialization course 0,4 0,4
Master (2nd cycle) 1,3 0
PhD 0,4 0
No answer 0,4 0,4 0,4 0,4
Total 100 100 100 100
This general situation looks completely different when we ask for the educational level of husbands. Around 22% have a secondary diploma, but 44,6% hold a HE degree of some kind, which includes a significant percentage of 6,8% holding a master or a PhD degree. In a way, this shows the natural educational evolution done in recent decades in Portugal, mainly after the 1975 revolution that ended a dictatorship regime in our country.
Finally we collected data on family incomes, which conveyed very clear results. The aggregate family incomes are very low among non-traditional families. As much as 23% of families earn less than 1.000 €/month, which corresponds to two minimum wages. 25% of the families earn between 1.001 and 1.500 € and another 20% earn between 1.501 and 2.000 €. Therefore one could say that 68% of the non-traditional students make low incomes.
4.2. Academic paths
The forms of access we have been discussing allow students to enter HE without completing secondary studies. Analyzing their educational level at the time they entered HE reveals four different general patterns: there is a first group of students (30,7%) that did not completed secondary school (12 years of schooling, compulsory, nowadays); a second group of students almost finished secondary school but failed in some concrete disciplines such as Portuguese and Mathematics; and there is a third group of students that finished with success secondary school, but through equivalent alternatives means, such as professional courses or second opportunity education. There is also a fourth group of students, even if underrepresented (13,6%) compared to the remaining groups: the ones who entered university only with a 9th grade school diploma or equivalent who, presumably, will have a harder task in HE due to their educational background. This represents an angle of analysis that we will have to look after.
We asked the students how long ago they interrupted their (formal) education, a question that seems logic taken into account the mature learners. As it seems natural, these answers relate directly to the distribution of students by age groups. Around 18% of the students went back to learning after a period of 5 to 10 years; the majority (23%) after 6 to 11 years; 16% after 12 to 16; 14% after 17 to 21; and 13% is back on learning after spending from 22 to 27 years without any contact with formal education (the groups who went back after 30 or more years are underrepresented, but still these numbers are amazing and give us a different perspective to look at those students). If we consider that most of the mature students that have a job and a family, it is natural that time is a simple and yet important hinder in their academic life. This is especially important because some of them do not have access to night courses. Being so, we asked them if they attended class regularly or not (less than 25% of the classes; between 25 to 50%; from 50 to 75%, or more than 75%). Surprisingly (and although 28% percent of the students chosen not to answer this question), half of them claimed to attend more than 75% of their classes; 14% between 50 to 75%; only 8% of our students declared to attend between 25 to 50% of the classes and a small minority from 0-25% percent. Although student’s declared to rarely or never miss a class, a large majority said to have failed courses – 62,6%. These answers bring to our attention the issue of retention. Despite the fact that will have to present, in the end of the next academic year, objective measures of non-traditional student’s retention, the answers here given by the students already show us that, quite possibly, the levels of retention are higher among these students. The next steps, therefore, will be to understand deeply the motives beneath retention in this specific case of the universities involved in the project.
4.3. A glance at learning processes
The student’s perceptions on the teaching methods their professors use in a daily basis are very important. As one could expect, students claim that, mostly, professors give lectures, simply talking at the students (88,9%). Group work, however, comes in ‘second place’ (67,2%) and, curiously enough, evaluation activities of some kind come thirdly (39,6%), although at a significant “distance” from lectures and working in groups. Discussing articles, debates based in audiovisual resources and presentations of student’s works are also significant in the student’s perception (roughly from 28 to 30%). The other possibilities we presented proved not to be significantly used, from our student’s perspective.
Also we tried to get student’s perceptions on a number of general dimensions that are supposed to influence learning processes. The following table summarizes student’s opinions, ordered by crescent mean rank. That is, the lower mean corresponds to the statements they tend to disagree more with; medium values represent statements to which they (simply) agree, and higher values represent statements students tend to agree fully.
Table 3: Student’s perceptions on general learning process dimensions
Mean Rank
Generally speaking, there is a balance between theory and practice in your programme 9,35 Globally, the number of hours of the courses are suited to learning processes 9,7
Tutorial sessions are significant to your learning process 9,80
Professors give you feed-back on your learning’s evolution 9,96
Professors show themselves available to change / integrate student’s suggestions during classes 10,21
Professors stimulate critical thought and student’s autonomy 10,36
Professors offer themselves to support student’s outside class 10,77
Professors do their duties when it comes to the planned teaching activities 11,09 Evaluation methods and criteria are presented and discussed with the students at the beginning of the
courses 11,22
Traineeships and internships are important for your learning process 11,73
Mature students value more negatively (with a lower mean) two statements concerning the organization of the curriculum: first, the number of hours they have got to attend in class is not considered adequate to learning. Of course, the problem is that two possibilities arise: students think they spend too much time in class; or students think they should have more time in class. If we could make previsions based on our own experience in teaching, we would say the number of hours they spend in class if too high. Secondly, students consider their curricula to be fundamentally theoretical. In other words, there is not enough practice in the curriculum, resulting in an unbalance relation between theory and practice. The other two statements students value more negatively are, not the curricula as an external causal factor, but something that do affect students directly (tutorials and feed-back). It is important to say that our version of tutorial sessions is relatively new. Tutorial sessions were imagined, in our university, as a space where teachers could help students to organize their autonomous work. But in our experience (this has, of course, a limited value) there is, among the staff, a significant confusion that allowed very different ‘models’ to pop-up. It is therefore natural that students distrust tutorials or, maybe, just cannot see the use of it. Concerning professors’ tasks students refer the need of having more and fruitful feedback on their learning’s evolution. Feed-back, in our opinion, is one of the most powerful instruments to foster learning; is student’s do not know exactly what should they improve or correct, how can they do it? The lack of feed-back seems to have a blocking effect on learning.
On the other hand non-traditional student’s attribute the highest evaluation/importance to the role of the traineeships and internships in their learning process (this is probably related with their live experiences), followed by the fact that professors discuss the evaluation at the beginning of courses as well as by the fact that the planned activities were accomplished. Dimensions concerning the role of the professors (e.g. stimulate students autonomy, participation; availability to support students outside classes, and/or to change or integrate student’s suggestions during class) vary accordingly different perspectives and experiences and thus, those answers reflect the “simply agree”. These types of answers (only ‘agree’) are the ones more difficult to make sense of, when we use a survey. It is important to stress that we used a 6 points scale precisely to avoid an artificial ‘mean’ effect – that nevertheless can always happen.
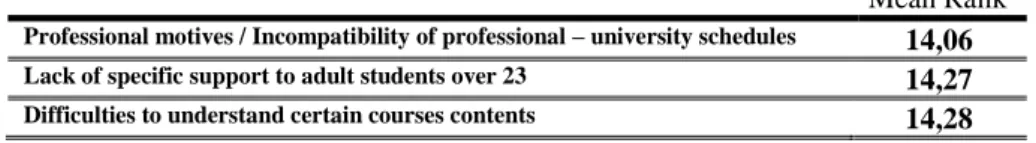
A different feature of the learning process concerns the main obstacles as perceived by students throughout their education at university. The data in the following table summarizes such perceptions. Here the mean rank must be read conversely (the lower the mean, the highest obstacle).
Table 4: Student’s perceptions of the obstacles to learn throughout their education university Mean Rank
Professional motives / Incompatibility of professional – university schedules 14,06
Lack of specific support to adult students over 23 14,27
The bachelor / master programme your in does not match your expectations 14,36
Income difficulties 14,38
Lack of motivation 14,46
Lack of structural conditions (equipment, labs, etc.) 14,46
Students declare that amongst the most blatant obstacles are the difficulties to make work and study at the university compatible. It is possible that these opinions reflect the low proportion of night courses at our university. Compatibility is always a problem (compatibility with family time, leisure, etc.), but it can be unsolvable if students are forced to a daily schedule where they have reduced chances of attending. Equally important is the lack of specific support to mature students and the difficulties to understand certain courses contents. Jointly, the lack of support and the difficulties in understanding the contents will surely make them feel lost and opens the door to retention. These results may be connected with the item ‘how long ago they interrupted
their (formal) education. People stood a long period away from the formal systems of
formal education, generally speaking. Plus, they returned to HE, which as an institution has its particular organization, culture, rules and principles, in some ways pretty different from the remaining educational organizations. It is not easy to (re)gain study and research routines, and to move comfortably in HEI understanding the context. Specific structures to support non-traditional students could eventually make the difference and it is with great concern that we witness the real and objective lack of such structures. The fact that students perceive subjectively the importance of such structures to support them gives additional strength to the argument.
Another set of obstacles to the learning process (with a mean in the order of 14,3) concerns the bachelor/master choice (frustrated expectations) and some income difficulties. Most of them have a family that could support them; but data on family income shown above make this option very limited. Being so, the fact that this is only the fifth obstacle to be considered, reveals the importance that these students attribute to their university education. Finally, evaluated as a lower important obstacle, there is the lack of motivation and structural conditions (both with a mean of 14,46 to which corresponds a total of only 20 answers).
5. Discussion
We have to start by stressing that only some items of our questionnaires could be analysed, and cluster analysis, which will make clear some of the connections between the several items, is still to be done. Also the number of answers to our survey has increased over the last two months, and that will make our data more consistent. Altogether, this means that we have to be cautious in our preliminary and superficial analysis. Even so, there are some points we would like to emphasize:
1. The students who entered university through this new form of access are typically mature students who have a job and a family to take care, low family incomes, and low parents educational background (some have low educational levels also), with a high possibility of being the first ones in their family to access university and who spent a number of years apart from formal educational organisations. They are surely different from traditional students but, more than that, they are surely working-class. This fact opens up new theoretical tools that we will explore in the future.
2. A number of scattered answers (scattered among different categories) seem to indicate high levels of motivations to this return to learning. Not only because they seem to relegate their obvious low income situation to a secondary role, but also, for instance, because regardless some structural problems presented by the university (not enough night courses, no specific structures to support non-traditional students) they attend classes quite regularly.
3. Despite of this fact, they claim to have failed in some of their courses, showing us that retention can be a problem. This claims for the deeper analysis of this issue and, at the same time, to the urgency of finding objective data both on retention and dropout.
4. Regarding the factors that affect learning, there is a certain tendency to answer neutrally. However some interesting positive and negative factors that influence learning have been identified, externally (in the sense that curricula building can be considered ‘external’) and internally (referring to teaching methods, for example). 5. These first superficial results have to be reviewed when, soon, we will close the
student’s survey; and then we will be able to compare some results with the teacher’s survey (currently underway). After a careful cluster analysis, we will be ready for staring a major phase of the project: to begin in-depth interviews that will benefit from the results of the phase we are presently.
6. Acknowledgements
This paper was made possible in part by the support of the Portuguese Foundation for Science and Technology (FCT).
7. References
Bamber, J. (2008). Foregrounding Curriculum: Ditching deficit models of non-traditional students. Paper presented to the Educational Journeys and Changing Lives. Seville, 10-12 de December.
Bamber, J., & Tett, L. (2000). Transforming the Learning Experiences of Non-traditional Students: a perspective from higher education, Studies in Continuing Education, 22(1), pp. 57-75.
Bamber, J., and Tett, L. (1999). Opening the doors of higher education to working class adults: a case study, International Journal of Lifelong Education, 18(6), pp. 465-475.
Barreto, A. (2002). Tempo de incerteza, Lisboa:Antropos
Barreto, A., & Preto, C. V. (2000). Indicadores Sociais: Portugal, 1960-2000. In António Barreto (org.), A Situação Social em Portugal 1960-1999, vol. II (pp. 77-248). Lisboa: Imprensa de Ciências Sociais.
Bean, J.P. and Metzner, B. S. (1985). A conceptual model of non-traditional undergraduate student attrition, Review of Educational Research, 55(4), pp. 485-540.
Bowl, M. (2001). Experiencing the barriers: non-traditional students entering higher education, Research Papers in Education, 16(2), pp. 141-160.
Crespo, V. (2003). Ganhar Bolonha, Ganhar o Futuro – O Ensino Superior no Espaço Europeu, Gradiva. Jarvis, P. (2004). Adult Education & Lifelong Learning. Theory and Practice. 3ª Ed. RoutdledgeFalmer Laing, C., & Robinson, A. (2003). The Withdrawal of Non-traditional Students: developing and
explanatory model, Journal of Further and Higher Education, 27(2), pp. 175-185.
Laing, C., Chao, K., and Robinson, A. (2005). Managing the expectations of non-traditional students: a process of negotiation, Journal of Further and Higher Education, 29(2), pp. 169-179.
Prosser, M., & Trigwell, K. (1999). Understanding learning and teaching: the experience in higher education. Buckingham: Open University Press.
RANHLE (2009). Literature Review from the project Access and Retention: Experiences of Non-traditional learners in HE, accessed
Tinto, V. (1993). Leaving College: rethinking the causes and cures of student attrition. London: University of Chicago Press.
Vieira, F., Gomes, A., Gomes, C., Silva, J. L., Moreira, M. A., Melo, M. C., & Albuquerque, P. B. (2002). Concepções de pedagogia universitária. Um estudo na Universidade do Minho. Braga: Centro de Estudos em Educação e Psicologia, Universidade do Minho.