doi: 10.3389/fmars.2020.570361
Edited by: Zhijun Dong, Yantai Institute of Coastal Zone Research (CAS), China Reviewed by: Pablo Saenz-Agudelo, Austral University of Chile, Chile Anja Schulze, Texas A&M University at Galveston, United States *Correspondence: Carlos M. Duarte [email protected]
Specialty section: This article was submitted to Marine Evolutionary Biology, Biogeography and Species Diversity, a section of the journal Frontiers in Marine Science Received: 07 June 2020 Accepted: 30 September 2020 Published: 22 October 2020 Citation: Lim KK, Rossbach S, Geraldi NR, Schmidt-Roach S, Serrão EA and Duarte CM (2020) The Small Giant Clam, Tridacna maxima Exhibits Minimal Population Genetic Structure in the Red Sea and Genetic Differentiation From the Gulf of Aden. Front. Mar. Sci. 7:570361. doi: 10.3389/fmars.2020.570361
The Small Giant Clam, Tridacna
maxima Exhibits Minimal Population
Genetic Structure in the Red Sea and
Genetic Differentiation From the Gulf
of Aden
Kah Kheng Lim1,2, Susann Rossbach1,2, Nathan R. Geraldi1,2,
Sebastian Schmidt-Roach1, Ester A. Serrão3and Carlos M. Duarte1,2*
1Red Sea Research Center, Biological and Environmental Science and Engineering Division, King Abdullah University
of Science and Technology, Thuwal, Saudi Arabia,2Computational Bioscience Research Center, Biological
and Environmental Science and Engineering Division, King Abdullah University of Science and Technology, Thuwal, Saudi Arabia,3Centro de Ciências do Mar (CCMAR), Faculty of Sciences and Technology, Universidade do Algarve, Faro,
Portugal
The Red Sea serves as a natural laboratory to investigate mechanisms of genetic differentiation and population dynamics of reef organisms due to its high species endemism. Giant clams, important yet understudied coral reef engineering species, are ideal candidates for such study in this region. This paper presents the first population genetics study of giant clams covering the entire East coast of the Red Sea. Our study aimed to investigate the population structure of the small giant clam, Tridacna maxima, based on 501-bp fragment of the cytochrome c oxidase I gene from 194 individuals (126 new sequences from this study plus 68 sequences from GenBank), collected from 14 locations in the Red Sea and Gulf of Aden (RSGA). For the genetic analysis, each sampling site was treated as a population. T. maxima showed high genetic diversity, with high gene flow in almost all sampling sites. The insignificant global φST-value of
0.02 (p> 0.05) suggests the presence of one large, panmictic population across a wide range of temperature and salinity gradients in the RSGA. Despite this, the population in Djibouti was genetically differentiated from the other 11 populations in the Red Sea, suggesting a connectivity break between the Red Sea and the Gulf of Aden. These results could be explained by the oceanographic features facilitating wide larval transport inside the Red Sea, and creating a dispersal barrier to the Gulf of Aden. Besides larval dispersal by currents, apparent successful establishment following dispersal is probably facilitated by the mode and time of reproduction as well as the ability of T. maxima to achieve high fitness in the highly variable environmental conditions of the Red Sea. Keywords: tridacnine, conservation, oceanographic barriers, population genetics, species distribution
INTRODUCTION
The Red Sea provides an unprecedented opportunity to conduct studies of the origins and maintenance of biological diversity, owing to its recent geological history and high marine species endemicity, especially among a few groups of reef fishes and marine invertebrates (Berumen et al., 2013; DiBattista et al., 2016b). Such high rates of endemism in the Red Sea is thought to be caused by the partial isolation by the Gulf of Aden strait of Bab al-Mandeb in the South, where the environmental conditions limit dispersal between the Red Sea and the Indian Ocean (Kemp, 2000). However, the coral reef biodiversity of the Red Sea is facing a wide array of anthropogenic threats, such as overfishing (Hasan, 2005; Richter et al., 2008; Spaet and Berumen, 2015), unsustainable tourism (Gladstone et al., 2013) and habitat destruction (Badr et al., 2009). Marine invertebrates constitute the most diverse organisms on reefs but are prone to such threats; yet, studies on these organisms are limited in this region (Berumen et al., 2013).
Giant clams, are flagship coral reef species (Soo and Todd, 2014), where they play important ecological roles. These large mollusks act as ecosystem-engineers in coral reefs by supporting high calcification rates (Rossbach et al., 2019) and helping to maintain the overall reef biodiversity and functionality (Neo et al., 2015). Giant clams are generally found on shallow reefs, where light is essential for the survival, growth, and reproduction (van Wynsberge et al., 2017) because the mantle tissue is packed with extracellular single-celled algae of the Symbiodiniaceae family (Taylor, 1969;Yonge, 1975). These algal symbionts within the clams are vulnerable to prolonged thermal stress that can result in giant clam bleaching (Junchompoo et al., 2012). Although mass coral bleachings were reported for the reefs in the central Red Sea in 2010 and 2015 (Furby et al., 2013; Monroe et al., 2018), no giant clam bleaching was observed (SR, pers. obs.), suggesting that Red Sea giant clams have a higher bleaching thermal threshold than corals in the same reef.
Despite their ecological importance, giant clams in the Red Sea suffer from several human-mediated threats (Mekawy and Madkour, 2012). Their population size declined to less than 5% in the 1980s and 1990s (Bodoy, 1984; Kilada et al., 1998) due to harvest for the ornamental aquarium trade (Kilada et al., 1998; Wabnitz et al., 2003) and also for their meat and shells (Ashworth et al., 2004). Giant clam populations are highly vulnerable to over-exploitation because they are conspicuous and sedentary, and have slow rates of maturity and sporadic spawning (Chambers, 2007;van Wynsberge et al., 2016). Given their population decline and the vast array of threats, conservation actions are needed, for which it is important to understand the genetic structure and scales of population connectivity along their distribution. A population genetics approach to resolving population connectivity can provide evidence on the common patterns shaping biodiversity and regional limits to connectivity. Knowledge of such patterns encourages the development of transboundary management plans for ecosystem conservation. Although the connectivity
pathways in marine systems have been reported to vary between closely related species over similar spatial scales (Bargelloni et al., 2003, 2005; Charrier et al., 2006; Kool et al., 2013), the oceanographic drivers of connectivity are exceptionally unique in the Red Sea.
For sessile marine organisms, connectivity is typically defined by the dispersal ability of their planktonic life stages and is inextricably linked to ocean currents and topographical features that determine the success of planktonic transportation and benthic recruitment (Cowen et al., 2007). Giant clams are protandrous hermaphrodites, meaning they first mature as males and continue to bear both male and female reproductive functions throughout the rest of their life. After the spawning event, fertilized eggs hatch into larvae that drift for about 10 days before settling on a substrate as a juvenile (Soo and Todd, 2014).
Oceanographic information coupled with genetic analysis has been useful in estimating marine mollusk connectivity (Kenchington et al., 2006; Dupont et al., 2007; Wesselmann et al., 2018). The Red Sea is an ideal place to test hypotheses of oceanographic influence on genetic connectivity as the major channels of gene flow among the coral reef communities are mainly driven by the eddies and surface currents (Raitsos et al., 2017). Previous studies have successfully used mitochondrial gene markers to estimate gene flow or larval dispersal routes of giant clams in the Indo-Pacific (DeBoer et al., 2008; Kochzius and Nuryanto, 2008; Neo and Todd, 2012) in relation to ocean current patterns (Benzie and Williams, 1992a; Macaranas et al., 1992) and geographical isolation (Benzie and Williams, 1992b). However, information on the larval dispersal or genetic diversity among the giant clams at different localities in the Saudi Arabian Red Sea is scarce, yet critical to understand evolutionary and ecological processes in a hub of marine biodiversity (Kochzius and Nuryanto, 2008).
Mitochondrial markers have been found to be suitable to resolve population genetics structures of marine bivalves (Schneider and Ó Foighil, 1999;Mohamed et al., 2006;Richter et al., 2008;Huber and Eschner, 2011;Pappas et al., 2017;Fauvelot et al., 2020), although with limited geographical scope. Previous surveys ofTridacna maxima byPappas et al. (2017)andOthmen et al. (2020)were restricted to coral reefs in the northern and central Saudi Arabian Red Sea. Here, we analyse results from a much larger survey covering reefs along the eastern coast of the Red Sea, within Saudi Arabian waters, and Djibouti at the South-western coast, to examine the genetic population structure of the small giant clam,T. maxima within the Red Sea and Gulf of Aden (RSGA). We focused onT. maxima because it is a cosmopolitan species, with more variable population densities across its range compared to otherTridacna spp. (van Wynsberge et al., 2016). This study aims to reveal the population genetic structure of T. maxima along this narrow basin, and its consistency with oceanographic conditions on the basis. Based on oceanographic features and previous studies in other taxa (Robitzch et al., 2015;Othmen et al., 2020), we hypothesize genetic homogeneity inside the Red Sea, and differentiation between the Gulf of Aden and the Red Sea.
MATERIALS AND METHODS
Study Area and Sample Collection
The Red Sea is a narrow, elongated water body, flanked by eastern Africa (Egypt, Sudan, Eritrea, and Djibouti) to the West and Arabia Peninsula (Jordan, Saudi Arabia, Yemen) to the East (Shaked and Genin, 2011). The Red Sea extends along nearly 2,000 km from the southern border with the Gulf of Aden until its northern split into two smaller gulfs, the Gulf of Suez and the Gulf of Aqaba (Shaked and Genin, 2011). Saudi Arabia’s Red Sea coastline extends approximately for 1,840 km and is divided into three distinct latitudinal provinces (North, Central, South) for the discussion in this paper. Djibouti is located at the southwestern entrance to the Red Sea. This study region features high salinities (a gradient of 37–41 from North to South), and a sea surface maximum temperature gradient of 21 to 33.8◦
C in the same direction (Sofianos and Johns, 2007;Raitsos et al., 2013;Kürten et al., 2014;Chaidez et al., 2017).
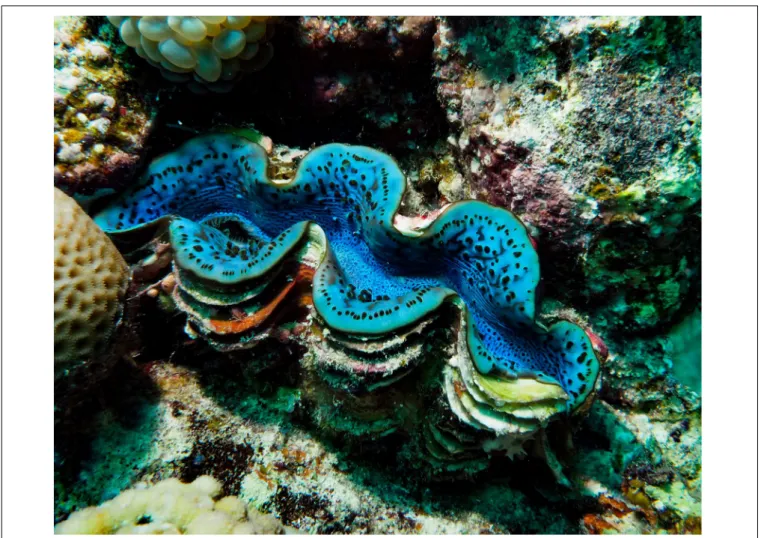
Giant clams were sampled at seven reefs along the Saudi Arabian Red Sea coast during different field trips in January and April 2018, in January 2019 and at one reef in Djibouti in March 2020 (Table 1). Samples were collected via SCUBA (depths of 0.5–11 m).In-situ images were taken (camera model: Canon G7× or Olympus Tough G5) with their mantles exposed (Figure 1), followed by the recording of the GPS coordinates of the site on the surface where the clam was found. Biopsies of mantle tissue of each tridacnid clam were cut using surgical scissors and forceps. Samples were stored at −80◦
C.
DNA Extraction, Amplification, and
Sequencing
DNA was extracted using the QIAGEN DNeasy R
Blood and Tissue Kit (QIAGEN, Hilden, Germany). The integrity of DNA was checked using a Qubit R 2.0 Fluorometer (Thermo Fisher Scientific Inc.). Two gene fragments were amplified and sequenced. For the identification of the giant clam species, a
fragment of the mitochondrial COI gene was amplified via polymerase chain reaction (PCR) with SQUA-R1 (50
-ATG TAT AAA CAA AAC AGG ATC-30
) and SQUA-F3 (50
-CAT CGT TTA GAG TAA TAA TTC G-30
) (DeBoer et al., 2008). PCR was performed using the QIAGEN R Multiplex PCR Kit (QIAGEN, Valencia, CA, United States) in a total volume of 25 µL containing 2.5 µL of genomic DNA, 12.5 µL of QIAGEN Multiplex PCR master mix, forward and reverse primers at a final concentration of 10 mM (1.25µL each) and RNase-Free water to adjust the volume. The protocol for isolating the COI gene locus was modified from (DeBoer et al., 2008) as follows: initial denaturation at 95◦
C for 15 min, 35 cycles of 94◦
C for 1 min to denature the DNA, 45◦
C for 1.5 min to anneal the DNA, 72◦ C for 1 min for elongation of the DNA, and a final elongation step at 72◦
C for 5 min. A fragment of the mitochondrial 16S ribosomal gene locus was amplified using the 16sar-L (50
-CGC CTG TTT ATC AAA AAC AT-30
) and 16sbr-H (50
-CCG GTC TGA ACT CAG ATC ACG T-30
) primers (Richter et al., 2008); PCR was conducted using the same conditions as the COI gene except for the annealing temperature and time were set to 43◦
C and 30 s, respectively according to Schneider and Ó Foighil (1999). Following PCR, samples of giant clam were checked using UV light after running in 1% agarose gel (1 × TAE) pre-stained with SYBR Safe dye (Invitrogen Corp., Carlsbad, CA, United States) under 100 V for an hour. Amplicons were bead-cleaned using Agencourt AMPure XP (Beckman Coulter). Both strands were sent for Sanger sequencing at the KAUST Bioscience Core Lab.
Sequence Alignment
A BLAST search on GenBank was carried out to confirm species identity. The isolated sequences were aligned and trimmed to a common length of 501 base pairs (bp) using Geneious R8 (Biomatters Ltd., Auckland, New Zealand). Reference sequences ofT. maxima were downloaded from GenBank and incorporated with the sequences newly generated in this study (Supplementary Table S1). The mitochondrial COI sequence
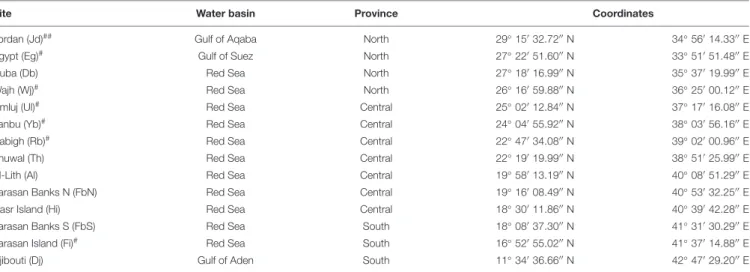
TABLE 1 | Sampling sites in the Saudi Arabian Red Sea and Djibouti with provinces and coordinates.
Site Water basin Province Coordinates
Jordan (Jd)## Gulf of Aqaba North 29◦
150 32.7200 N 34◦ 560 14.3300 E
Egypt (Eg)# Gulf of Suez North 27◦
220 51.6000 N 33◦ 510 51.4800 E
Duba (Db) Red Sea North 27◦
180 16.9900 N 35◦ 370 19.9900 E
Wajh (Wj)# Red Sea North 26◦
160 59.8800 N 36◦ 250 00.1200 E
Umluj (Ul)# Red Sea Central 25◦
020 12.8400 N 37◦ 170 16.0800 E
Yanbu (Yb)# Red Sea Central 24◦
040 55.9200 N 38◦ 030 56.1600 E
Rabigh (Rb)# Red Sea Central 22◦
470 34.0800 N 39◦ 020 00.9600 E
Thuwal (Th) Red Sea Central 22◦
190 19.9900 N 38◦ 510 25.9900 E
Al-Lith (Al) Red Sea Central 19◦
580 13.1900 N 40◦ 080 51.2900 E
Farasan Banks N (FbN) Red Sea Central 19◦
160 08.4900 N 40◦ 530 32.2500 E
Hasr Island (Hi) Red Sea Central 18◦
300 11.8600 N 40◦ 390 42.2800 E
Farasan Banks S (FbS) Red Sea South 18◦
080 37.3000 N 41◦ 310 30.2900 E
Farasan Island (Fi)# Red Sea South 16◦
520 55.0200 N 41◦ 370 14.8800 E
Djibouti (Dj) Gulf of Aden South 11◦
340 36.6600 N 42◦ 470 29.2000 E ##current study combined with reference site,#reference site.
FIGURE 1 | Red Sea Tridacna maxima with its mantle exposed.
datasets consisted were T. maxima from previous studies conducted in the Red Sea. Alignments were translated to amino acids in MEGA 7.0.14 (Kumar et al., 2016) to make sure a functional gene sequence was obtained before being used in DnaSP 5.0 (Librado and Rozas, 2009) and Arlequin v3.5 (Excoffier and Lischer, 2010) for further analyses.
Genetic Diversity and Haplotype
Parsimony Network
Genetic diversity, including the haplotype diversity h (Nei, 1987) and nucleotide diversity π (Nei and Jin, 1989) was calculated using Arlequin v3.5 (Excoffier and Lischer, 2010). To examine the phylogenetic relationships, haplotype networks were drawn in PopArt1using the TCS (Templeton et al., 1992)
network approach (95% parsimony connection limit) with the algorithm described by Clement et al. (2002) to determine the ancestral haplotype according to the neutral coalescent theory. The haplotypes were grouped into haplogroups based on the number of mutational steps and abundant haplotypes connected to several singletons (see Abyzova et al., 2018) as
1http://popart.otagoac.nz
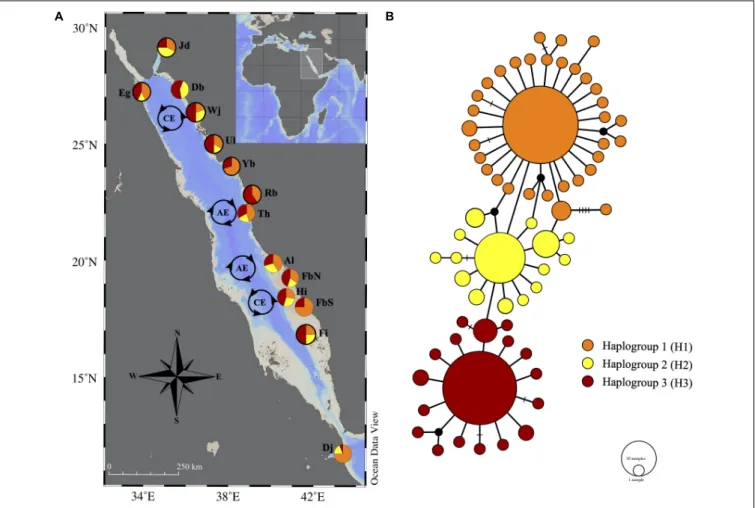
well as the Bayesian inference of phylogeny. The frequencies of each haplogroup were calculated for each sample site and transformed into pie charts on the map (see Figure 2). Each sampling site was treated as a population and genetic structure was tested with analysis of molecular variance (AMOVA; Excoffier et al., 1992). Pairwise φST values were calculated using Arlequin v3.5 with 10,000 permutations, using the T92 substitution model (Tamura, 1992) with a gamma shape parameter of 0.39 (obtained from MEGA 7.0.14). This model aims to estimate the genetic divergences between pairwise samples usingφSTbased on haplotype frequencies and molecular divergence.
Historical Demography
To test the hypothesis of whether the evolution of the COI marker is neutral, Tajima’s D test (Tajima, 1989) and Fu’s Fs test (Fu, 1997) with 10,000 permutations were performed in Arlequin v3.5. Historical population expansion was assessed by performing mismatch distribution analysis [Harpending’s raggedness index (HRI)] (Rogers and Harpending, 1992; Rogers, 1995) with 10,000 permutations in the same software.
RESULTS
Genetic Diversity
A total of 126 and 127 sequences were successfully amplified using mtCOI and 16S markers, respectively. The identification of the giant clam species was confirmed by BLAST searching the sequences in GenBank. Sequence alignments of these giant clams in the current study were deposited in GenBank (accession numbers MT324264–MT324389 and MT321353–MT321479). Our results indicated lower levels of nucleotide variation in the amplified region of 16S rRNA (transition/transversion ratio of 4.94) compared to that of COI (transition/transversion ratio of 25.62). Also, lacking of 16S reference sequences from several locations in the central Red Sea (i.e., Wajh, Umluj, Yanbu, and Rabigh) might under-represent the overall genetic diversity of the small giant clams in the eastern Red Sea, therefore the 16S sequences were excluded from further analysis. Our data combined with 68 mtCOI reference sequences from GenBank resulted in a total of 67 haplotypes with 55 singletons from 194 individuals of T. maxima (Figure 2). Among the 67 haplotypes, 45 novel haplotypes ofT. maxima, consisting of 51
sequences from all locations were identified in our study. In 501 bp of the COI gene, 66 polymorphic sites (13.2%) and 68 substitutions (60 transitions and 8 transversions) were observed. High genetic diversity was detected in half of the populations (Table 2), while the populations from the Gulf of Suez (Egypt), central Red Sea (Wajh, Umluj, Yanbu, Thuwal, and Farasan Banks N) and Gulf of Aden (Djibouti) showed low genetic diversity (all h < 0.85). Overall haplotype diversity showed little variation across populations (0.69–1.00), whereas nucleotide diversity varied from 2.57 to 6.47%, with no evident geographical pattern (Table 2).
Historical Demography
The null hypothesis of neutral evolution of the COI marker in T. maxima of the Red Sea was rejected as the overall Tajima’s D and Fu’s Fs tests were significantly negative (p < 0.01 for both), suggesting that the population has recently undergone an expansion (Tajima, 1989). Since significant results of these neutrality tests either indicate population hitchhiking, a bottleneck or population expansion, the insignificant HRI values from the mismatch distribution analysis and Roger’s test of
FIGURE 2 | (A) Locations of Tridacna maxima populations sampled in the Red Sea. Pie charts represent the proportion of the haplogroups (see network) per site. Pie charts with black outline were from previous studies. For abbreviations of sample sites, see Table 1. (B) TCS network of 67 mitochondrial cytochrome (c) oxidase I haplotypes from 194 individuals. Each circle corresponds to one haplotype, the size of the circle is proportional to its frequency. Connecting lines between circles represent one mutational step and the hatches indicate additional mutational steps. The small black circles are missing intermediate haplotypes.
TABLE 2 | Sample sites, number of sequences (n), number of haplotypes (Nhp), haplotype diversity (h), nucleotide diversity (π), Tajima’s D, Fu’s Fs and Harpending’s raggedness index (HRI) for Tridacna maxima in the RSGA.
Sample site code Genetic diversity Neutrality tests Mismatch distribution (HRI)
n Nhp h π (%) Tajima’s D Fu’s Fs Eg 7 3 0.71 ± 0.13 2.71 ± 2.03 1.81NS 1.01NS 0.29NS Jd 17 11 0.94 ± 0.04 4.37 ± 2.70 −0.86NS −5.31** 0.05NS Db 27 16 0.89 ± 0.05 5.18 ± 3.04 −1.77* −8.58*** 0.05NS Wj 10 5 0.82 ± 0.10 2.95 ± 2.06 0.23NS −0.76NS 0.07NS Ul 6 3 0.73 ± 0.16 3.28 ± 2.43 0.97NS 1.08NS 0.67NS Yb 10 5 0.76 ± 0.13 3.52 ± 2.37 −0.47NS −0.39NS 0.05NS Rb 5 5 1.00 ± 0.13 4.84 ± 3.50 0.29NS −2.24* 0.22NS Th 26 11 0.83 ± 0.05 3.38 ± 2.15 −1.09NS −4.49** 0.04NS Al 27 15 0.91 ± 0.03 3.71 ± 2.31 −1.65* −9.59*** 0.04NS FbN 20 8 0.82 ± 0.06 3.69 ± 2.33 −0.63NS −1.70NS 0.03NS Hi 4 4 1.00 ± 0.18 6.47 ± 4.83 −0.82NS −0.82NS 1.00NS FbS 11 10 0.98 ± 0.05 4.66 ± 2.96 −0.63NS −6.97*** 0.07NS Fi 8 5 0.86 ± 0.11 3.69 ± 2.54 0.01NS −0.83NS 0.19NS Dj 16 7 0.69 ± 0.12 2.57 ± 1.77 −1.48NS −2.39* 0.14NS Overall 194 67 0.88 ± 0.02 3.72 ± 2.24 −2.38** −26.72*** 0.03NS
For abbreviations of sample sites, see Table 1. *0.05> p ≥ 0.01; **0.01 > p ≥ 0.001; ***p < 0.001; NS: not significant. sudden population expansion for all sampling sites (Table 2)
verify the historical expansion of the small giant clams in the Red Sea. In accordance with the network pattern (Figure 2), neutrality tests and the mismatch distribution of the haplotypes by haplogroups supported the expansion theories (negative Tajima’s D and Fu’s Fs, all p < 0.001 expect Haplogroup 2; non-significant HRI,p> 0.05) (see Table 3).
Genetic Population Structure and
Connectivity
Tridacna maxima in our study area exhibites high diversity with three major haplogroups, which differ from each other by one nucleotide substitution. Each haplogroup represents a typical star-like haplonet with numerous branches, and we named these haplogroups as H1, H2, and H3. The separation between haplogroups was found to be statistically supported for H3 and H2 (both PP ≥ 70%, see Hillis and Bull, 1993) while poorly resolved for H1 (PP = 55%) (Supplementary Figure S1). The proportions of novel haplotypes were evenly distributed among the major haplogroups (>50%) and the highest proportion of novel haplotypes was found in H2 (80%). H3 comprised the most widespread haplotypes in all sampling sites while H1 consisted of the haplotypes with the highest frequencies, present in all sampling sites except Duba.
The central haplotype from H1 was found among 23.7% of all individuals, followed by 22.7% of all individuals that were found in the common haplotype from H3. Both of these haplotypes were evenly distributed among three provinces in the Red Sea, indicate a high rate of gene flow within the Red Sea basin. The results of the AMOVA support the null hypothesis of no genetic structure among populations of T. maxima of the RSGA (φST = 0.02; p> 0.05). This was supported by the non-significant pairwise φST among all sampled locations, which indicated panmixia, except
for Djibouti (Table 4).T. maxima from Djibouti was significantly differentiated from most of the sampled locations in the Red Sea based on genetic evidence (pairwiseφSTvalues range from 0.03 to 0.27, allp< 0.05), apart from Yanbu and Hasr Island (φST= 0.03 and 0.05, respectively, bothp> 0.05).
DISCUSSION
Genetic Diversity
This is the first population genetic study ofT. maxima giant clams that covers the entire eastern Red Sea. The high genetic diversity (h ≥ 0.85, see Nuryanto and Kochzius, 2009) of T. maxima detected in the eastern RSGA is in agreement with other studies on giant clams in the same region using the mtCOI marker (Hui et al., 2016; Othmen et al., 2020). High haplotype diversity in the Gulf of Aqaba and the southern Red Sea populations can be invoked as evidence for persistence in glacial refugia, similar to findings for coral communities as suggested byCasazza (2017). In addition to refugial sites, genetic diversity can be increased in zones of admixture through the combination of variants derived from multiple refugia (Layton et al., 2015), thus explain the widespread distribution of haplotypes ofT. maxima in our study region. Nevertheless, low haplotype diversity was detected among the marginal populations in Egypt and the central Red Sea (see Table 2). Low genetic diversity in Egypt could be related to demographic factors at distribution margins causing a tendency for range edge populations to have lower genetic variability (e.g., Arnaud-Haond et al., 2006), but this edge-effect cannot explain the central Red Sea depleted sites (Pappas et al., 2017). Extensive coastal development can also explain low haplotype diversity in these areas. Dredging and filling activities have destroyed large tracts of coral reefs in the central Red Sea coast of Saudi Arabia and Egypt as reported by Pilcher and Alsuhaibany (2020). An
TABLE 3 | PairwiseφSTvalues between populations of Tridacna maxima in the RSGA, based on mitochondrial cytochrome c oxidase I sequences. Eg Jd Db Wj Ul Yb Rb Th Al FbN Hi FbS Fi Jd −0.03NS Db −0.01NS −0.01NS Wj 0.11NS 0.02NS −0.02NS Ul 0.09NS −0.01NS −0.06NS −0.11NS Yb 0.07NS 0.04NS −0.01NS 0.09NS 0.00NS Rb 0.12NS 0.05NS −0.02NS −0.07NS −0.13NS 0.03NS Th 0.05NS 0.02NS −0.02NS 0.01NS −0.04NS −0.02NS 0.00NS Al 0.03NS 0.01NS −0.01NS 0.02NS −0.03NS −0.00NS 0.04NS −0.02NS FbN 0.09NS 0.04NS −0.01NS −0.04NS −0.09NS 0.03NS −0.05NS −0.01NS 0.01NS Hi 0.07NS 0.06NS −0.01NS 0.13NS 0.03NS −0.06NS 0.02NS 0.02NS 0.04NS 0.08NS FbS 0.02NS 0.00NS −0.03NS −0.05NS −0.09NS 0.03NS −0.05NS −0.01NS 0.00NS −0.02NS 0.04NS Fi 0.11NS 0.02NS −0.02NS −0.09NS −0.12NS 0.05NS −0.09NS 0.00NS 0.01NS −0.05NS 0.08NS −0.05NS Dj 0.15* 0.11** 0.07* 0.27** 0.20* 0.03NS 0.25* 0.09* 0.07* 0.18** 0.05NS 0.17** 0.24**
Abbreviations for sample sites: see Table 1. *0.05> p ≥ 0.01; **0.01 > p ≥ 0.001; NS: not significant.
TABLE 4 | Diversity indices and results of demographic analyses used to test range expansion in Tridacna maxima for each haplogroup in the RSGA.
Haplogroup Diversity indices Demographic analyses
h ± SD π ± SD D Fs HRI
1 0.6871 ± 0.06 0.0194 ± 0.01 −2.6866*** −28.8147*** 0.0471NS
2 0.7667 ± 0.06 0.0211 ± 0.01 −1.9941NS −11.2889*** 0.0616NS
3 0.5667 ± 0.07 0.0136 ± 0.01 −2.4621*** −19.9254*** 0.0544NS
Haplotype (h) and nucleotide (π) diversity, Tajima’s D, Fu’s Fs and Harpending’s raggedness index (HRI) are shown. ***p < 0.001; NS: not significant. additional, not exclusive, driver of low haplotype diversity in
these areas could be sustained overharvesting. Giant clams in the Red Sea, have been heavily harvested for their meat and shells dating back to the early human occupation during the last interglacial (>125,000 years ago) (seeRichter et al., 2008), and the exploitation of giant clams was still ongoing in Egypt and Saudi Arabia in the past decades (seeBodoy, 1984andAshworth et al., 2004). As there were no data available on the exploitation of giant clams in the other locations in the central Red Sea, it is difficult to estimate the overall extent to which exploitation might be responsible for the low genetic diversity in a few locations along the eastern Red Sea.
Historical Demography
The TCS network did not reveal any particular geographical structure in the distribution ofT. maxima haplotypes throughout the study region. The “textbook-like” star shape of the haplogroups is congruent with a recent population expansion after which there has not been sufficient time for the evolution of divergent patterns. Since T. maxima is a highly dispersive species in the Red Sea, these haplogroup shapes could imply there was a strong bottleneck in the past that left a few haplotypes (i.e., the central haplotype of H1, H2, and H3) and the population recovered, allowing for small mutations to arise from these haplotypes producing the star-shaped haplotype network. This hypothesis was supported by the negative neutrality tests and insignificant HRI for each haplogroup (see Table 3). The indication of a sudden population expansion coupled
with a shallow population structure could be justified by the demographic history ofT. maxima. During the Pleistocene and the Holocene, the Red Sea experienced a limited gene exchange with the Indian Ocean through the Straits of Bab-el-Mandeb (Siddall et al., 2003), resulting in high levels of endemism among the reef taxa (DiBattista et al., 2016b). Nevertheless, this hypothesized impact of the quaternary period has been argued by a recent study (Fauvelot et al., 2020) suggesting thatT. maxima has more recently invaded the Red Sea from the Mozambique Channel. This hypothesis is supported by the discovery of a sister clade between the Red Sea and western Indian Ocean (WIO) populations (i.e., Juan de Nova, Tulear, Reunion Island, and Mauritius) (see Supplementary Figure S2), suggesting that Red Sea giant clams have recently diverged from WIO lineages through synergistic effects of historical and ecological factors (Fauvelot et al., 2020). Such genetic divergence could be explained by the habitat patchiness of T. maxima between the Gulf of Aden and Kenya (Obura, 2012), creating a restricted stepping-stone connectivity between the Red Sea and WIO and thereby increasing the chance for vicariant splits.
Genetic Population Structure and
Connectivity
Our study area features a strong salinity gradient, ranging from 41 in the North to PSU in the South, with an opposite maximum temperature gradient that ranges from 21 to 33.8◦
C in the same direction (Sofianos and Johns, 2007; Raitsos et al., 2013; Kürten et al., 2014;Chaidez et al., 2017). Despite large distances
between sampling sites, and the large temperature and salinity gradient, no significant population structure of T. maxima was found, suggesting that the temperature and salinity ranges are within the tolerance range, further supported by lack of observations of bleaching, for giant clams, therefore not affecting their connectivity in the Red Sea. Instead, our data suggests panmixia and considerable gene flow among regions. This finding contrasts with previous studies on marine fauna in general, where they found a genetic break around 19◦
N that differentiated the southern populations of Red Sea marine fauna from the rest of the basin along the East coast (>1500 km) of the Red Sea (Shefer et al., 2004;Froukh and Kochzius, 2007), a pattern absent in the giant clam populations. The absence of population differentiation over the northern, central and southern reefs in the eastern Red Sea, spanning an area of more than 2,000 km, indicates that the larvae ofT. maxima may disperse over long distances from their natal reef and successfully colonize new reefs.
Ocean current patterns play a critical role in the gene flow/larval dispersal routes within and among giant clam populations as reported in the Indo-Pacific (Benzie and Williams, 1992a; Macaranas et al., 1992; Giles et al., 2015; Raitsos et al., 2017). Currents can form physical barriers (Baums et al., 2005; Thornhill et al., 2008) or transport aquatic larvae (Pineda et al., 2007). A recent modeling study byRaitsos et al. (2017)further demonstrates that ocean circulation features present in the Red Sea, such as eddies and surface currents, provide effective physical pathways for gene flow and genetic connectivity. Permanent anticyclonic (i.e., clockwise) and cyclonic (i.e., counter-clockwise) eddies, prevalent in the Red Sea (Sofianos and Johns, 2007; Raitsos et al., 2013; Figure 2), can transport larvae and gametes (Lobel and Robinson, 1986;Sammarco and Andrews, 1989; Wolanski et al., 1989; Robitzch et al., 2015). The larvae of giant clams can be trapped in these dynamic mesoscale eddies and travel among distant reefs (>250 km away) in less than 2 weeks (Raitsos et al., 2017). Since giant clams have a short pelagic larval duration (about 9 days), hydrodynamic transport can provide dispersal scales of the order of 200 km, which can facilitate successful dispersal among reefs (Andréfouët et al., 2002), thereby maintaining genetic connectivity and achieving panmixia at decadal time scales, short enough to prevent differentiation. Nevertheless, our sampling sites were mostly located on the eastern coast of the Red Sea, and future studies should include samples from the West coast of the Red Sea to provide a more holistic overview on the population structure ofT. maxima in the Red Sea.
Information on the spawning frequency or natural spawning cues of T. maxima is important to understand the larval dispersal potential, and yet it is largely lacking. The natural spawning activity of giant clams in a semi-enclosed basin could be triggered by temperature changes corresponding to the periods of lagoon water renewal (Gilbert et al., 2006; van Wynsberge et al., 2017). During the summer months, the water in the southern Red Sea is refreshed by the intrusion of colder and nutrient-rich Gulf of Aden Intermediate Water (GAIW), which stretches nearly the entire length of the Red Sea (∼1500 km) (Bower and Abualnaja, 2012). GAIW, transported by mesoscale eddies and coastal currents (see Churchill et al.,
2014), could hypothetically provide a spawning cue ofT. maxima, but empirical data are lacking to assess this. Although no consensus has been reached on the spawning cues for giant clams, reproductive seasonality among the tridacnine species is likely to be latitude- and/or geographical-locality specific (Soo and Todd, 2014). In the Indo-Pacific, T. maxima are winter breeders (Yamaguchi, 1977), while the breeding season of T. maxima in the Red Sea is restricted to the warmer months (June–September) (Roa-Quiaoit, 2005; Richter et al., 2008). Roa-Quiaoit (2005) suggests that the spawning of giant clams in the Red Sea is primarily controlled by the seasonal changes in temperature and nutrients, which trigger the maturation of gametes in spring. Unfortunately, limited information available restrict the formulation of hypotheses linking spawning periods and larval dispersal ability of T. maxima in our study area.
Most populations ofT. maxima in the Red Sea are significantly genetically differentiated from Djibouti, except for two sites. Previous studies found that several species of fish show different genetic structure between populations in Djibouti and populations in the central or southern Red Sea while such genetic differentiation is absent in anemones (see Berumen et al., 2019 and references therein). Our results, although somewhat intermediate, are more similar to the patterns found for fish, suggesting the evolutionary history of RSGA fauna may be rather complicated and species-specific as suggested by DiBattista et al. (2013) and DiBattista et al. (2016a). Berumen et al. (2019) suggest that further work, comprising a variety of marine taxa and coupled with the next-generation sequencing (NGS) technologies may reveal the evolutionary histories of Red Sea fauna.
CONCLUSION
In conclusion, no significant population structure ofT. maxima was found along the eastern Red Sea, despite pronounced temperature and salinity gradients, suggesting panmixia and considerable gene flow among regions. However, significant genetic differentiation was identified between the Red Sea and the Gulf of Aden. The observed genetic homogeneity inside the Red Sea could be supported by efficient broad scale oceanographic transportation of larvae across the reefs that line the eastern Red Sea and/or a recent colonization with limited time for differentiation. The latter is supported by report of recent colonization of Red Sea T. maxima from the Mozambique channel (Fauvelot et al., 2020). Nevertheless, the genetic homogeneity found in the Red Sea provides a more parsimonious and sufficient explanation, supported by the growing body of literature indicating the importance of the oceanographic features in shaping the genetic structure of marine invertebrate populations. Widespread connectivity could be mainly attributed to the eddies and surface currents, followed by their mode of reproduction, spawning seasons and genotypic fitness to cope with extreme environmental conditions in the Red Sea. Despite the recent and growing interest in the population genetics of giant clam in the Red Sea, baseline information
on the reproduction and recruitment processes as well as the Symbiodinaceae community structure of this marine invertebrate are still lacking. Further studies of connectivity, for species across a broad range of life-history traits, would be important to inform conservation priorities from local to regional scales of the Red Sea ecosystems.
DATA AVAILABILITY STATEMENT
The datasets presented in this study can be found in online repositories. The names of the repository/repositories and accession number(s) can be found below: NCBI [accession: MT324264–MT324389 and MT321353–MT321479].
AUTHOR CONTRIBUTIONS
SR and SS-R conducted the sample collection. KL conducted the lab analyses, data analysis and wrote the manuscript. All authors conceived the study and contributed to improving the manuscript, read and approved the final manuscript.
FUNDING
This work was funded by King Abdullah University of Science and Technology (KAUST), through baseline funding to CD. (BAS/1/1071-01-01).
ACKNOWLEDGMENTS
We thank the KAUST BioScience Core Lab for sequence data generation. We thank Felix Ivo Rossbach for assistance during field work. We thank Dan Barshis for organizing the sampling in Djibouti, Moussa Omar Youssouf from the Centre d’Etude et de Recherche de Djibouti and all participants of the 2020 cruise. KL acknowledges support from the IMBRSea MSc program.
SUPPLEMENTARY MATERIAL
The Supplementary Material for this article can be found online at: https://www.frontiersin.org/articles/10.3389/fmars. 2020.570361/full#supplementary-material
REFERENCES
Abyzova, G. A., Nikitin, M. A., Popova, O. V., and Pasternak, A. F. (2018). Genetic population structure of the pelagic molluskLimacina helicina in the Kara Sea. PeerJ 6:e5709. doi: 10.7717/peerj.5709
Andréfouët, S., Mumby, P., McField, M., Hu, C., and Muller-Karger, F. (2002). Revisiting coral reef connectivity.Coral Reefs 21, 43–48. doi: 10.1007/s00338-001-0199-0
Arnaud-Haond, S., Teixeira, S., Massa, S. I., Billot, C., Saenger, P., Coupland, G., et al. (2006). Genetic structure at range edge: low diversity and high inbreeding in Southeast Asian mangrove (Avicennia marina) populations. Mol. Ecol. 15, 3515–3525. doi: 10.1111/j.1365-294X.2006.02997.x
Ashworth, J. S., Ormond, R. F. G., and Sturrock, H. T. (2004). Effects of reef-top gathering and fishing on invertebrate abundance across take and no-take zones. J. Exper. Mar. Biol. Ecol. 303, 221–242. doi: 10.1016/j.jembe.2003.11.017 Badr, N. B., El-Fiky, A. A., Mostafa, A. R., and Al-Mur, B. A. (2009). Metal
pollution records in core sediments of some Red Sea coastal areas, Kingdom of Saudi Arabia.Environ. Monit. Assess. 155, 509–526. doi: 10.1007/s10661-008-0452-x
Bargelloni, L., Alarcon, J. A., Alvarez, M. C., Penzo, E., Magoulas, A., Palma, J., et al. (2005). The Atlantic-Mediterranean transition: discordant genetic patterns in two seabream species, Diplodus puntazzo (Cetti) and Diplodus sargus (L.). Mol. Phylogenet. Evol. 36, 523–535. doi: 10.1016/j.ympev.2005. 04.017
Bargelloni, L., Alarcon, J. A., Alvarez, M. C., Penzo, E., Magoulas, A., Reis, C., et al. (2003). Discord in the family Sparidae (Teleostei): divergent phylogeographical patterns across the Atlantic-Mediterranean divide.J. Evol. Biol. 16, 1149–1158. doi: 10.1046/j.1420-9101.2003.00620.x
Baums, I. B., Miller, M. W., and Hellberg, M. E. (2005). Regionally isolated populations of an imperiled Caribbean coral,Acropora palmata. Mol. Ecol. 14, 1377–1390. doi: 10.1111/j.1365-294X.2005.02489.x
Benzie, J. A. H., and Williams, S. T. (1992a). Genetic structure of giant clam (Tridacna maxima) populations from reefs in the Western Coral Sea. Coral Reefs 11, 135–141. doi: 10.1007/Bf00255467
Benzie, J. A. H., and Williams, S. T. (1992b). No genetic differentiation of giant clam (Tridacna gigas) populations in the Great Barrier Reef, Australia. Mar. Biol. 113, 373–377. doi: 10.1007/Bf00349161
Berumen, M. L., Hoey, A. S., Bass, W. H., Bouwmeester, J., Catania, D., Cochran, J. E. M., et al. (2013). The status of coral reef ecology research in the Red Sea. Coral Reefs 32, 737–748. doi: 10.1007/s00338-013-1055-8
Berumen, M. L., Roberts, M. B., Sinclair-Taylor, T. H., DiBattista, J. D., Saenz-Agudelo, P., Isari, S., et al. (2019). “Fishes and connectivity of Red Sea Coral Reefs,” inCoral Reefs of the Red Sea, eds C. Voolstra and M. Berumen (Cham: Springer), 157–179. doi: 10.1007/978-3-030-05802-9_8
Bodoy, A. (1984). Assessment of human impact on giant clams,Paper Presented at the Proceedings of the Symposium on Coral Reef Environment of the Red Sea, Jeddah.
Bower, A., and Abualnaja, Y. (2012). New observations of the gulf of aden intermediate water intrusion into the Red Sea,Paper Presented at the EGU General Assembly Conference Abstracts, New York, NY.
Casazza, L. R. (2017). Pleistocene reefs of the Egyptian Red Sea: environmental change and community persistence. PeerJ 5:e3504. doi: 10.7717/peerj. 3504
Chaidez, V., Dreano, D., Agusti, S., Duarte, C. M., and Hoteit, I. (2017). Decadal trends in Red Sea maximum surface temperature.Sci. Rep. 7:8144. doi: 10.1038/ s41598-017-08146-z
Chambers, C. N. L. (2007).Pasua (Tridacna maxima) size and abundance in Tongareva Lagoon, Cook Islands.SPC Trochus Inform. Bull. 13, 7–12. Charrier, G., Chenel, T., Durand, J. D., Girard, M., Quiniou, L., and Laroche,
J. (2006). Discrepancies in phylogeographical patterns of two European anglerfishes (Lophius budegassa and Lophius piscatorius). Mol. Phylogenet. Evol. 38, 742–754. doi: 10.1016/j.ympev.2005.08.002
Churchill, J. H., Bower, A. S., McCorkle, D. C., and Abualnaja, Y. (2014). The transport of nutrient-rich Indian Ocean water through the Red Sea and into coastal reef systems. J. Mar. Res. 72, 165–181. doi: 10.1357/ 002224014814901994
Clement, M., Snell, Q., and Walker, P. (2002). “TCS: estimating gene genealogies,” in Proceedings 16th International Paraller and Distirbuted Processing Symposium, Fort Lauderdale, FL.
Cowen, R. K., Gawarkiewic, G., Pineda, J., Thorrold, S. R., and Werner, F. E. (2007). Population connectivity in marine systems an overview.Oceanography 20, 14–21. doi: 10.5670/oceanog.2007.26
DeBoer, T. S., Subia, M. D., Ambariyanto, Erdmann, M. V., Kovitvongsa, K., and Barber, P. H. (2008). Phylogeography and limited genetic connectivity in the endangered boring giant clam across the Coral Triangle.Conserv. Biol. 22, 1255–1266. doi: 10.1111/j.1523-1739.2008.00983.x
DiBattista, J. D., Berumen, M. L., Gaither, M. R., Rocha, L. A., Eble, J. A., Choat, J. H., et al. (2013). After continents divide: comparative phylogeography of reef fishes from the Red Sea and Indian Ocean.J. Biogeogr. 40, 1170–1181. doi: 10.1111/jbi.12068
DiBattista, J. D., Choat, J. H., Gaither, M. R., Hobbs, J. P. A., Lozano-Cortes, D. F., Myers, R. F., et al. (2016a). On the origin of endemic species in the Red Sea. J. Biogeogr. 43, 13–30. doi: 10.1111/jbi.12631
DiBattista, J. D., Roberts, M. B., Bouwmeester, J., Bowen, B. W., Coker, D. J., Lozano-Cortes, D. F., et al. (2016b). A review of contemporary patterns of endemism for shallow water reef fauna in the Red Sea.J. Biogeogr. 43, 423–439. doi: 10.1111/jbi.12649
Dupont, L., Ellien, C., and Viard, F. (2007). Limits to gene flow in the slipper limpet Crepidula fornicata as revealed by microsatellite data and a larval dispersal model.Mar. Ecol. Prog. Ser. 349, 125–138. doi: 10.3354/meps07098
Excoffier, L., and Lischer, H. E. L. (2010). Arlequin suite ver 3.5: a new series of programs to perform population genetics analyses under Linux and Windows. Mol. Ecol. Resour. 10, 564–567. doi: 10.1111/j.1755-0998.2010.02847.x Excoffier, L., Smouse, P. E., and Quattro, J. M. (1992). Analysis of molecular
variance inferred from metric distances among DNA haplotypes: application to human mitochondrial DNA restriction data.Genetics 131, 479–491. Fauvelot, C., Zuccon, D., Borsa, P., Grulois, D., Magalon, H., Riquet, F.,
et al. (2020). Phylogeographical patterns and a cryptic species provide new insights into Western Indian Ocean giant clams phylogenetic relationships and colonization history.J. Biogeogr. 47, 1086–1105. doi: 10.1111/jbi.13797 Froukh, T., and Kochzius, M. (2007). Genetic population structure of the endemic
fourline wrasse (Larabicus quadrilineatus) suggests limited larval dispersal distances in the Red Sea.Mol. Ecol. 16, 1359–1367. doi: 10.1111/j.1365-294X. 2007.03236.x
Fu, Y. X. (1997). Statistical tests of neutrality of mutations against population growth, hitchhiking and background selection.Genetics 147, 915–925. Furby, K. A., Bouwmeester, J., and Berumen, M. L. (2013). Susceptibility of central
Red Sea corals during a major bleaching event.Coral Reefs 32, 505–513. doi: 10.1007/s00338-012-0998-5
Gilbert, A., Andrefouet, S., Yan, L., and Remoissenet, G. (2006). The giant clam Tridacna maxima communities of three French Polynesia islands: comparison of their population sizes and structures at early stages of their exploitation.ICES J. Mar. Sci. 63, 1573–1589. doi: 10.1016/j.icesjms.2006.07.001
Giles, E. C., Saenz-Agudelo, P., Hussey, N. E., Ravasi, T., and Berumen, M. L. (2015). Exploring seascape genetics and kinship in the reef sponge Stylissa carteri in the Red Sea. Ecol. Evol. 5, 2487–2502. doi: 10.1002/ece3.1511 Gladstone, W., Curley, B., and Shokri, M. R. (2013). Environmental impacts of
tourism in the Gulf and the Red Sea.Mar. Pollut. Bull. 72, 375–388. doi: 10.1016/j.marpolbul.2012.09.017
Hasan, M. H. (2005). Destruction of aHolothuria scabra population by overfishing at Abu Rhamada Island in the Red Sea.Mar. Environ. Res. 60, 489–511. doi: 10.1016/j.marenvres.2004.12.007
Hillis, D. M., and Bull, J. J. (1993). An empirical-test of bootstrapping as a method for assessing confidence in phylogenetic analysis.Syst. Biol. 42, 182–192. doi: 10.2307/2992540
Huber, M., and Eschner, A. (2011).Tridacna (Chametrachea) costata Roa-Quiaoit, Kochzius, Jantzen, Al-Zibdah & Richter from the Red Sea, a junior synonym of Tridacna squamosina Sturany, 1899. Ann. Naturhistorischen Museums Wien B 112, 153–162.
Hui, M., Kraemer, W. E., Seidel, C., Nuryanto, A., Joshi, A., and Kochzius, M. (2016). Comparative genetic population structure of three endangered giant clams (Cardiidae:Tridacna species) throughout the Indo-West Pacific: implications for divergence, connectivity and conservation.J. Molluscan Stud. 82, 403–414. doi: 10.1093/mollus/eyw001
Junchompoo, C., Sinrapasan, N., Penpain, C., and Patsorn, P. (2012). “Changing seawater temperature effects on giant clams bleaching Mannai Island Rayong province Thailand,” inProceedings of the Design Symposium on Conservation of Ecosystem (The 12th SEASTAR2000 Workshop), Bangkok.
Kemp, J. (2000). Zoogeography of the coral reef fishes of the north-eastern Gulf of Aden, with eight new records of reef fishes from Arabia.Fauna Arabia 18, 293–321.
Kenchington, E. L., Patwary, M. U., Zouros, E., and Bird, C. J. (2006). Genetic differentiation in relation to marine landscape in a broadcast-spawning bivalve mollusc (Placopecten magellanicus). Mol. Ecol. 15, 1781–1796. doi: 10.1111/j. 1365-294X.2006.02915.x
Kilada, R., Zakaria, S., and Farghalli, M. E. (1998). Distribution and abundance of the giant clamTridacna maxima (Bivalvia: Tridacnidae) in the northern Red Sea.Bull. Natl. Instit. Oceanogr. Fish. 24, 221–240.
Kochzius, M., and Nuryanto, A. (2008). Strong genetic population structure in the boring giant clam,Tridacna crocea, across the Indo-Malay Archipelago: implications related to evolutionary processes and connectivity.Mol. Ecol. 17, 3775–3787. doi: 10.1111/j.1365-294X.2008.03803.x
Kool, J. T., Moilanen, A., and Treml, E. A. (2013). Population connectivity: recent advances and new perspectives.Landsc. Ecol. 28, 165–185. doi: 10.1007/s10980-012-9819-z
Kumar, S., Stecher, G., and Tamura, K. (2016). MEGA7: molecular evolutionary genetics analysis version 7.0 for bigger datasets.Mol. Biol. Evol. 33, 1870–1874. doi: 10.1093/molbev/msw054
Kürten, B., Al-Aidaroos, A. M., Struck, U., Khomayis, H. S., Gharbawi, W. Y., and Sommer, U. (2014). Influence of environmental gradients on C and N stable isotope ratios in coral reef biota of the Red Sea, Saudi Arabia.J. Sea Res. 85, 379–394. doi: 10.1016/j.seares.2013.07.008
Layton, K. K. S., Martel, A. L., and Hebert, P. D. N. (2015). Geographic patterns of genetic diversity in two species complexes of Canadian marine bivalves. J. Molluscan Stud. 82, 282–291. doi: 10.1093/mollus/eyv056
Librado, P., and Rozas, J. (2009). DnaSP v5: a software for comprehensive analysis of DNA polymorphism data. Bioinformatics 25, 1451–1452. doi: 10.1093/ bioinformatics/btp187
Lobel, P. S., and Robinson, A. R. (1986). Transport and entrapment of fish larvae by ocean mesoscale eddies and currents in Hawaiian waters.Deep Sea Res. Part A Oceanogr. Res. Pap. 33, 483–500. doi: 10.1016/0198-0149(86)90127-5 Macaranas, J. M., Ablan, C. A., Pante, M. J. R., Benzie, J. A. H., and Williams,
S. T. (1992). Genetic structure of giant clam (Tridacna derasa) populations from reefs in the Indo-Pacific.Mar. Biol. 113, 231–238.
Mekawy, M. S., and Madkour, H. A. (2012). Studies on the Indo-Pacific tridacnidae (Tridacna maxima) from the Northern Red Sea, Egypt. Intern. J. Geosci. 3, 1089–1095. doi: 10.4236/ijg.2012.35110
Mohamed, N. M., Hill, R. T., Raouf, W. K., Khalifa, S. I., and Abou-El-Ela, S. H. (2006). Molecular genetic analysis of giant clam (Tridacna sp.) populations in the northern Red Sea.Asain J. Biochem. 1, 338–342. doi: 10.3923/ajb.2006. 338.342
Monroe, A. A., Ziegler, M., Roik, A., Rothig, T., Hardenstine, R. S., Emms, M. A., et al. (2018).In situ observations of coral bleaching in the central Saudi Arabian Red Sea during the 2015/2016 global coral bleaching event.PLoS One 13:e0195814. doi: 10.1371/journal.pone.0195814
Nei, M. (1987). Molecular Evolutionary Genetics. New York, NY: Columbia University Press.
Nei, M., and Jin, L. (1989). Variances of the average numbers of nucleotide substitutions within and between populations.Mol. Biol. Evol. 6, 290–300. doi: 10.1093/oxfordjournals.molbev.a040547
Neo, M. L., Eckman, W., Vicentuan, K., Teo, S. L. M., and Todd, P. A. (2015). The ecological significance of giant clams in coral reef ecosystems.Biol. Conserv. 181, 111–123. doi: 10.1016/j.biocon.2014.11.004
Neo, M. L., and Todd, P. A. (2012). Population density and genetic structure of the giant clamsTridacna crocea and T. squamosa on Singapore’s reefs. Aquat. Biol. 14, 265–275. doi: 10.3354/ab00400
Nuryanto, A., and Kochzius, M. (2009). Highly restricted gene flow and deep evolutionary lineages in the giant clam Tridacna maxima.Coral Reefs 28, 607–619. doi: 10.1007/s00338-009-0483-y
Obura, D. (2012). The diversity and biogeography of Western Indian Ocean reef-building corals.PLoS One 7:e45013. doi: 10.1371/journal.pone.0045013 Othmen, B. A., Abhary, M., Deli, T., Ouanes, Z., Alhuwaiti, N., Dimassi, N., et al.
(2020). Lack of mitochondrial genetic structure in the endangered giant clam populations ofTridacna maxima (Bivalvia: Cardiidae: Tridacninae) across the Saudi Arabian coast.Acta Oceanol. Sin. 39, 28–37. doi: 10.1007/s13131-020-1547-7
Pappas, M. K., He, S., Hardenstine, R. S., Kanee, H., and Berumen, M. L. (2017). Genetic diversity of giant clams (Tridacna spp.) and their associated Symbiodinium in the central Red Sea.Mar. Biodiver. 47, 1209–1222. doi: 10. 1007/s12526-017-0715-2
Pilcher, N., and Alsuhaibany, A. (eds) (2020).Regional Status of Coral Reefs in the Red Sea(and)the Gulf of Aden - Middle East - 2000. Crawley WA: Australian Institute of Marine Science.
Pineda, J., Hare, J. A., and Sponaugle, S. (2007). Larval transport and dispersal in the coastal ocean and consequences for population connectivity.Oceanography 20, 22–39. doi: 10.5670/oceanog.2007.27
Raitsos, D. E., Brewin, R. J. W., Zhan, P., Dreano, D., Pradhan, Y., Nanninga, G. B., et al. (2017). Sensing coral reef connectivity pathways from space.Sci. Rep. 7:9338. doi: 10.1038/s41598-017-08729-w
Raitsos, D. E., Pradhan, Y., Brewin, R. J. W., Stenchikov, G., and Hoteit, I. (2013). Remote sensing the phytoplankton seasonal succession of the Red Sea.PLoS One 8:e64909. doi: 10.1371/journal.pone.0064909
Richter, C., Roa-Quiaoit, H., Jantzen, C., Al-Zibdah, M., and Kochzius, M. (2008). Collapse of a new living species of giant clam in the Red Sea.Curr. Biol. 18, 1349–1354. doi: 10.1016/j.cub.2008.07.060
Roa-Quiaoit, H. (2005).Ecology and Culture of Giant Clams (Tridacnidae) in the Jordanian Sector of the Gulf of Aqaba, Red Sea. Available online at: http:// elib.suub.uni-bremen.de/diss/docs/E-Diss1340_PHDROAQ.pdf (accessed on March 8, 2020).
Robitzch, V., Banguera-Hinestroza, E., Sewall, Y., Al-Sofyani, A., and Voolstra, C. R. (2015). Absence of genetic differentiation in the coralPocillopora verrucosa along environmental gradients of the Saudi Arabian Red Sea.Front. Mar. Sci. 2:5. doi: 10.3389/fmars.2015.00005
Rogers, A. R. (1995). Genetic evidence for a pleistocene population explosion. Evolution 49, 608–615. doi: 10.1111/j.1558-5646.1995.tb02297.x
Rogers, A. R., and Harpending, H. (1992). Population growth makes waves in the distribution of pairwise genetic differences.Mol. Biol. Evol. 9, 552–569. doi: 10.1093/oxfordjournals.molbev.a040727
Rossbach, S., Saderne, V., Anton, A., and Duarte, C. M. (2019). Light-dependent calcification in Red Sea giant clam Tridacna maxima.Biogeosciences 16, 2635– 2650. doi: 10.5194/bg-16-2635-2019
Sammarco, P. W., and Andrews, J. C. (1989). The Helix experiment - differential localized dispersal and recruitment patterns in Great Barrier Reef corals. Limnol. Oceanogr. 34, 896–912. doi: 10.4319/lo.1989.34.5.0896
Schneider, J. A., and Ó Foighil, D. (1999). Phylogeny of giant clams (Cardiidae: Tridacninae) based on partial mitochondrial 16S rDNA gene sequences.Mol. Phylogenet. Evol. 13, 59–66. doi: 10.1006/mpev.1999.0636
Shaked, Y., and Genin, A. (2011). “Red Sea and Gulf of Aqaba,” inEncyclopedia of Modern Coral Reefs: Structure Form and Process, ed. D. Hopley (Dordrecht: Springer), 839–843.
Shefer, S., Abelson, A., Mokady, O., and Geffen, E. (2004). Red to Mediterranean Sea bioinvasion: natural drift through the Suez Canal, or anthropogenic transport?Mol. Ecol. 13, 2333–2343. doi: 10.1111/j.1365-294X.2004.02227.x Siddall, M., Rohling, E. J., Almogi-Labin, A., Hemleben, C., Meischner, D.,
Schmelzer, I., et al. (2003). Sea-level fluctuations during the last glacial cycle. Nature 423, 853–858. doi: 10.1038/nature01690
Sofianos, S. S., and Johns, W. E. (2007). Observations of the summer Red Sea circulation.J. Geophys. Res. 112, 1–20. doi: 10.1029/2006JC003886
Soo, P., and Todd, P. A. (2014). The behaviour of giant clams (Bivalvia: Cardiidae: Tridacninae).Mar. Biol. 161, 2699–2717. doi: 10.1007/s00227-014-2545-0 Spaet, J. L. Y., and Berumen, M. L. (2015). Fish market surveys indicate
unsustainable elasmobranch fisheries in the Saudi Arabian Red Sea.Fish. Res. 161, 356–364. doi: 10.1016/j.fishres.2014.08.022
Tajima, F. (1989). Statistical method for testing the neutral mutation hypothesis by DNA polymorphism.Genetics 123, 585–595.
Tamura, K. (1992). Estimation of the number of nucleotide substitutions when there are strong transition-transversion and G+C-content biases.Mol. Biol. Evol. 9, 678–687. doi: 10.1093/oxfordjournals.molbev.a040752
Taylor, D. L. (1969). Identity of zooxanthellae isolated from some Pacific tridacnidae.J. Phycol. 5:336. doi: 10.1111/j.1529-8817.1969.tb02623.x Templeton, A. R., Crandall, K. A., and Sing, C. F. (1992). A cladistic-analysis of
phenotypic associations with haplotypes inferred from restriction endonuclease mapping and DNA-sequence data. III . cladogram estimation.Genetics 132, 619–633.
Thornhill, D. J., Mahon, A. R., Norenburg, J. L., and Halanych, K. M. (2008). Open-ocean barriers to dispersal: a test case with the Antarctic Polar Front and the ribbon wormParborlasia corrugatus (Nemertea: Lineidae). Mol. Ecol. 17, 5104–5117. doi: 10.1111/j.1365-294X.2008.03970.x
van Wynsberge, S., Andrefouet, S., Gaertner-Mazouni, N., Wabnitz, C. C., Menoud, M., Le Moullac, G., et al. (2017). Growth, survival and reproduction of the giant clamTridacna maxima (Roding 1798, Bivalvia) in two contrasting lagoons in French Polynesia.PLoS One 12:e0170565. doi: 10.1371/journal.pone. 0170565
van Wynsberge, S., Andrefouet, S., Gaertner-Mazouni, N., Wabnitz, C. C. C., Gilbert, A., Remoissenet, G., et al. (2016). Drivers of density for the exploited giant clamTridacna maxima: a meta-analysis. Fish Fish. 17, 567–584. doi: 10.1111/faf.12127
Wabnitz, C., Taylor, M., Green, E., and Razak, T. (2003).From Ocean to Aquarium. Cambridge: UNEP-WCMC.
Wesselmann, M., Gonzalez-Wanguemert, M., Serrao, E. A., Engelen, A. H., Renault, L., Garcia-March, J. R., et al. (2018). Genetic and oceanographic tools reveal high population connectivity and diversity in the endangered pen shell Pinna nobilis. Sci. Rep. 8:4770. doi: 10.1038/s41598-018-23 004-2
Wolanski, E., Burrage, D., and King, B. (1989). Trapping and dispersion of coral eggs around Bowden Reef, Great Barrier Reef, following mass coral spawning.Contin. Shelf Res. 9, 479–496. doi: 10.1016/0278-4343(89)90 011-3
Yamaguchi, M. (1977). Conservation and cultivation of giant clams in the tropical Pacific.Biol. Conserv. 11, 13–20. doi: 10.1016/0006-3207(77)90022-2 Yonge, C. M. (1975). Giant clams. Sci. Am. 232, 96–105. doi: 10.1038/
scientificamerican0475-96
Conflict of Interest:The authors declare that the research was conducted in the absence of any commercial or financial relationships that could be construed as a potential conflict of interest.
Copyright © 2020 Lim, Rossbach, Geraldi, Schmidt-Roach, Serrão and Duarte. This is an open-access article distributed under the terms of the Creative Commons Attribution License (CC BY). The use, distribution or reproduction in other forums is permitted, provided the original author(s) and the copyright owner(s) are credited and that the original publication in this journal is cited, in accordance with accepted academic practice. No use, distribution or reproduction is permitted which does not comply with these terms.