Effect of copper exposure on growth, condition indices
and biomarker response in juvenile sole
Solea senegalensis
Vanessa Fonseca 1, Ângela seraFim 2, rui company 2,
maria João BeBianno 2 and Henrique caBral 1,3
1 instituto de oceanografia, Faculdade de ciências, universidade de lisboa, campo grande, 1749-016 lisboa, portugal.
e-mail: [email protected]
2 cima, Faculdade de ciências do mar e do ambiente, universidade do algarve, campus de gambelas, 8005-139 Faro,
portugal.
3 Departamento de Biologia animal, Faculdade de ciências, universidade de lisboa, campo grande, 1749-016 lisboa,
portugal.
summary: Juvenile Solea senegalensis were exposed to different concentrations of waterborne copper (cu) for 15 days in static conditions with continuous aerated artificial salt water at 20ºc (± 0.8ºc) with a normal photoperiod (10 h/14 h light/dark) and daily feeding. several measures of exposure and effects were determined: 1) biomarkers - metallothioneins and lipid peroxidation level; 2) mass indices - growth rate and morphometric condition indices; and 3) biochemical condi-tion indices - rna:Dna ratio and lipid and protein content in fish tissues. copper exposure triggered the response of the biomarkers and resulted in reduced growth and condition (rna:Dna and lipid content), but the morphometric indices did not vary. The physiological costs of cu contamination on condition suggested that lipid reserves were allocated as an energy source to enable exposed fish to respond to cu toxicity as well as to maintain positive growth rates and protein synthesis throughout the experiment, although with lower growth rates than the control fish. This study showed the importance of selecting suitable biomarkers according to contaminant source, fish species and their life-history stage. in addition, the use of several biomarkers of exposure, growth and specific condition indices can improve fish health determination and should be considered in evaluations of the effects of environmental contaminants on fish.
Keywords: fish growth, fish condition, metallothioneins, lipid peroxidation, juvenile sole, biomarkers.
resumen: Efecto de la exposición al cobre sobre el crecimiento, índices de condición y respuesta en
bio-marcadores en juveniles de lenguado SoleaSenegalenSiS. – se expusieron juveniles de Solea senegalensis a diferentes
concentraciones de cobre (cu) en el agua durante 15 días en condiciones estáticas, con agua salada artificial continuamente aireada, a 20ºc (± 0.8ºc), fotoperiodo normal (10 h/14 h luz/oscuridad) y alimentación diaria. se determinaron varias medi-das de exposición y sus efectos: 1) biomarcadores - metalotioneínas y nivel de peroxidación de lípidos; 2) índices de masa – tasa de crecimiento e índices de condición morfométricos; y 3) índices de condición bioquímicos - rna:Dna y contenido en lípidos y proteínas en tejidos de peces. la exposición al cobre disparó la respuesta de los biomarcadores y resultó en una reducción del crecimiento y condición (rna:Dna y contenido lipídico), en cambio los índices morfométricos no variaron. el coste fisiológico de la contaminación por cu en la condición sugiere que las reservas lipídicas se destinaron como fuente de energía para conseguir que los peces expuestos respondieran a la toxicidad del cu así como a mantener tasas de crecimien-to positivas y síntesis proteica a lo largo del experimencrecimien-to, aunque con menores tasas de crecimiencrecimien-to que los peces control. este estudio evidencia la importancia de seleccionar adecuadamente los biomarcadores de acuerdo con la fuente de conta-minación, la especies y su estadio de desarrollo. además la utilización de varios biomarcadores de exposición, crecimiento e índices de condición específicos puede mejorar la determinación del estado de salud de los peces y debería ser considerado al evaluar los efectos de contaminantes ambientales en peces.
Palabras clave: crecimiento en peces, condición en peces, metalotioneínas, peroxidación lipídica, lenguados juveniles, bio-marcadores.
march 2009, 51-58, Barcelona (spain) issn: 0214-8358 doi: 10.3989/scimar.2009.73n1051
inTroDucTion
aquatic ecosystems are increasingly threatened by the presence of organic and inorganic anthropo-genic pollutants (Daskalakis and o’connor, 1995). Fish behaviour and physiological responses to spe-cific and multiple stressors have been extensively used to determine individual health and population status, and to assess habitat quality (e.g. lloret and planes, 2003; marchand et al., 2003; Fonseca et al., 2006). Few studies have integrated indicators of ex-posure to contamination and effects on fish’s health and condition, and most have reported unclear or limited responses of individual growth and condi-tion to contaminant exposure (De Boeck et al., 1997; Wu et al., 2002; Humphrey et al., 2007). However, recent work has outlined the importance of applying a multibiomarker approach to assess the causes and effects of stressors on marine systems (e.g. adams, 2005; Broeg and lehtonen, 2006).
Biomarkers are considered, in a broad sense, as measurements of changes in biological responses linked to a potential hazard, which may be chemical, physical or biological (van der oost et al., 2003). When assessing the adverse effects of environmental contamination, exposure biomarkers are commonly used as early signs or functional measures of toxicity of specific contaminants or suites of contaminants (shugart et al., 1992; adams, 2002). However, a direct relationship between biomarkers’ response to pollutants and further ecological consequences at the individual or higher level is difficult to establish, and still needs further integration of both individual adaptability and the influence of natural attributes (van der oost et al., 2003).
Trace metals are widespread pollutants in es-tuaries and coastal areas. common biomarkers of exposure induced by trace metal toxicity are metal-lothioneins (mT), thiol-rich proteins that bind to the toxic metals and enable their excretion (roesijadi, 1996), as well as antioxidant enzymes (e.g. super-oxide dismutase [soD], catalase [caT]). These de-fence mechanisms have energetic and physiological costs for the individual and often result in trade-offs with other biological processes, namely reproduc-tion and growth (eastwood and couture, 2002; marchand et al., 2004). Fish growth and condition are linked to the ecological status of the environment (Beyers et al., 1999; Buckley et al., 1999), yet they may vary with non-pollutant stresses, masking the effects of pollution on the ecosystem, which
empha-sises the importance of experimental investigation and background information. it is also imperative to understand how the biochemical mechanisms that induce the biomarkers’ responses influence in-dividual growth and condition. a wider ecological scope of the stressors’ cost to the individual may be attained by the simultaneous determination of sev-eral biological endpoints that correspond to different response levels (Den Besten, 1998; adams, 2002), from the molecular to the whole individual level.
in the present study, juvenile senegalese sole,
Solea senegalensis Kaup, 1858, were exposed to naturally occurring copper (cu) concentrations ob-served in portuguese estuaries. This essential trace metal (toxic at higher concentrations) is very com-mon in estuaries and coastal waters, and several studies have demonstrated its deleterious effects on growth rates, condition and ion balance of different fish species (marr et al., 1996; De Boeck et al., 1997; Blanchard and grosell, 2006). Thus, cu was selected as an example of trace-metal toxicity in fish, and the different biomarkers determined were chosen based on: (1) their sensitivity to cu exposure (biomarkers of exposure – levels of mT and lipid peroxidation); (2) the information on general condition and growth (morphometric indices and growth rates); (3) the information on physiological condition related to growth and to the energy pathways for juvenile fish. The aims of this study were to determine how sub-lethal copper exposure simultaneously influences growth, condition indices and biomarker response in juvenile sole, and to determine the usefulness of these indicators for future habitat quality assessment studies.
maTerial anD meTHoDs
Experimental procedures
cultured juvenile Solea senegalensis (2.3-6.7 g ± 0.01 g wet weight, 5.7-8.0 cm ± 0.1 cm total length) from the same spawning batch were exposed to three sublethal copper treatments at the concentrations of 5, 25 and 100 μg cu l-1,plus a clean water control group, over a 15-day experiment period. The lower copper concentration was chosen based on naturally occurring values determined by water quality control measurements in portuguese estuaries (source inag - national Water institute, 2005) and also reported for other european estuaries (Hall and anderson,
1999). The other two copper concentrations were chosen in order to simulate episodic contamination events. a total of 51 fish were analysed, 3 at the be-ginning of the experiment and 48 fish divided into four groups of 12 individuals and subjected to the cu treatments, plus the control trial. Two separate 14 l tanks were used per treatment, each containing 6 fish individually tagged, measured and weighed at the beginning of the experiment, following a two-week acclimation period. During the acclimation and the experimental period fish were fed with a very common natural prey, the polychaete Hedistes
diversicolor. The experiment was carried out in static exposure conditions, with continuous aerated artifi-cial salt water at 20ºc (± 0.8ºc), normal photoperiod (10 h/14 h light/dark) and daily feeding. salt water (18 g l-1) was prepared with tap water (7.3 ± 0.5 pH) and artificial salt (instant ocean) throughout the 15-day trial and for the two-week acclimation period, to ensure daily water renewal. copper exposure was carried out by the dilution in distilled water of cop-per sulphate hydrate (sigma) and cu concentrations were monitored during the experimental period by atomic absorption spectrophotometry. Fish were col-lected on days 3, 5, 10 and 15 (3 fish per treatment per day) and were immediately sacrificed with a cut on the anterior spine. Fish length and body and liver weight were determined. Dissected liver and muscle samples were initially frozen in liquid nitrogen, and then stored at - 80ºc for subsequent analysis.
Analytical procedures for determining growth, condition indices and biomarker response
instantaneous growth rates (g) were determined as g = (ln W2 – ln W1)/(t2 – t1), where W1 and W2 are fish total body weight at times t1 (beginning of the experiment) and t2 (time of collection).
The morphometric condition indices determined for juvenile sole were the condition factor, K = W/ l3, where W is the wet weight (in grams) and l is the total length (in centimetres) (ricker, 1975), and the hepatosomatic index, Hsi = Wliver / W, where Wliver is the liver weight.
Biochemical condition indices, namely rna: Dna ratio and protein and lipid content, were de-termined in duplicate for individual muscle sam-ples. rna, Dna and protein measurements were determined from two replicates of ca. 150 mg wet weight each from the anterior-dorsal portion of the muscle, whereas the remainder of the muscle was
used to determine lipid content (average 400 mg wet weight). nucleic acid quantification was carried out by the fluorometric method described in caldarone
et al. (2001), adapted to a cuvette assay (Fonseca et
al., 2006). muscle samples were homogenised in n-lauroylsarcosine Tris-eDTa buffer (0.1%, pH 7.5), centrifuged, and aliquots of the supernatant were used for the quantification of rna and Dna fluores-cence with ethidium bromide (emission wavelength 590 nm, excitation wavelength 360 nm). rna fluo-rescence was determined as the difference between total nucleic acid fluorescence and Dna fluores-cence following treatment with rnase a (sigma). standard curves were previously determined using pure calf-thymus Dna (calbiochem) and 18s- and 28s-rrna (sigma), and the ratio between the two slopes from each standard curve was 4.04.
protein content determination was based on the lowry procedure (lowry et al., 1951). aliquots of the samples’ supernatant used for rna:Dna quan-tification reacted with Folin’s and copper reagent, and the complex’s absorbance was read at 750 nm and compared with a standard curve previously constructed with a dilution series of bovine serum albumin (calbiochem).
lipid muscle content was determined with an adaptation of the sulphophosphovanilin method de-scribed by Knight et al. (1972). prior to lipid analy-ses, a gravimetric assay (n = 3) was used to determine the ratio of saturated and unsaturated fatty acids in sole muscle, in order to construct a representative calibration curve. The standards used were oleic and palmitic acid (sigma) in a 75:25 ratio. lipid extrac-tion followed the homogenisaextrac-tion of the remaining muscle tissue with methanol:ethanol:water (2:2:1.8 ratio).
metallothionein concentration (mT) was de-termined on individual liver samples, after the cy-tosol had been separated from the residual fraction (30000 g, 45 min, 4ºc), heat-treated at 80ºc for 10 min, and subsequently centrifuged (30000 g, 45 min, 4ºc). aliquots of the heat-treated cytosol (25 µl) were used to quantify the mT level by differential pulse polarography (Dpp) according to the method described by Bebianno and langston (1989).
lipid peroxidation was determined in liver samples according to the method described by er-delmeier et al. (1998) which measures the amount of malondialdehyde (mDa) and 4-hydroxyalkenals (4-Hne) produced during the decomposition of polyunsaturated fatty acid peroxides of membrane
lipids. The concentration of lipid peroxidation was expressed as μmoles of mDa and 4-Hne g-1 total protein.
Statistical analyses
Differences in fish growth rates, condition indi-ces and biomarker response between cu treatments
and periods were tested by two-way analysis of vari-ance (anoVa), followed by post-hoc Tukey tests whenever null hypotheses were refuted. correlation analyses were used to test associations between all variables: instantaneous growth rates, condition in-dices and biomarkers. all analyses were performed using statistica software and a 0.05 (or lower) signif-icance level was considered in all test procedures.
Control 5 µg L-1 25 µg L-1 100 µg L-1 0.0 0.5 1.0 1.5 2.0 2.5 0 3 5 10 15 Time (days) C on di tio n fa ct or K A 0.0 0.5 1.0 1.5 2.0 2.5 3.0 3.5 0 3 5 10 15 Time (days) H S I B 0.00 0.02 0.04 0.06 0.08 0.10 0.12 0 3 5 10 15 Time (days) In st . gr ow th r at e (d -1 ) C 0.0 2.0 4.0 6.0 8.0 10.0 0 3 5 10 15 Time (days) R N A :D N A D 0.0 0.2 0.4 0.6 0.8 1.0 0 3 5 10 15 Time (days) Li pi d (% m us cl e) F 0 20 40 60 80 100 120 140 0 3 5 10 15 Time (days) P ro te in ( m g g -1 m us cl e) E 0.0 2.0 4.0 6.0 8.0 0 3 5 10 15 Time (days) M T ( m g g -1 p ro te in ) G 0.0 1.0 2.0 3.0 4.0 0 3 5 10 15 Time (days) LP O ( µ m ol g -1 p ro te in ) H
Fig. 1. – Biomarker variation with cu treatments (5, 25 and 100 μg l-1) and control group, over the 15-days exposure period (mean values
and standard error, n = 51): (a) condition factor K; (B) hepatosomatic index Hsi; (c) instantaneous growth rate in mass (d-1); (D) rna:
Dna ratio; (e) protein content (mg g-1 muscle); (F) lipid percentage (% muscle); (g) metallothionein level (mT, mg g-1 protein) and (H) lipid
resulTs
morphometric indices, condition factor K and Hsi did not show significant differences between copper treatments over the 15 days of the experiment (Fig. 1a and 1B, respectively; Table 1, p>0.05). mean instantaneous growth rates in mass were affected by cu exposure with significant differences observed between the control and the 25 μg l-1 and 100 μg l-1 cu concentrations (Fig. 1c, Table 1, F
3;48 = 5.44,
p<0.01). lower growth rates were first observed for higher cu concentrations, but by day 15 all cu treat-ments had limited mean instantaneous growth rates. Biochemical condition indices also reflected cu contamination, as mean rna:Dna ratios and lipid content were significantly lower in fish exposed to cu (Fig. 1D and 1F), although lipid content differed only between the control and the highest cu concen-tration, whereas mean rna:Dna was significantly lower than the control for all cu treatments (Table 1, F3;48 = 3.09 and F3;48 = 4.46, p <0.05, respective-ly). rna:Dna values also varied significantly with time, since higher values were observed towards the end of the experiment, by days 10 and 15, relatively to day 3 (Table 1, F3;48 = 5.92, p <0.05). muscle Dna concentration remained relatively constant over the experimental period, with no significant differences between treatments (p>0.05). Total protein content did not vary significantly with cu exposure during the 15-day trial (Fig.1e, Table 1, p >0.05).
exposure biomarkers, metallothioneins (mT) and lipid peroxidation level (lpo) indicated cu-mediated damage, although with different response levels. mT response to cu exposure was more extensive, since mT values varied significantly with both cu con-centration and time, with higher mT levels generally being observed at the highest cu concentrations and for the longest exposure times, until day 10 (Fig. 1g,
Table 1, F3;48 = 28.80, F3;48 = 6.58, F9;48 = 7.65, re-spectively, p<0.001 for all tests). interaction effects of cu concentration and exposure time on mT level indicated the most significant differences by day 10, when mT levels from all cu treatments were signifi-cantly higher than those from previous days, as well as by day 15, when mT levels from all cu treatments differed from all controls (Tukey tests, p<0.05). li-pid peroxidation only showed early time effects, as lpo levels by day 3 were significantly higher than by day 10 (Table 1, F3;48 = 6.33, p = 0.01), although no significant differences were observed between treatments. mT and lpo levels also showed inverse response patterns, with an increased mT level up to day 10 followed by a decrease until day 15, whereas lpo decreased from day 3 to day 10 and increased up to day 15 (Fig. 1g and 1H).
cu concentrations were negatively correlated with rna:Dna and instantaneous growth (r = -0.30 and r = -0.32; respectively, p<0.05 for both), and were positively correlated with mT level (r = 0.44;
p <0.05). other significant correlations were ob-served between instantaneous growth rates and rna:Dna ratios (r = 0.51; p<0.05) and between instantaneous growth and lipid content (r = 0.41;
p<0.05). Discussion
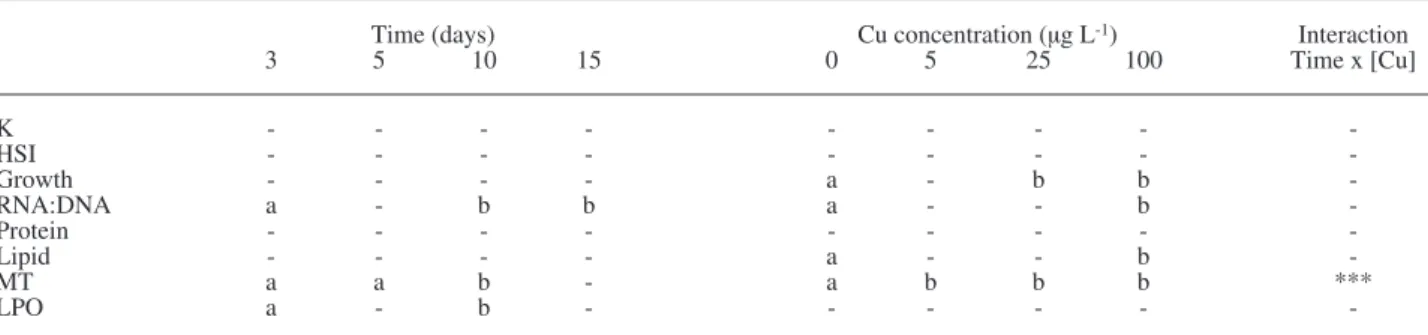
The present multibiomarker approach identified deleterious effects of sublethal copper exposure on growth and physiological condition of juvenile senegalese sole. The biochemical indices and the bi-omarkers measured responded to cu-induced stress during the 15-day trial, but the morphometric indices did not, indicating that a wider time frame would be necessary to account for any variations following Table 1. – results of the two-way anoVa statistical analysis considering the effects of exposure time, cu concentration and the interaction
effects on the biomarkers levels.
Time (days) cu concentration (μg l-1) interaction
3 5 10 15 0 5 25 100 Time x [cu] K - - - -Hsi - - - -growth - - - - a - b b -rna:Dna a - b b a - - b -protein - - - -lipid - - - - a - - b -mT a a b - a b b b *** lpo a - b - - -
-Different letters indicate significant differences, from post hoc comparison Tukey tests (a,b); *** - significant interaction effects (p<0.001); ‘-‘ no significant differences observed.
trace metal exposure, or even that these indices may not be suitable. However, levesque et al. (2002) observed differences in seasonal patterns of the con-dition factor (K) and the hepatosomatic index (Hsi) in yellow perch (Perca flavescens) chronically ex-posed to field metals. eastwood and couture (2002) also found a seasonal negative correlation between liver cu content and the scaling coefficient (slope of the linear regression between fish body weight and length) in yellow perch, but observed no variation in the Hsi.
on the other hand, changes in mass, measured as instantaneous growth rates, showed the adverse ef-fects of cu exposure, with growth rates being nega-tively correlated with cu concentrations. control group growth rates were in agreement with values observed by other authors in cultured juvenile sen-egalese sole (rueda-Jasso et al., 2004). The initial decrease in instantaneous growth rates in fish ex-posed to higher cu concentrations, compared to the control group growth rates, was maintained towards the end of the experiment, and the control values were never reached. similar results have been found in other studies (e.g. marr et al., 1996; lundebye et al., 1999), whereas yet others have found that an initial reduction in growth of exposed fish was fol-lowed by a recovery period (e.g. seim et al., 1984; De Boeck et al., 1997). growth is a direct measure of individual fish health, but it is not specific to fish stress responses to pollutants, as several other biotic and abiotic stressors can affect it. environmental conditions must be considered when one is integrat-ing growth responses and pollution stress. also, measuring growth in field studies is labour-intensive and time-consuming, so it is necessary to use proxy measures when direct growth measures are difficult to attain.
rna:Dna ratio showed negative dose and time-response effects due to cu exposure. it is well known that cu contamination may lead to Dna oxidative damage through the increase in cellular reactive oxygen species (ros), which influences the rna:Dna ratio assumption of Dna concentration constancy (Bullow, 1970). Humphrey et al. (2007) described lower rna:Dna values in barramundi (Lates calcarifer) from a highly contaminated estu-ary in north queensland, but their study estimated liver nucleic acid, which undermines the use of this biomarker as a proxy for somatic growth. De Boeck
et al. (1997) questioned the use of rna:Dna as a biomarker in toxicological studies since rna:Dna
and growth were poorly correlated in juvenile com-mon carp exposed to copper. However, in both these studies Dna concentration (liver and muscle) also varied significantly with the degree of contamina-tion, which was not the case in the present study. additionally, our study shows a positive correlation between growth rates and rna:Dna, suggesting that rna:Dna ratio indicates growth impairment in juvenile senegalese sole subjected to sublethal cu concentrations. nye et al. (2007) also found that rna:Dna was a good indicator of growth and condition in 14-day post-hatch larvae of Fundulus
heteroclitus exposed to polycyclic aromatic hydro-carbons (paHs), but also described the influence of other factors on rna:Dna, namely life-stage and maternal influence.
another assumption regarding the use of the rna:Dna ratio is that the rna concentration in-creases with protein synthesis involved in somatic growth (Bullow, 1970). However, in cases of ex-posure to contaminants, an increase in rna might be related to the induction of protein detoxification systems but also to an increase in protein turnover rate, which together would lead to high rna:Dna ratios but decreased growth rates. The question is how significant is the increase in muscle rna that is directly linked to cell response to contaminants, especially taking into account that the liver is the main organ for the detoxification of xenobiotics, and whether this increase overshadows the potential decrease in rna production due to lower growth investment in fish facing toxic stressors. one way to look at this problem is to effectively measure growth and protein synthesis. as mentioned above, growth was positively correlated to rna:Dna, in-dicating that rna variability is in any case linked to growth, although it could also be linked to other protein defence mechanisms not measured in this study. However, protein content was not significant-ly different between copper treatments and control, nor was it associated with growth or rna:Dna. This result may reflect a possible technical fault, such as inaccurate detection sensitivity in protein determination, or protein synthesis could have been similar for control and exposed fish due to different requirements, namely for somatic growth that was observed in both cases and additionally for toxicity defence mechanisms in cu exposed fish. Therefore, rna:Dna ratio may be a valuable condition indi-cator in toxicology studies, if the initial assump-tions are met throughout the study, such as fish in
comparable early life-stages, preservation of the Dna concentration throughout the contamination period, and the relation between rna variability and growth previously established. ultimately it should be complemented with another growth indi-cator, as suggested by several authors (e.g. Ferron and leggett, 1994; suthers, 1998).
The variation in muscle lipid content between the highest cu concentration treatment and control sug-gests differential energy allocation strategies, since lipid reserves of control fish were generally higher than fish subjected to cu treatments. a general de-crease with time was also observed in lipid content of fish exposed to cu. Both observations could be linked to oxidation processes derived from cu expo-sure, or on the other hand imply that lipid reserves were mobilised to respond to the toxicity stress, but also to maintain positive growth rates and thus pro-tein synthesis even under cu contamination. previ-ous studies have reported similar depletion in lipid reserves of fish subjected to metal trace exposure (rowe, 2003). additionally, higher lipid percent-ages were also observed for all treatments and the control group when compared to the initial refer-ence percentage at day 0, except for the higher cu concentration. This may be due to the change in diet from pre-experimental conditions, as trial fish were fed daily with a richer lipid diet, and despite the cu exposure their lipid storage was higher than at the beginning of the experiment.
The biomarkers of exposure response, metal-lothioneins (mT) and lipid peroxidation (lpo) indicated fish cu contamination, although only the mT level showed significant responses to different cu treatments and periods of exposure. mT levels were within the range of previous studies on metal exposure, including cu, in Solea senegalensis (riba
et al., 2004). lpo only showed differences between days of exposure. given that lipid peroxidation was quite low for cu-treated fish and showed a general pattern of decrease, it does not seem to be the main factor responsible for the above-mentioned decrease in lipid content of exposed fish, thus reinforcing the idea of lipid expenditure to sustain the toxicity de-fence mechanisms and the positive growth rates ob-served, although at slower rates than those observed for control fish. moreover, these biomarkers showed inverse response patterns, such that the decrease in mT induction towards the end of the experimental period may be due to several factors: i) exceeded cu toxicity in the liver resulting in a diminished mT
induction; ii) a biphasic pattern of mT induction with continued cu exposure; iii) precipitation of cu-mT complex in granules; or iv) an increase in other antioxidant response mechanisms (sanchez et al., 2005). However, the inverse lpo response suggests an increase in oxidative stress concomitant with mT decrease.
The lowest cu concentration tested in the cur-rent work matches environmental values commonly observed in many european estuarine systems (Hall and anderson, 1999). although our results indicate that for this level of copper exposure no significant effects on fish condition were observed (only mT level indicated cu contamination) in a short time frame, the ecological implications due to a per-manent exposure were not tested, and future work should explore this issue.
The results emphasised the need for a multi-bi-omarker approach for habitat quality assessment and toxicology studies, since common indicators of fish health, such as growth and condition, reflected the adverse effects of pollutants (cu in this case). This interaction may influence conclusions drawn from these fitness indicators in a long-term data analysis, if the alteration of physiological processes due to pollution is not taken into account.
in conclusion, exposure to high concentrations of copper in the water had direct physiological costs for juvenile senegalese sole, expressed as decreased growth and lower physiological condition (rna: Dna values), even under optimal feeding condi-tions. nonetheless, lack of variation in protein con-tent could suggest that protein requirements were both for somatic growth and protein detoxification systems. lipid reserve decreases seemed to sustain the toxicity defence mechanisms and the positive growth rates of exposed fish, although at slower rates than those observed for the control fish.
acKnoWleDgemenTs
This study was co-funded by the european un-ion through the FeDer – portuguese Fisheries pro-gramme (mare), as well as by the Fundação para a ciência e a Tecnologia (FcT). Vanessa Fonseca was funded with a phD grant (sFrH/BD/23999/2005) by FcT. Fish used in the trials were provided by cripsul, portugal. all experiments were carried out in accordance with portuguese government ani-mal care guidelines.
reFerences
adams, s.m. – 2002. Biological indicators of aquatic ecosystem stress: introduction and overview. in: s.m. adams (eds.),
Biological indicators of aquatic ecosystem stress, american Fisheries society, pp. 1-11. Bethesda, maryland.
adams, s.m. – 2005. assessing cause and effect of multiple stres-sors on marine systems. Mar. Pollut. Bull., 51: 649-657. Bebianno, m.J. and W.J. langston. – 1989. quantification of
met-allothioneins in marine invertebrates using differential pulse polarography. Port. Electrochimica Acta, 7: 511-524.
Beyers, D.W., a.J. rice, W.H. clements and c.J. Henry. – 1999. estimating physiological cost of chemical exposure: integrating energetics and stress to quantify toxic effects in fish. Can. J.
Fish. Aquat. Sci., 56: 814-822.
Blanchard, J. and m. grosell. – 2006. copper toxicity across salini-ties from freshwater to seawater in the euryhaline fish Fundulus
heteroclitus: is copper an ionoregulatory toxicant in high salini-ties? Aquat. Toxicol., 80: 131-139.
Broeg, K. and K.K. lehtonen. – 2006. indices for the assessment of environmental pollution of the Baltic sea coasts: integrated assessment of a multi-biomarker approach. Mar. Pollut. Bull., 53: 508-522.
Buckley, l.J., e. caldarone, and T.l. ong. – 1999. rna-Dna ratio and other nucleic acid-based indicators for growth and condi-tion of marine fishes. Hydrobiologia, 401: 265-277.
Bullow, F.J. – 1970. rna-Dna ratios as indicators of recent growth rates of a fish. J. Fish. Res. Board Can., 27: 2343-2349. caldarone, e.m., m. Wagner, J. st onge-Burns and l.J. Buckley.
– 2001. protocol and guide for estimating nucleic acids in larval fish using a fluorescence microplate reader. Northeast Fish. Sci.
Cent. Ref. Doc. (01-11), pp.1-22.
Daskalakis, K.D. and T.p. o’connor. – 1995. Distribution of chemi-cal concentrations in us coastal and estuarine sediment. Mar.
Environ. Res., 40: 381-398.
De Boeck, g., a. Vlaeminck and r. Blust. – 1997. effects of sub-lethal copper exposure on copper accumulation, food consump-tion, growth, energy storages and nucleic acid content in com-mon carp. Arch. Environ. Contam. Toxicol., 33: 415-422. Den Besten, p.J. – 1998. concepts for the implementation of
bi-omarkers in environmental monitoring. Mar. Environ. Res., 46: 253-256.
eastwood, s. and p. couture. – 2002. seasonal variation in con-dition and liver metal concentrations of yellow perch (Perca
flavescens) from metal-contaminated environment. Aquat.
Toxi-col., 58: 43-56.
erdelmeier, i., D. gerard-monnier, J.c. yadan and J. acudiere. – 1998. reactions of n-methyl-2-phenylindole with malondi-aldehyde and 4-hydroxyalkenals. mechanistic aspects of the colorimetric assay of lipid peroxidation. Chem. Res. Toxicol., 11: 1184-1194.
Ferron, a. and W.c. leggett. – 1994. an appraisal of condition measures for marine fish larvae. Adv. Mar. Biol., 30: 217-303. Fonseca, V.F., c. Vinagre and H.n. cabral. – 2006. growth
vari-ability of juvenile soles Solea solea and Solea senegalensis, and comparison with rna:Dna ratios in the Tagus estuary, portugal. J. Fish Biol., 68: 1551-1562.
Hall, l.W. and r.D. anderson. – 1999. a deterministic risk assess-ment for copper in european saltwater environassess-ments. Mar.
Pol-lut. Bull., 38(3): 207-208.
Humphrey, c.a., s.c. King and D.W. Klumpp. – 2007. a multibi-omarker approach in barramundi (Lates calcarifer) to measure exposure to contaminants in estuaries of tropical north queens-land. Mar. Pollut. Bull., 54: 1569-1581.
Knight, J.a., s. anderson and J.m. rawle. – 1972. chemical basis of the sulfo-phospho-vanillin reaction for estimating total serum lipids. Clin. Chem., 18: 199-202.
levesque, H.m., T.W. moon, p.g.c. campbell, and a. Hontela. – 2002. seasonal variation in carbohydrate and lipid metabo-lism of yellow perch (Perca flavescens) chronically exposed to
metals in the field. Aquat. Toxicol., 60: 257-267.
lloret, J. and s. planes. – 2003. condition, feeding and reproductive potential of white seabream Diplodus sargus as indicators of habitat quality and the effect of reserve protection in the north-western mediterranean. Mar. Ecol. Prog. Ser., 248: 197-208. lowry, o.H., n.J. rosebrough, a.l. Farr and r.J. randal. – 1951.
protein measurement with folinphenol reagent. J. Biol. Chem., 193: 265-275.
lundebye, a.K., m.H.g. Berntssen, s.e.W. Bonga and a. maage. – 1999. Biochemical and physiological responses in atlantic salmon (Salmo salar) following dietary exposure to copper and cadmium. Mar. Pollut. Bull., 39: 137-144.
marchand, J., a. Tanguy, J. laroche, l. quiniou and D. moraga. – 2003. responses of european flounder Platichthys flesus populations to contamination in different estuaries along the atlantic coast of France. Mar. Ecol. Prog. Ser., 260: 273-284. marchand, J., l. quiniou, r. riso, m.T. Thebaut and J. laroche.
– 2004. physiological cost of tolerance to toxicants in the eu-ropean flounder Platichthys flesus, along the French atlantic coast. Aquat. Toxicol., 70: 327-343.
marr, J.c.a., J. lipton, D. cacela, J.a. Hansen, H.l. Bergman, J.s. meyer and c. Hogtrand. – 1996. relationship between copper exposure duration, tissue copper concentration, and rainbow trout growth. Aquat. Toxicol., 36: 17-30.
nye, J.a., D.D. Davis and T.J. miller. – 2007. The effect of maternal exposure to contaminated sediment on the growth and condition of larval Fundulus heteroclitus. Aquat. Toxicol., 82: 242-250. riba, i., m.c. casado-martínez, J. Blasco and T.a. DelValls.
– 2004. Bioavailability of heavy metals bound to sediments affected by a mining spill using Solea senegalensis and
Scro-bicularia plana. Mar. Environ. Res., 58: 395-399.
ricker, W.e. – 1975. computation and interpretation of biological statistics of fish populations. Bull. Fish. Res. Board Can., 191: 1-382.
roesijadi, g. – 1996. metallothionein and its role in toxic metal regulation. Comp. Biochem. Physiol. C, 113: 117-123. rowe, c.l. – 2003. growth responses of an estuarine fish exposed
to mixed trace elements in sediments over a full life cycle.
Eco-toxicol. Environ. Safety, 54: 229-239.
rueda-Jasso, r., l.e.c. conceição, J. Dias, W. De coen, e. gomes, J.F. rees, F. soares, m.T. Dinis and p. sorgeloos. – 2004. ef-fect of dietary non-protein energy levels on condition and oxi-dative status of senegalese sole (Solea senegalensis) juveniles.
Aquaculture, 231: 417-433.
sanchez, W., o. palluel, l. meunier, m. coquery, J.m. porcher and s. aït-aïssa. – 2005. copper-induced oxidative stress in three-spined stickleback: relationship with hepatic metal levels.
Environ. Toxicol. Pharmacol., 19: 177-183.
seim, W.K., l.r. curtis, s.W. gleen and g.a. chapman. – 1984. growth and survival of developing steelhead trout (Salmo
gairdneri) continuously or intermittently exposed to copper.
Can. J. Fish. Aquat. Sci., 41: 433-438.
shugart, l.r., J.F. mccarthy and s.H. Halbrook. – 1992. Biologi-cal markers of environmental and ecologiBiologi-cal contamination: an overview. Risk Anal., 12: 353-360.
suthers, i.m. – 1998. Bigger? Fatter? or is faster growth better? considerations on condition in larval and juvenile coral-reef fish. Aust. J. Ecol., 23: 265-273.
van der oost, r., J. Beber and n.p.e. Vermeulen. – 2003. Fish bioaccumulation and biomarkers in environmental risks assess-ment: a review. Environ. Toxicol. Pharmacol., 13: 57-149. Wu, r.s.s., c.a. pollino, D.W.T. au, g.J. Zheng, B.H. yuen and
p.K.s. lam. – 2003. evaluation of biomarkers of exposure and effect in juvenile aerolated grouper (Epinephelus aerolatus) on foodborne exposure to Benzo[a]pyrene. Environ. Toxicol.
Chem., 22: 1568-1573.
scient. ed.: m.p. olivar.
received april 7, 2008. accepted June 17, 2008. published online December 11, 2008.