M
ASTER OF
S
CIENCE IN
FINANCE
M
ASTERS
F
INAL
W
ORK
PROJECT
EQUITY RESEARCH
:
G
OODYEAR
T
IRE
&
R
UBBER
C
O
.
B
ERNARDO
G
ONÇALVES
M
ASTER OF
S
CIENCE IN
FINANCE
M
ASTERS
F
INAL
W
ORK
PROJECT
EQUITY RESEARCH
:
G
OODYEAR
T
IRE
&
R
UBBER
C
O
.
B
ERNARDO
G
ONÇALVES
S
UPERVISOR
:
A
NA
I
SABEL
O
RTEGA
V
ENÂNCIO
Abstract
The following work consists on an Equity Research of Goodyear Tire and Rubber for
the year ending 2019F, based on assumptions considered to be viable for the next
five years, as well as, in the historical performance of the last five years. The decision
to evaluate a company such as Goodyear Tire and Rubber came from a personal
preference to further develop an analysis of a Tire and Rubber industry company.
The research report follows the CFA Institute format and begins with the company
overview, which contains a brief history that summarizes the main events up to date.
Additionally, there is an analysis of both business units and operating segments, as
well as, of other complementary brands the company has. In this part, the main
metrics taken into consideration are revenues evolution, cost of goods relative
weights, and each operating segment or business unit contribution to the overall firm
performance. To complement the business overview, it is taken into consideration the
2019 strategy roadmap and the ongoing rationalizations. Then, there is an overview
of the company shareholder structure, and how it is organized in terms of Board
Members. To complement the company snapshot, a ESG Score is computed to
better understand how the company, and the management, position in terms of
Environment, Social, Governance, and Controversies.
The next phase is centred into a more macroeconomic overview, where GDP is
taken into consideration, as a way to understand how the economic environment will
shape the industry trends and forecasts to the next years. From there follows an
Industry Overview, which is more focused on the tire and rubber market, its key
revenue and costs drivers, as well as, the competitive forces that shape todays
industry performance.
After the analytical study, an Investment analysis is performed. The main model
followed is the Discounted Free Cash Flow to Firm, which gives a target price of
$17.09/sh for 2019YE, meaning that a buy recommendation is issued, following a low
risk strategy for Goodyear Tire and Rubber. This valuation is supported by the
Adjusted Present Value, the Free Cash Flow to Equity, and the Multiples Approach,
for which the price targets where of $17.70/sh, $16.91/sh, and $18.15/sh
respectively.
For the above recommendation, the main risks are the risk-free and the growth rate
considered for the perpetuity. Nonetheless, to assess those risks and others also
considered, sensitivity analysis are elaborated to determine the impact of such
variables on the target price.
ii
Resumo
O trabalho elaborado consiste numa avaliação do preço por ação da Goodyear Tire
and Rubber Co. para o fim do ano de 2019, tendo por base pressupostos de
performance para os próximos cinco anos, bem como os dados históricos dos
últimos cinco anos. A decisão de avaliar a Goodyear baseia-se no desejo de
proceder a uma análise de uma empresa que se enquadre na indústria dos pneus e
borracha.
O relatório baseia-se no formato do CFA Institute e tem como inicio a descrição da
empresa, a qual contém um breve resumo dos acontecimentos marcantes da sua
história até a data. Adicionalmente, é feita uma análise em termos de unidades de
negócios e segmentos operacionais, bem como outras marcas complementares à
Goodyear. Nesta análise, as métricas em destaque foram a evolução das receitas, o
peso relativo dos custos, e o peso relativo de cada unidade de negócio, e segmento,
para a performance da empresa. Para complementar esta análise, é feito um
apanhado do Strategy Roadmap 2019 e das Rationalizations que a Goodyear tem
vindo a desenvolver. Posteriormente, aborda-se a estrutura de gestão da empresa,
os seus acionistas, a sua organização em termos de Diretores. É feita também uma
análise em termos de ESG Score, o que permite perceber como é que a empresa se
desempenha em termos de Environment, Social, Governance e Controversies.
A fase seguinte centra-se numa abordagem macroeconómica, baseada no GDP, de
forma a perceber como é que o ambiente económico vai moldar as tendências e o
futuro da indústria para os próximos anos. De seguida, é feita uma análise da
indústria, mais focada nos principais geradores de receitas e custos, bem como as
forças competitivas que moldam o desempenho da indústria.
Depois da análise do mercado, seguem-se os modelos. O principal modelo seguido
é o do Discounted Free Cash Flow to Firm, que se traduz num preço de $17.09 por
ação para o final de 2019, o que indica uma recomendação de compra. Esta
avaliação é suportada pelo modelo do Adjusted Present Value, pelo método Free
Cash Flow to Equity e uma análise através de Múltiplos, em que os preços
apresentados são de $17.70 por ação, $16.61 por ação, e de $18.15 por ação,
respetivamente.
Para a recomendação acima referida, os principais riscos são a risk-free e a taxa de
crescimento aplicadas ao valor terminal. Contudo, o modelo DCF foi sujeito a
análises de sensibilidade para determinar o impacto dessas variáveis, e de outras
consideradas relevantes no preço atingido.
Acknowledgements
In this section, I will take some time to thank to all of those who directly or indirectly
helped me complete the final master’s thesis, as well as, those who supported me
through my academic adventure.
First of all, I want to thank all the professors that I met along the master course. You
were able to extend my knowledge on several financial topics, as well as, prepared
me to better perform both in the academic but also in the professional field. A special
acknowledgment to Professora Ana Venâncio for all the valuable inputs concerning
the elaboration of this thesis.
I would also like to thank to every one of my close friends, the ones that are by my
side since I was a kid. I do not need to elaborate on how important you are to me,
and how much influence you have on the person I am today. Thank you for the
memories, the friendship, and the times I taught I was going to do my thesis and
ended up with a beer in my hand.
To Inês, for always believing that there is nothing I cannot do. It is no coincidence
that my most significant achievements have been made since I am with you. I wish
this never changes.
To my family, for having the difficult task to deal with a little trouble maker, and
making him realize that nothing in this life comes without hard work and dedication.
This thesis, and my life, would not be same without you. To my parents, Celso and
Fernanda, despite all the times we may not be in the same page, you know I deeply
value your insights and our moments together. I will never be able to thank you
enough for all the efforts you made so I would never miss on anything in life. I could
never have asked for a better set of parents. I hope I made you proud along the way.
iv
Index
Abstract
i
Resumo
ii
Acknowledgements
iii
Index
iv
List of Figures
vi
List of Tables
viii
Research Snapshot
1
Goodyear Tire & Rubber Co.
2
Management and Corporate Governance
5
Economic Overview
7
Industry Overview and Competitive Positioning
8
Investment Summary
13
Valuation
14
Financial Analysis
21
Investment Risks
23
Appendices
27
Appendix 1: Statement of Financial Position 27
Appendix 2: Income Statement 27
Appendix 3: Cash Flow Statement 28
Appendix 4: Key Financial Ratios 29
Appendix 5: Common-Size Statement of Financial Position 30
Appendix 6: Common-Size Income Statement 30
Appendix 7: Forecasting Assumptions 31
Appendix 8: Business and Corporate Structure 32
Appendice 9: Investors 32
Appendix 10: Porter’s Five Forces 33
Appendix 11: Net Sales Forecast 33
Appendix 12: Country and Market Risk Premium 35
Appendix 13: Debt 36
Appendix 14: DuPont 37
Appendix 15: Cost of Debt 37
Appendix 16: Weighted Average Cost of Capital 38
Appendix 18: Adjusted Present Value 39
Appendix 19: Multiples Valuation 40
Appendix 20: Peers Overview 40
Appendix 21: Free Cash Flow to Equity 41
Appendix 22: Dividend Discount Model 43
Appendix 23: Risk Matrix 43
References
45
vi
List of Figures
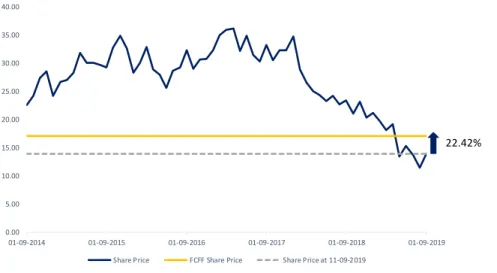
Figure 1: Historical share price
1
Figure 2: Goodyear Tire & Rubber Logo
2
Figure 3: GT net sales by product
2
Figure 4: OE and RT evolution (%)
2
Figure 5: OE and RT units (in millions)
2
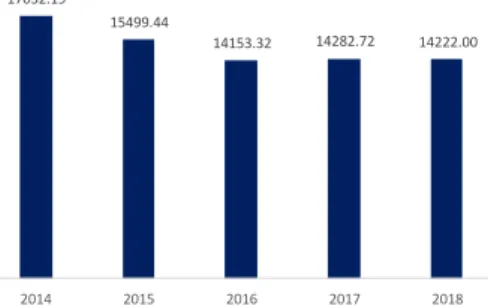
Figure 6: GT tire units sold (in $m)
3
Figure 7: Americas segment analysis (in $m)
3
Figure 8: EMEA segment analysis (in $m)
3
Figure 9: Asia Pacific segment analysis (in $m)
3
Figure 10: Rationalization plan (in $m)
4
Figure 11: Rationalization segment analysis (in $m)
4
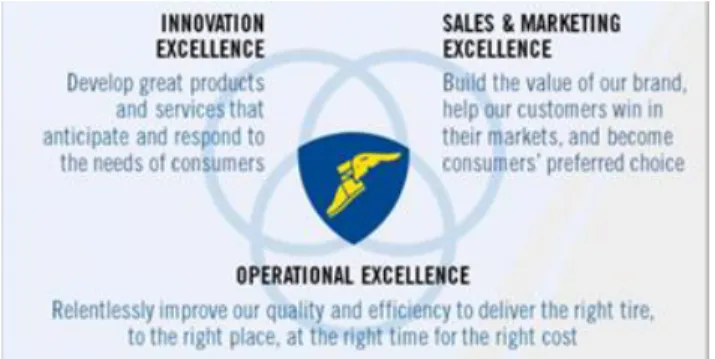
Figure 12: Strategy Roadmap 2019
4
Figure 13: Main shareholders
5
Figure 14: Number of employees
5
Figure 15: Real GDP growth (%)
7
Figure 16: GDP Growth by Regions (%)
7
Figure 17: GDP Growth by Regions Forecasted (%)
7
Figure 18: Global Tire and Rubber market value (in $bn)
8
Figure 19: Market share of main industry players (%)
8
Figure 20: Industry players market capitalization (%)
8
Figure 21: Number of cars manufactured worldwide (in bn units)
8
Figure 22: Passengers car sales in selected countries (in million units)
9
Figure 23: Total car sales volume (in million units)
9
Figure 24: Number of cars in circulation worldwide (in bn units)
9
Figure 25: Crude oil $ per barrel and natural rubber ($/kg)
10
Figure 26: Industry top 3 market players (%)
10
Figure 27: Porter's Five Forces
10
Figure 28: SWOT Analysis
12
Figure 30: Dividends Per Share (in $)
13
Figure 31: Valuation Methods Comparison (in $)
13
Figure 32: Net sales by region (2018)
14
Figure 33: Net sales by region (2023)
14
Figure 34: Tire units evolution (in million units)
14
Figure 35: OE units evolution (in million units)
14
Figure 36: RT tire units evolution (in million units)
15
Figure 37: Retail Services and Service Related Sales (in $m)
15
Figure 38: Net Profit Margin and COGS (in $m)
15
Figure 39: Selling, General and Administrative Expenses (in $m)
15
Figure 40: Forecasted Rationalizations (in $m)
16
Figure 41: Total Debt Evolution (in $m)
16
Figure 42: Net debt and net debt to capital (in $m)
16
Figure 43: Capital structure analysis (in $)
16
Figure 44: Capital structure and WACC
17
Figure 45: FCFF forecasted (in $m)
18
Figure 46: APV Computations
18
Figure 47: FCFF vs FCFE (in $m)
19
Figure 48: Share Price from different methods ($)
19
Figure 49: Business units (%) in 2023
21
Figure 50: Segments weight (%) in 2023
21
Figure 51: Current Assets and Current Liabilities Comparison
21
Figure 52: Return on Equity (ROE)
22
Figure 53: Net Profit Margin
22
Figure 54: Dividend Payout Ratio
22
Figure 55: DuPont Analysis for 2019YE and 2024YE
22
Figure 56: Risk matrix
23
viii
List of Tables
Table 1: Risk assessment
1
Table 2: GT market data at September 11, 2019
1
Table 3: Reuters Target Price
1
Table 4: Share Price Summary ($)
1
Table 5: Total Shareholders (%)
5
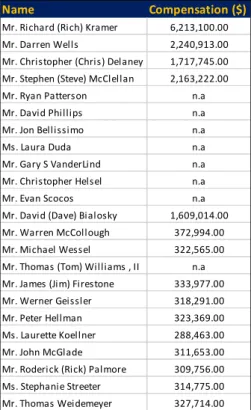
Table 6: Board members compensation
6
Table 7: GT ESG score
6
Table 8: ESG Score Ranking
6
Table 9: Discounted FCFF output
13
Table 10: Reuters Target Price
13
Table 11: WACC Calculation (%)
17
Table 12: Cost of Equity (%)
17
Table 13: Market Risk Premium (%)
17
Table 14: Country Risk Premium (%)
17
Table 15: Cost of Debt (%)
17
Table 16: Adjusted Present Value
18
Table 17: FCFE Output
18
Table 18: Relative Valuation Output
19
Table 19: Peers EV/EBITDA
19
Table 20: Peers P/BV
20
Table 21: Peers P/Sales
20
Table 22: Peers P/E
20
Table 23: EV/EBITDA Multiples Approach
20
Table 24: Sensitivity analysis for the long-term risk free (Rf) and the perpetuity growth
rate (g)
25
Table 25: Sensitivity analysis for the Sales Growth and the COGS Growth
26
Goodyear: The Road to Premiumtization
(YE2019 Price Target of $17.09 (+22.42%); recommendation is to Buy with Medium Risk)
The Goodyear Tire & Rubber Co. is an american company, and is one of the market leaders in the manufacturing and commercialization of tires. Our recommendation is to BUY under medium risk, for Goodyear Tire & Rubber (GT), with a 2019YE price target of $17.09/sh based on the discounted Free Cash Flow to Firm method, implying an upside potential of 22.42% from the September 11, 2019 closing price of $13.96/sh.
The company operates in a very competitive and mature market, where raw materials increases and low cost providers affected margins. Nevertheless, as one of the leading tire companies in the world, Goodyear is moving towards high-value segments, betting on product differentiation, quality, and security. In addition, the strong focus on research and development activities to launch new customer-specific and segment-customer-specific products, the increasing production efficiency from ongoing rationalization plans, and expansion opportunities in both India, Brazil, and China, present a positive outlook for share performance. The Free Cash Flow to the Firm, the Adjusted Present Value, the Free Cash Flow to Equity and the Multiples Approach support this view that GT is currently undervalued.
Research Snapshot
Goodyear Tire &
Rubber Co.
Buy
Medium risk
11 September 2019
United States
Table 2: GT market data at September 11, 2019
Table 1: Risk assessment
Source: Author
Source: Reuters; Author Table 3: Reuters Target Price
Figure 1: Historical share price
0.00 5.00 10.00 15.00 20.00 25.00 30.00 35.00 40.00 01-09-2014 01-09-2015 01-09-2016 01-09-2017 01-09-2018 01-09-2019
Share Price FCFF Share Price Share Price at 11-09-2019
Low Medium High
23-jun-19 23-jul-19 23-ago-19 11-set-19
Median $19.00 $17.00 $17.00 $17.00
Mean $17.92 $17.79 $17.00 $17.00
Source: Reuters; Author
Source: Reuters; Author
Table 4: Share Price Summary ($)
Source: Author
Closing price ($) $13.96
52 week price range ($) $10.75-$23.84
Shares outstanding (m units) 232.00
Market Capitalization ($m) 3238.72
Forward P/E 20.71
Dividend yield (%) 4.58%
Share Price Summary
FCFF $17.09 APV $17.70 FCFE $16.91 Multiples $18.15 Gordon Growth $9.38 Multi-Stage Growth $9.24
Share Price Summary
2
The Goodyear Tire & Rubber Company (GT) is an American multinational tire manufacturing company listed on the NASDAQ. Founded in 1898 by Frank Seiberling and based in Akron, Ohio. Goodyear started by producing bicycle and carriage tires, rubber horseshoe pads, and poker chips. Then, the company grew with the advent of the automobile, making it one of the world’s leading manufacturers of tires. Currently, GT has 47 manufacturing facilities in 21 countries around the world, employing 64,000 people. The company reported revenues of $15,475 million for 2018FY, an increase of 0.6% over 2017FY. In 2018FY, the company’s margin was 8.1%, compared to an operating margin of 7.7% in 2017FY. In 2018FY, the company recorded a net margin of 4.5%, compared to a net margin of 2.3% in 2017FY.
Business Units
Goodyear Tire & Rubber Co. operates in the Tire and Rubber industry. The company has a wide portfolio ranging from tire units to chemicals, as well as, retail services and service related sales (Figure 3).
Tire unit sales accounts for 85.28% of Goodyear total net sales in 2018. It consists of consumer, commercial, farm and off-the-road tire sales, including the sale of new company-branded tires through company-owned retail channels. Other tire and related sales accounts for 6.62% of Goodyear sales in 2018. It consist of aviation, race, motorcycle and all-terrain vehicle tire sales, retread sales and other tire related sales. Retail services and service related sales accounts for 4.36% of Goodyear sales in 2018. It consist of automotive services performed for customers through company-owned retail channels, and includes service related products. Chemical sales accounts for 3.58% of Goodyear sales in 2018. It relates to the sale of synthetic rubber and other chemicals to third parties, excluding intercompany sales. Other sales accounts for 0.16% of Goodyear sales in 2018. It include items such as franchise fees and ancillary tire parts, such as tire rims, tire valves and valve systems.
Goodyear core business activity is the development, manufacture, distribution and sale of tires and related products worldwide. Rubber tires are manufactured and marketed for a wide range of applications, from automobiles and trucks, to aircraft and industrial equipment. In each case, tires are offered for sale to vehicle manufactures for mounting as original equipment (OE) and for replacement (RT). OE products include tires as a component of newly supplied vehicles. The main customers of OE products are carmakers. On the other side, RT customer target are drivers that already own a car, but decide to, due to aging and wearing, switch their existing tires. Figure 4 shows that in 2018YE, OE represented approximately 28% of total unit sales, and RT accounted for the remaining 72%. In terms of volume, this represents 44.1 million OE, and 115.1 million RT, being sold, for a total value of $14,222 million (Figure 6).
Operational Segments
Goodyear as a multinational company conducts business activities at a worldwide scale. In terms of geographical presence, its operations are divided into Americas; Europe, Middle East and Africa (EMEA); and Asia Pacific. All the regions are responsible for manufacturing and selling tires for automobiles, trucks, buses, aircraft, earthmoving, mining and industrial equipment. Moreover, each segment
Goodyear Tire & Rubber Co.
85% 7% 4%4%
Tire unit sales
Other tire and related sales
Retail services and service related sales Chemical
Other
Figure 2: Goodyear Tire & Rubber Logo
Figure 3: GT net sales by product
Figure 4: OE and RT evolution (%)
Figure 5: OE and RT units (in millions)
112.9 115.5 117.3 113.5 115.1 49.1 50.7 48.8 45.7 44.1 2014 2015 2016 2017 2018 RT Units OE Units 70% 69% 71% 71% 72% 30% 31% 29% 29% 28% 2014 2015 2016 2017 2018 Replacement Tires Original Equipment
Source: Company data; Author Source: Company data; Author
provides related products and services, including retreaded truck and aviation tires, as well as, automobile maintenance and repair services.
Americas is the main revenue generator, accounting for 52.78% of total sales. The region additionally provides tread rubber, as well as chemical and natural rubber products to GT other business segments, and to unaffiliated customers. As Figure 7 depicts, both sales and operating margin have decreased in this region, from 2014FY to 2018FY. Lower sales combined with higher costs led to a lower segment profitability.
Europe, Middle East and Africa (EMEA) accounts for 32.89% of sales. The segment specific business activities are based on rethreading and related services for commercial truck and earthmoving, mining and industrial equipment. From 2014FY to 2018FY has been struggling with lower sales and lower profitability every year (Figure 8).
Asia Pacific generates 14.33% of GT sales. Like Americas, it is responsible for providing tread rubber. Nonetheless, from Figure 9, it is possible to see that this is the most profitable and growing segment for Goodyear.
Brands
Additionally to Goodyear, the company manufactures and sells tires under the brands Dunlop, Kelly, Debica, Sava and Fulda and various other GT owned “house” brands, and private-label brands of certain customers. This diversification strategy enables the company to be present in a variety of market segments, which ultimately places its products closer to different customer needs.
Dunlop is one of the world’s leading high and ultra-high performance tire brands
with an impressive track record of motor sport successes. Dunlop’s racing
experience is the driving force behind its product development philosophy “from track to road”, which leads to innovative technologies for tires designed for everyday motoring.
Fulda, one of Germany’s leading tire brands, offers a complete, high-quality
product with an emphasis on safeness, long-lasting performance and outstanding value for money across a wide variety of applications, from passenger cars to truck and farm applications.
Sava tire quality comes at a reasonable price with good tire performance. That gives you reassurance that you have made a cost-saving purchase with peace-of-mind.
Debica offers a wide product range of passenger car tires that are designed for stable handling and economy. Debica also produces tires for commercial vehicles including all-steel truck tires, off-road tires, and tires for agricultural machinery as well as other products from the tire industry.
Kelly integrates Goodyear North America. It is responsible for the manufacturing of tires for motor vehicles, following a strategy of high quality products at honest prices.
Rationalization Program
In order to maintain its global competitiveness, GT has implemented rationalization actions over the past several years to reduce excess, high-cost manufacturing capacity and costs.
As Figure 10 details, the core Rationalizations hit its peak at $210 million in 2016. From then on, the remaining Rationalizations have been decreasing, to $135 million and $44 million in 2017 and 2018, respectively.
Figure 6: GT tire units sold (in $m)
17032.19 15499.44
14153.32 14282.72 14222.00
2014 2015 2016 2017 2018
Source: Company data; Author
Figure 7: Americas segment analysis (in $m) 9881 9370 8172 8212 8172 9.80% 13.50% 14.1% 10.30% 8% 0.00% 2.00% 4.00% 6.00% 8.00% 10.00% 12.00% 14.00% 16.00% 0 2000 4000 6000 8000 10000 12000 2014 2015 2016 2017 2018
Net Sales Operating Margin
Source: Company data; Author
Figure 9: Asia Pacific segment analysis (in $m) 2077 1958 2106 2237 2217 14.50% 16.30% 17.7% 15.30% 12% 0.00% 2.00% 4.00% 6.00% 8.00% 10.00% 12.00% 14.00% 16.00% 18.00% 20.00% 1800 1850 1900 1950 2000 2050 2100 2150 2200 2250 2300 2014 2015 2016 2017 2018
Net Sales Operating Margin
Source: Company data; Author
Figure 8: EMEA segment analysis (in $m) 6180 5115 4880 4928 5090 7.10% 8.50% 9.7% 7.40% 7% 0.00% 2.00% 4.00% 6.00% 8.00% 10.00% 12.00% 0 1000 2000 3000 4000 5000 6000 7000 2014 2015 2016 2017 2018
Net Sales Operating Margin
4
From a segment point of view (Figure 11), one can observe that the EMEA region is the main rationalization target region. This is a company strategy to increase the segment operating income. On the other hand, Asia Pacific, because of a strong economic development, is the most profitable segment, making this cost efficient program less relevant. Additionally, corporate rationalizations that started in 2016YE also complement GT strategy to reduce excessive costs.
In 2018YE, GT incurred in a cost of $28 million related to the global plan to reduce Selling, General and Administrative headcount, and $13 million related to plans to reduce manufacturing headcount and improve operating efficiency in EMEA. Additionally, net prior year plan charges recognized in 2018YE include $15 million related to the closure of one tire manufacturing facility in Philipsburg, Germany, $3 million related to a plan to reduce manufacturing headcount in EMEA, and $3 million related to a global plan to reduce SAG headcount. Ongoing rationalization plans will total $800 million expected to be incurred in future periods.
Company strategies
In order to grow and address the challenging economic environment, Goodyear Strategy Roadmap highlights three interdependent elements (Figure 12):
Innovation excellence by developing great products and services that anticipate and respond to the needs of consumers. An example of such is the introduction of Roll, a new retail format where Goodyear can deploy in high-traffic retail locations, such as high-end-life-style centers and business districts. It also offers consumers an innovative alternative to traditional tire retail locations, allowing them to shop on their terms and select the installation option that best fits their busy schedules. Sales and Marketing excellence by building the brand value, helping its customers win in their markets, and becoming consumers’ preferred choice. An example of such is the introduction, of TireHub, a newly national wholesale tire distributor in the United States. Complemented by the company’s network of aligned regional distributors and designed to provide best in class service, TireHub enhances GT ability to capture the full brand value by selling the full depth and breadth of its portfolio.
Operational excellence by improving manufacturing efficiency and enhancing the supply chain, GT focus on reducing total delivered costs, optimizing working capital levels and delivering the best customer service in the industry. An example of such is the development of Goodyear Mobile Install, a mobile installation, available at the consumer’s preferred location and time. Working alongside its industry-leading e-commerce platform, Goodyear Mobile Install meets consumers where they are and makes the tire buying and installation process easier.
Overall, these strategies will help Goodyear achieve its ultimate goal “deliver
sustainable revenue and profit growth while increasing the brand value”.
Figure 10: Rationalization plan (in $m)
95 114 200 119 42 10 16 2 2014 2015 2016 2017 2018
Segment Rationalizations Corporate Rationalizations
Source: Company data; Author
Source: Company data
Figure 12: Strategy Roadmap 2019
Figure 11: Rationalization segment analysis (in $m) -20.00% 0.00% 20.00% 40.00% 60.00% 80.00% 100.00% 2014 2015 2016 2017 2018
Americas EMEA Asia Pacific
Ownership Structure
Goodyear’s largest shareholder (Figure 13) is Vanguard Group, Inc., an investment advisory and hedge fund firm, with a 9.46% stake in the company. BlackRock Inc., an American global investment management corporation, is the second largest shareholder with 8.87%. The third largest holder, with 4.72%, is Lsv Asset Management. The remaining shareholders are Hotchkis and Wiley Capital Management, LLC, with 4.12%. The remaining 544 Institutional Investors hold less than 4% each. Notably, inside ownership only accounts for 0.39% of outstanding shares.
Since 2013, as part of the share repurchase program, Goodyear has purchased 52.9 million shares for a total of $1.5 billion. For 2018YE, the amount of repurchased was of 8.9 million shares of its common stock for $220 million. For 2019 no significant amount of share repurchases are expected to be made. The recent share capital repurchase puts Goodyear at approximately 231 million shares outstanding. These ordinary shares trade on NASDAQ and do not grant any special rights beyond the shareholder’s general rights.
Corporate Governance
Mr. Richard J. Kramer serves as both Chairman of the Board, Chief Executive Officer and President since 2011. After his Bachelor of Science in Business Administration from John Carrol University in 1986, he joined PwC in Cleveland from 1987 to 2000. Thereafter, he moved to Goodyear as Vice President of Corporate Finance. The Chairman and CEO roles enhances the company’s ability to coordinate the development, articulation and execution of a unified strategy at both the Board and management levels.
Mr. Darren Wells serves as Chief Financial Officer and Executive Vice President. He graduated from DePauw University in 1987, with a degree on Spanish and English Composition. Adding to that, he obtained a MBA in Finance at Indiana University Bloomington. In 1989, he joined Ford Motor Company, as a Finance Specialist, staying in that company during 11 years. Afterwards he joined Goodyear as a Treasure in 2002, and then moved up until becoming CFO in 2008.
Since Goodyear operates in different regions of the world, the company has a president for each region. Accordingly, Mr. Christopher Delaney is the President for the Europe, Middle East and Africa regions, Mr. Stephen McClellan is the President for the Americas region and Mr. Ryan Patterson is the President for the Asia Pacific region.
Regarding Goodyear’s Board, Mr. McCollough was elected by the independent members of the Board to serve as Independent Lead Director. Having an extensive senior executive management experience, particularly in operations and consumer merchandising and marketing, as a Chairman and CEO of Circuit City, provides him with the necessary skills to the role.
The Board believes that the current leadership structure is the most appropriate to promote a corporate culture that is committed to acting with honesty, integrity and respect in all that they do. Moreover, Goodyear’s Board is composed of thirteen directors, 85% of them independent and elected annually, and includes six committees: Audit, Compensation, Corporate Responsibility and Compliance, Finance, Governance, and Executive
Management and Corporate Governance
9.46% 8.87% 4.72% 4.12% 3.90% 3.79% 0.39%
Vanguard Group, Inc. BlackRock Inc. Lsv Asset Management Hotchkis and Wiley Capital Management, LLC Lyrical Asset Management LP
Dimensional Fund Advisors, L.P.
Goodyear
Figure 13: Main shareholders
Source: Reuters; Author
Figure 14: Number of employees
Investor name (%) Shares Held
Vanguard Group, Inc. 9.46% BlackRock Inc. 8.87% Lsv Asset Management 4.72% Hotchkis and Wiley Capital Management, LLC 4.12% Lyrical Asset Management LP 3.90% Dimensional Fund Advisors, L.P. 3.79%
Goodyear 0.39%
Others 64.76%
Source: Reuters; Author
67000
66000 66000
64000 64000
2014 2015 2016 2017 2018
Source: Reuters; Author
6
The Executive Committee is responsible for defining the strategic plan that enables the company to achieve its operational and financial goals. Its seven members range from the President, Mr. Richard J. Kramer, to Ms. Laurette T. Kellner, the Lead Chairman.
The Finance Committee has as a Chairman Mr. James Firestone, and the main responsibilities are related with the financial planning of the company. Additionally, the four members tend to review management’s plan for significant financing transactions, as well as, review the company’s planned Capital Expenditures. The Audit Committee, with five members, oversees the accounting and financial reporting processes of the company, the compliance with legal and regulatory requirements, and the performance of independent accountants and the internal auditors. Mr. James Firestone is also present in this committee, where Mr. Peter S. Hellman is Chairman.
The Compensation Committee role is to manage the compensation of the Company’s Directors, officers, and other employees that the Committee may determine. Mr. John McGlade is the Chairman of this committee, sharing it with other three members.
The Corporate Responsibility and Compliance Committee oversee matters relating to the composition and organization of the Board of Directors, as well as, to manage the company policy of adherence to the highest legal and ethical standards. Mr. Werner Geissler is the main responsible, of four members, to monitor how the Company manages its business in a responsible manner.
Corporate Responsibility
The Committee on Corporate Responsibility and Compliance oversees GT’s corporate responsibility objectives and regularly monitors progress. In 2018, it was conducted an assessment to review corporate responsibility topics that are high priorities to the company, and its stakeholders, and to highlight opportunities for ongoing improvement. The updated Corporate Responsibility Strategy highlights a sustainable raw materials and sourcing policy, responsible operations regarding safety and health, operational impacts, product quality, end-of-life tires and business continuity.
Reuters presents the ESG Score for GT in terms of Environmental, Social, Governance and Controversies factors (Table 7).
In terms of Environmental awareness, GT achieved a rate of B+, in 2018, mainly due to the creation of an environmental management team, which performs the functions dedicated to environmental issues.
The Social criterion examines how GT manages relationships with stakeholders. With a score of B+ there are no signs of relevant disputes with existing clients, suppliers, or communities.
The Governance deals with a company leadership, executive pay, audits, internal controls and shareholders rights. For 2018, GT had a score of C+ in this dimension, in line with the last years, due to tight policy executive compensation. In terms of Controversies, GT has a score of D+, mainly due to allegations that defective Goodyear motor home tires caused crashes that killed or injured 95 people during the past two decades. Altogether, this leads to an ESG Combined Score of C (Table 8), placing Goodyear in the 51st place in terms of Environment, Social, Governance and Controversies, within the Auto & Auto Parts Industry.
Table 7: GT ESG score
Name Compensation ($)
Mr. Richard (Rich) Kramer 6,213,100.00
Mr. Darren Wells 2,240,913.00
Mr. Christopher (Chris) Delaney 1,717,745.00 Mr. Stephen (Steve) McClellan 2,163,222.00
Mr. Ryan Patterson n.a
Mr. David Phillips n.a
Mr. Jon Bellissimo n.a
Ms. Laura Duda n.a
Mr. Gary S VanderLind n.a
Mr. Christopher Helsel n.a
Mr. Evan Scocos n.a
Mr. David (Dave) Bialosky 1,609,014.00
Mr. Warren McCollough 372,994.00
Mr. Michael Wessel 322,565.00
Mr. Thomas (Tom) Williams , II n.a Mr. James (Jim) Firestone 333,977.00
Mr. Werner Geissler 318,291.00
Mr. Peter Hellman 323,369.00
Ms. Laurette Koellner 288,463.00
Mr. John McGlade 311,653.00
Mr. Roderick (Rick) Palmore 309,756.00
Ms. Stephanie Streeter 314,775.00
Mr. Thomas Weidemeyer 327,714.00
Source: Reuters; Author
Table 6: Board members compensation
Source: Reuters; Author
Ratings Score 2014 2015 2016 2017 2018 Environment B- B B B- B+ Social B+ B B B- B+ Governance C- C C+ C+ C+ ESG Score B- B- B- B- B+ ESG Controversies D+ B B C- D+
ESG Combined Score C- B- B- C C
Rank Company Name Country Current Market Cap
1 Mi chel i n SCA FR $20,056 MM
15 Conti nenta l AG DE $26,001 MM 35 Sumi tomo El ectri c Indus tri es Ltd JP $10,247 MM 51 Goodyea r Ti re & Rubber Co US $3,199 MM
Table 8: ESG Score Ranking
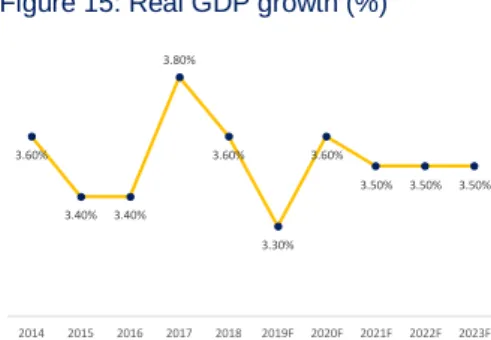
From the global financial crisis (2007-2008) onwards, the economy has been expanding, with World GDP stabilizing at 3.6% in 2018. Nevertheless, from the second half of 2018, global expansion weakened because of US-China trade tensions, macroeconomic stress in Argentina and Turkey, disruptions in the auto sector in Germany, and tighter credit policies in China. Accordingly, the IMF World Economic Outlook (2019) projects a 70% decline of the global economy, with global growth, that peaked at 4% in 2017, to decline to 3.3% in 2019 (Figure 15). During the current year, in response to rising global risks, the US Federal Reserve stopped interest rate increases. The European Central Bank, the Bank of Japan and the Bank of England moved to a more accommodative policy. China created fiscal and monetary stimulus to counter the negative effects of trade tariffs. Currently, the outlook for US-China trade tensions has improved as an eminence of a trade agreement is on sight. These policies have helped reverse the overall financial conditions, however, measures of industrial production and investment remain weak for most advanced and emerging economies, and global trade has yet to recover. Accordingly, in 2020 global economic growth is expected to return to 3.6%, while beyond that is going to stabilize at around 3.5%, mainly driven by growth in China, and India and their increasing relative importance in the world income.
The Europe, Middle East and Africa (EMEA) region slowed more than expected in 2018 (Figure 16). This results from weakening consumer and business sentiment, as well as, growing concerns about a no-deal Brexit that influenced the spending in the euro area. In Germany, one of the most relevant European Union members, suffered from delays associated with the introduction of new fuel emission standards for diesel-powered vehicles, which negatively affected the country's economic activity. In Middle East countries, geopolitical tensions contributed to weaker activity. Altogether, GDP growth for 2018 was of 2.20%, lower than the 2.50% GDP growth of 2017. For the future, IMF World Economic Outlook (2019) expects the region gross domestic product to grow at 1.8% in both 2019 and 2020, before stabilizing at 2.60% until the end of 2023.
The Americas region is also expected to follow the global economic downturn (Figure 17). In 2018 the region had a GDP growth of 2.70%, for 2019 the value is expected to be of 2.20%. While the United States economy has exceeded other major advanced economies, the fiscal policy impetus seems to fade by the end of 2019. Moreover, the impact of US tariffs will also contribute to slower economic growth. Sectors that have international competition, as the Tire and Rubber industry, will be negatively impacted by higher prices for tariff-affected imports and retaliatory tariffs imposed on US exports. Accordingly, as the fiscal policies fades and growth tends towards its modest potential, given saturated markets, the Americas region is projected to register a GDP growth of 2.20% in 2019 and 2020, which will stabilize at 2.60% from 2021 onwards.
The Asia Pacific region has been, in recent years, the global economy’s growth
engine. GDP growth was of 5.80%, in 2017. However, it felt to 5.30%, in 2018, and
for 2019, it is expected to be 5.10%. This is a result of slowdown in China’s
industrial activity, that reflects declining exports, as well as cooling real estate market and slowing automotive sector. The region economy is highly dependent on external trade performance, and with uncertain negotiations between China and the US, a stable GDP growth rate of 5.20% is expected for the 2020 to 2023 period.
Economic Overview
Figure 15: Real GDP growth (%)
3.60% 3.40% 3.40% 3.80% 3.60% 3.30% 3.60% 3.50% 3.50% 3.50% 2014 2015 2016 2017 2018 2019F 2020F 2021F 2022F 2023F 5.60% 5.60% 5.40% 5.80% 5.30% 2.30% 2.20% 2.10% 2.30% 2.70% 2.00% 1.90% 1.90% 2.50% 2.20% 2014 2015 2016 2017 2018
Asia Pacific Americas EMEA
Figure 16: GDP Growth by Regions (%)
Source: IMF 5.10% 5.20% 5.30% 5.20% 5.20% 2.20% 2.20% 2.40% 2.60% 2.60% 1.80% 1.80% 2.00% 2.20% 2.20% 2019F 2020F 2021F 2022F 2023F
Asia Pacific Americas EMEA
Figure 17: GDP Growth by Regions Forecasted (%)
Source: IMF Source: IMF
8
As mentioned before, the Tires and Rubber industry sales can be divided into two categories, Original Equipment (OE) and Replacement Tires (RT). Original Equipment, is a crucial component of newly supplied vehicles and accounts for approximately 9% of the total market volume. On the other hand, Replacement Tires, which account for 91% of the total market volume, are related to the number of cars in circulation and the life expectancy of tires.
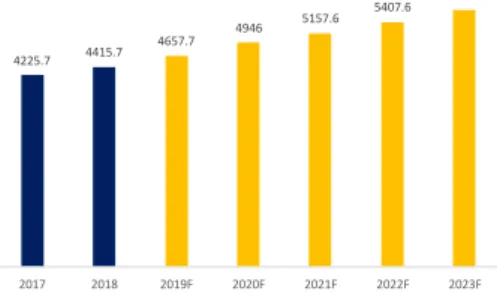
The global Tires and Rubber market register, in 2018YE, a total market value of $612 billions, a CAGR of 7.1% from the $465.4 billions set in 2014YE. In comparison, the Asia Pacific and United States markets grew at CAGR’s of 5.5% and 4.3%, respectively. Nevertheless, the performance of the market is forecasted to decelerate, with an anticipated CAGR of 5.3% for the next five years, which is
expected to drive the market to a value of $794 billions by 2023YE (Figure 18)
.
This industry is, therefore, on a mature phase and has high entry barriers, which leads to a high firm concentration. In fact, the main five companies account for around 50% of the total market share (Figure 19).
Political tensions limit industry profitability
Traditional players are based in developed countries, as Germany and United States, where there is no relevant political tensions risk due to a stable government activity. Nonetheless, manufacturers are being attracted towards the developing markets, as India and China, due to its increased tire demand and lower production costs. For those economies, unstable government actions lead to unemployment and high inflation levels. As a result, political tensions may negatively affect the companies that try to operate on those markets. Current cases, like the U.S. trade war with China and Brexit, can jeopardise the industry profitability with tariffs burden. China is set to impose a 10% import tariff on various synthetic rubber and tire products originating from the United States. Moreover, in the event of a “no-deal” Brexit, U.K. tire industry will witness a 10% tariff imposed by the European Union. Altogether, the tire manufacturers are expected to increase prices by 3% to 8% as a response.
Technological Innovation enhances a premium segment
Product innovation has become indispensable for traditional tire manufacturers focused on the high-end segment. According to Pirelli (2017), the market outlook for this segment presents growth opportunities of 10% YoY until 2022YE. What makes it so attractive, is that companies with a strong brand name and a reputation for high-quality products are able to raise prices without a severe negative impact on demand in the premium segments. Moreover, R&D investments allow firms to cut down production costs while improving profitability margins. Recent research is focused on improving tires, raising their life expectancy and increasing their security. For example, there are tires in the market that are able to repair themselves without human intervention due to a substance that makes them airtight and fills the hole.
Sustainability and Environmental awareness shape the future
The manufacturing process of tires involves the use of many chemicals, like antioxidants and antiozonants, leading to potential environmental hazards. Efforts have been made towards the decrease in waste from dismantling and recycling of
Industry Overview and Competitive Positioning
17% 13% 8% 8% 4%3% 3%1% 43% Bridgestone Corp Michelin Goodyear Tire & Rubber Co
Continental AG Sumitomo Rubber Industries Ltd Pirelli & C SpA Hankook Tire Co Ltd Nokian Tyres plc Others 25% 17% 5% 28% 3% 6% 4% 4% 4% 4% Bridgestone Corp Michelin Goodyear Tire & Rubber Co
Continental AG Sumitomo Rubber Industries Ltd Pirelli & C SpA Hankook Tire Co Ltd Nokian Tyres plc Others
Figure 18: Global Tire and Rubber market value (in $bn)
Figure 19: Market share of main industry players (%)
Figure 20: Industry players market capitalization (%)
Figure 21: Number of cars manufactured worldwide (in bn units) Source: Market Line, Global Tire & Rubber Industry 2019 Source: Reuters Source: Reuters 69.9 68.5 69.5 71.3 73.1 75.2 77.9 2017 2018 2019F 2020F 2021F 2022F 2023F
Source: Market Line, Global Tire & Rubber Industry 542.3 584.7 612 649.2 679.2 714.3 752.1 793.5 2016 2017 2018 2019F 2020F 2021F 2022F 2023F
end of life vehicles (ELVs), and development of a more environmentally friendly
production process. In addition, in response to the demand of car manufacturers’
clients, the tire producers make regular improvement on the rolling resistance, to reduce the CO2 emissions as well as to reduce fuel usage that accounts for as much as 40% of running costs in Europe.
Mobility habits provide positive outlook for Demand
Consumer preferences are moving towards more sustainable and convenient mobility solutions, due to technological and lifestyle changes. Car sharing are becoming an attractive option over the tradition car rentals. Additionally, there are several factors, as a rise in traffic and shifting thoughts towards vehicle ownership, which are encouraging car sharing services to grow in urban communities. In 2017, Uber registered 17.7 million smartphone on its car sharing app. Additionally, user behaviour will move more and more towards autonomous mobility. According to PwC (2018), 40% of the mileage driven in Europe and U.S. could be covered by autonomous vehicles in 2030, whereas in China, the penetration of shared and autonomous mobility will happen faster than in the Western world. Overall, more people will travel additional kilometres, which for the tire industry represents a positive shift in demand.
Higher regulatory requirements improve transparency
The industry has witnessed an increase on regulation and transparency over the last 10 years towards safety concerns. Requirements regarding tire labelling (EC/1222/2009) allow for better comparison between different tires on measures like performance, fuel efficiency and noise. Regulatory requirements make it harder for low cost competitors to penetrate and survive on the market.
Key Drivers
The Tire and Rubber industry performance is positively and directly related to the automotive industry. From 2014YE to 2018YE, global demand for automobiles has grown 3.92% YoY (Figure 23) mainly driven by emerging markets. China experienced an increase of vehicle demand by 16% YoY in the same period (Figure 20).
Car production increased at a 1.3% CAGR from 2014YE 64.9 million units, to 68.5 in 2017YE. Demand for OE, as a crucial component of newly supplied vehicles, is expected to follow the overall trend of automobile increasing demand.
Global car fleet in circulation is following a similar growing trend. In 2010 there were 1055 million cars in circulation, and by 2015 the number reached 1282 million. However, by 2025 global transport is set to be at 1600 million units, representing a CAGR of 2.76% from 2015 (Figure 25). Additionally, improvements in rubber quality and better road conditions have increased the life tire expectancy to 30,000 km for automobiles tires, leading to a decrease of the replacement turnover. However, cars are driven more frequently, making it necessary to buy replacement tires every 18 months. All in all, RT demand have been positively affected by those developments, as well as for a positive outlook regarding the number of cars in circulation worldwide.
The main cost drivers of tires are natural rubber and synthetic rubber. Natural rubber is obtained through rubber trees, which requires warm climates. As a result, the main countries that export this good are Thailand and Indonesia. On the other hand, synthetic rubber can be produced from petrochemical feedstocks with crude
Figure 23: Total car sales volume (in million units)
Figure 24: Number of cars in circulation worldwide (in bn units)
Source: The International Organization of Motor Vehicles Manufacturers
1.06 1.10 1.14
1.19 1.24 1.28 1.60
2010 2011 2012 2013 2014 2015 2025F
Source: The International Organization of Motor Vehicles Manufacturers Source: The International Organization of Motor Vehicles Manufacturers
Figure 22: Passengers car sales in selected countries (in million units)
0 5 10 15 20 25 China US Japan Germany 4225.7 4415.7 4657.7 4946 5157.6 5407.6 5667.4 2017 2018 2019F 2020F 2021F 2022F 2023F
10
oil as the main input. Accordingly, an increase in the oil price leads to an increase in synthetic rubber price, increasing the demand for natural rubber (Figure 25).
Competitors Analysis
The companies more representative of the Tire and Rubber Industry, ranked by market share and size, are: (1) Bridgestone; (2) Michelin; (3) Goodyear; (4) Continental; (5) Sumitomo; (6) Pirelli; (7) Nokian and (8) Hankook.
In 2004YE, the main three tire manufacturers (Bridgestone, Michelin and Goodyear) accounted for 54% of the total market, whereas in 2017YE its market share reduced to 38% (Figure 26), due to the entry of new players from emerging countries and Asia Pacific economic expansion.
The traditional players are investing in a product differentiation strategy, focusing on brand recognition, product quality and safety, which allow them to have an average selling price (ASP) 31% higher than low cost companies. Therefore, to protect their gross margins of 30%, traditional players are moving towards the tires premium segment, where product quality is in high demand.
By opposition, the low-cost players follow a cost efficiency strategy, which allows them to deliver the product at an ASP of € 58 and still be profitable. Gross margins of 21.9% are established through a light cost structure and lower labour costs. Additionally, Asian companies tend to produce tires with a smaller percentage of natural rubber, and a higher percentage of synthetic rubber, at the expense of the overall product quality.
Porter’s Five Forces
Competition within the industry (High)
High concentrated industry, where top 5 market companies have roughly 50% of the market. Low levels of product differentiation, within each segment, translates in competition on prices. Companies are now trying to gain competitive advantage by investing in other parameters such as performance, reputation and customer service. Decreasing operating margins due to the competitive environment and growing influence of low-cost Asian competitors, means that industry profitability is dependent on input prices. Industry sales are expected to grow at a CAGR of 5.1% from 2018YE to 2023YE (Figure 23). Consequently, firms need to fight for market share, which contributes for the overall high level of competition within the industry.
Bargaining Power of Buyers (Moderate)
Tire manufacturers face two main group of buyers, the vehicle manufacturers, such as General Motors and Ford, and tire dealers, such as the Tire Kingdom and Vianor. The tires and rubber market is difficult to enter due to high fixed-costs. It is also concentrated with a relatively small number of established players, like Continental, Bridgestone and Goodyear. Overall, this reduces buyer power since buyers have limited options when deciding which tires to purchase. Nevertheless, many players in the auto industry, such as BMW and Ford, possess significant financial power as well as operational scale. Accordingly, those companies have a high bargaining capacity, since any order they place in the market is for a significant amount of tires to be supplied. And as a result, tire manufacturing companies would not mind to lower their usual prices in order to accommodate such a large order. Regarding the RT segment, tire dealers are often smaller and more numerous. This decreases buyer power, as these dealers do not possess the same financial leverage that automotive players have. OE manufacturers’ contracts create a higher switching cost for automotive manufacturers, whereas the RT
Figure 27: Porter's Five Forces Source: Bloomberg
Source: Author
Figure 25: Crude oil $ per barrel and natural rubber($/kg)
Figure 26: Industry top 3 market players (%)
38% 62%
2017
Bridgestone + Michelin + Goodyear Others
0 1 2 3 4 Competition within the
Industry
Bargaining Power of Buyers
Bargaining Power of Suppliers Threat of New Entrants
Threat of Substitute Products Score Range 5- Critical 4- High 3- Moderate 2- Low 1- Insignificant 0.5 1 1.5 2 2.5 3 20 40 60 80 100 120 140
Crude Oil Natural Rubber
54% 46%
2004
Bridgestone + Michelin + Goodyear Others
segment is more likely to place periodically orders, reducing these costs. On the other hand, tire dealers and vehicle manufacturers tend to be price sensitive, increasing buyer power. Even though these buyers have different dimensions, they all are highly price sensitive because their goal is to minimize costs and increase profits. In order to do so they have to get the cheapest contracts from the tire manufacturers. Small size, tire dealers, do not have a big economic power, thus they cannot bargain a better deal. However, vehicle manufacturers have higher economic power, being able to negotiate better and cheaper deals. Overall, the bargaining power of buyers is moderate.
Bargaining Power of Suppliers (High)
Few large world players dominate the manufacturing and processing of both natural and synthetic rubber. Hence, the existence of organisations that control the supply of natural rubber and petroleum such as OPEC, translates in higher bargaining power of suppliers. Tire profitability is highly sensitive to price fluctuations of rubber and other petroleum derivatives since those raw materials are essential to tire production. To mitigate the dependence on few providers of raw materials, some manufactures started to perform backward integration, as in the case of Goodyear, where the company produces some percentage of its rubber needs. Overall, leads to a high bargaining power of suppliers.
Threat of New Entrants (Moderate)
The industry has high barriers to entry, because most tires are relatively undifferentiated, meaning that companies to be profitable, need to produce in large quantities to achieve economies of scale. High capital expenditures are required, so it is challenging new entrants to match the scale of the existing producers. Furthermore, a substantial amount of R&D is required to develop and test new tire models, whose approvals are difficult and costly to get due to strict legal and safety regulations. Market leaders dominate the OE manufacturers market, whereas the RT segment has a greater degree of fragmentation and therefore is at greater risk of new entrants. Although there is product differentiation and differences in quality, new entrants can compete on price due to the moderate level of regulation and performance requirements. This can be seen in the increased number of Chinese brands entering the United States market and the subsequent tariffs imposed by the US. The issue of scale means it is difficult for these new players to compete for
large OE manufacturers’ contracts with established automotive manufacturers.
However, the consolidation of smaller manufacturers could lead to increased competition at the premium end. Altogether, the current and forecasted growth rate for the market make it an attractive option for companies, leading to a moderate risk level of new entrants.
Threat of Substitutes Products (Low)
The likelihood of substation in this market is weak. Players could suffer if tire rethreads became more common for all vehicles. This service involves applying new treads to existing tire casings. However, the service is undertaken by players in the market and is unlikely to move into mass-market tires. It would not affect the OE segment, as new vehicles cannot be sold without a corresponding set of tires. On the other hand, counterfeit tires accounts for 7.5% of direct tire sales lost each year, in the EU. However, the manufacture of counterfeit objects is dangerous to consumers as counterfeiters are not concerned with quality checks and tests.
12
Accordingly, on the long run, the counterfeit market share is not expected to increase, not being considerate a viable substitute for tires.
SWOT Analysis Strengths
Goodyear is one of the market leaders in the tire and rubber industry, with operations at a worldwide scale. The company is one of the leading tire makers in North America, and the second largest tire manufacturer in Europe, having 48 manufacturing facilities spread across 21 countries. A well-spread network of operations enables the company to achieve scale economies, as well as, take advantage of resources available locally for manufacturing, thereby reducing costs and maximizing profits. The focus on research and development activities, enables the company is able to create new customer-specific and market-specific products. Altogether, increasing investment, combined with a strong market position and a well-known brand, enables the company to gain more customers, strengthen its customer base, which results in improved sales.
Weaknesses
The company reported a decline on its cost efficiency since 2017YE. Goodyear had increasing operating costs, leading to a decrease on its operating margins. Additionally, there have been various lawsuits filed against Goodyear, which may negatively impact its profitability and damage its reputations.
Opportunities
The company’s business expansion initiatives strengthen GT geographical presence, as well as, increasing its scope of business operations. Those activities reinforce the company competitive position in the industry. Additionally, a robust forecasted growth for the global automotive manufacturing provides a positive outlook for the Tires and Rubber industry. Hence, the company is well positioned to benefit from the growing markets.
Threats
The company is exposed to foreign currency risk due to its global operations. The financial results of operations of the company’s subsidiaries are recorded in various foreign currencies and then converted into US dollars, at the applicable exchange rate, for consolidation into GT financial statements. Accordingly, volatility of currency exchange rates may adversely affect Goodyear’s operating results. Additionally, the production of tires as suffered from increasing regulation in the last years. Goodyear operations, in particular, are subjected to various regulations in many countries in which it operates. These regulations could increase production costs and distress company’s earnings and margins. Accordingly, the company had capital expenditures for pollution control facilities and occupational safety and health projects of $40 million in 2017YE, and $50 million in 2018YE.
Strenghts
• Focus on R&D Acitivities • Manufacturing Capabilities • Market Position
Opportunities
• Strategic Acquisitions • Business Expansion Activities • Global Tire and Rubber Industry
Weaknesses
• Cost Inneficiency • Increasing Trade Receivables • Litigation
Threat
• Raw Material Procurement Risks • Regulations
• Currency Fluctuations
Figure 28: SWOT Analysis
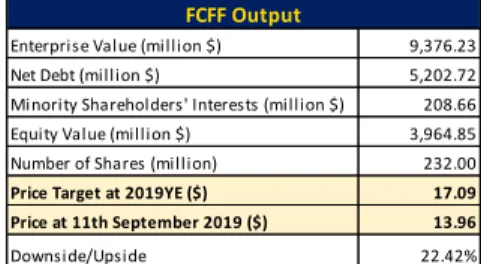
With a price target of $17.09/sh and an upside potential of 22.42% for 2019YE using the Discounted Free Cash Flow to Firm Method, and a medium risk assessment, the recommendation stands for BUY (Table 8). The Adjusted Present Value method, the Free Cash Flow to Equity, and a relative valuation through Multiples supports this buy recommendation, with price targets of $17.70/sh, $16.91/sh and $18.15/sh, respectively, indicating that GT is currently undervalued. The analyst consensus also shares this view, with Reuters valuing the company at $17.00/sh (Table 9).
Key value drivers and potential catalysts
Goodyear is one of the leading tire companies, with a stable market position and operations at a worldwide scale. Its presence in the US has been deepened with the introduction of TireHub and Roll, services that can easily be replicated in the remaining regions where GT operates. In addition, the recent drop in price, the strong focus on research and development activities to launch new customer-specific and segment-customer-specific products, the increasing production efficiency from ongoing rationalization plans, and the expansion opportunities in both India, Brazil, and China, present a positive outlook for share performance, thus justifying the above BUY recommendation.
Earnings Forecast
The forecasted period, between 2019YE and 2023YE, started with a sharp decrease in net income, from $693 million, in 2018YE, to $156 million, in 2019YE. This is mainly due to the increase on the costs of raw materials and the decrease in global demand for tires. As a result, the Earnings per Share (EPS) for 2019YE drop to $0.68 per share. Nevertheless, the economic downturn is expected to revert, meaning that from 2020YE onwards, the EPS is expected to move from $1.14, in 2021YE, to $1.74, in 2023YE (Figure 29).
On the other side, the dividend policy of Goodyear is going to be favourable to investors who seek to cash in dividends from holding this stock. For 2019YE the company plans to pay a quarterly $0.16/sh dividend, $0.06/sh higher than the amount paid in 2018YE. This represents, in absolute terms, the same value of Dividends Paid for 2019YE, however, due to the company policy to buy back some of its stock, there are less shares outstanding. For the remaining period, from 2020YE to 2023YE, the dividends will average at $0.64/sh (Figure 30).
Valuation Methodologies
In order to evaluate Goodyear, both absolute and relative methodologies were used (Figure 31). For the absolute valuation methods, the principal models followed were the Discounted Free Cash Flow to Firm (FCFF), the Adjusted Present Value (APV) and the Free Cash Flow to Equity (FCFE). Additionally, the Dividend Discount Model was computed as complementary model (Appendix 22). The relative valuation model was done through the Market Multiples approach, where a Peer Group of companies were chosen taking into consideration their similarity degree with Goodyear, in terms of size, risk, and market value (Appendix 20 and 21).
Investment Summary
Table 9: Discounted FCFF output
6. Investment
Summary
Figure 31: Valuation Methods Comparison (in $)
Source: Author
Figure 29: Earnings Per Share (in $)
Source: Author
Figure 30: Dividends Per Share (in $)
Source: Author 0.31 0.44 0.58 0.64 0.64 0.67 0.63 0.64 2016 2017 2018 2019F 2020F 2021F 2022F 2023F
Enterprise Value (million $) 9,376.23 Net Debt (million $) 5,202.72 Minority Shareholders' Interests (million $) 208.66 Equity Value (million $) 3,964.85 Number of Shares (million) 232.00
Price Target at 2019YE ($) 17.09
Price at 11th September 2019 ($) 13.96 Downside/Upside 22.42% FCFF Output 5.02 1.44 2.99 0.67 0.70 1.14 1.66 1.74 2016 2017 2018 2019F 2020F 2021F 2022F 2023F 17.09 17.70 16.91 18.15 9.38 9.24
FCFF APV FCFE Multiples Gordon Growth
Multi-Stage
Source: Reuters
Table 10: Reuters Target Price
23-jun-19 23-jul-19 23-ago-19 11-set-19
Median $19.00 $17.00 $17.00 $17.00
Mean $17.92 $17.79 $17.00 $17.00