UNIVERSIDADE DE LISBOA FACULDADE DE CIÊNCIAS
DEPARTAMENTO DE BIOLOGIA VEGETAL
Epitranscriptomic deregulation in bladder cancer:
Implications for tumour aggressiveness
Catarina Sofia Guimarães Teixeira
Mestrado em Biologia Molecular e Genética
Versão Definitiva
Dissertação orientada por:
Professora Doutora Carmen de Lurdes Fonseca Jerónimo
Professora Doutora Margarida Gama Carvalho
“Imagination is more important than knowledge. Knowledge is limited. Imagination encircles the world.”
AGRADECIMENTOS
Um ano de trabalho, um ano de desafios, um ano de dúvidas e nunca de certezas, um ano de ciência! Aqui apresento o meu trabalho final, onde desde já agradeço a toda a gente que me ajudou e o tornou possível.
Em primeiro lugar gostaria de agradecer à minha orientadora, Professora Doutora Carmen Jerónimo por me ter aceite no maravilhoso Grupo de Epigenética e Biologia do Cancro, propondo-me um enorme desafio. Agradeço a sua disponibilidade para a resolução de todos os problemas científicos que surgiram, por todo o apoio e especialmente, por toda a paciência que teve comigo ao longo deste ano.
Em segundo lugar, ao Professor Doutor Rui Henrique que esteve sempre disponível para partilhar as suas ideias e para ajudar em tudo o que precisasse. Sem dúvida um grande contributo para o projeto.
Quero igualmente agradecer ao Diretor do Centro de Investigação deste instituto, Professor Doutor Manuel Teixeira, por ter permitido a minha presença e a de muitos outros estudantes, e me permitir concretizar este trabalho.
Uma palavra de agradecimento ao Engenheiro Luís Antunes pela sua disponibilidade e ajuda nos resultados estatísticos.
Expresso o meu agradecimento à Professora Doutora Margarida Gama Carvalho, minha orientadora interna, por me ter facilitado o intercâmbio entre a universidade de Lisboa e o IPO-Porto e me ter permitido desenvolver a minha dissertação.
Quero também deixar um enorme agradecimento, porque sem dúvida que foi uma pessoa essencial neste projeto, à Sara Monteiro Reis. Um verdadeiro apoio que me transmitiu imenso conhecimento, ajudou-me com todos os desafios neste percurso e aturou todos os meus dramas quando parecia que estava num beco sem saída. Um obrigado não chega!
Gostaria de deixar um agradecimento muito especial à Cláudia Lima que lutou muito para que a maldita coorte de bexiga em comum nos nossos projetos ficasse completa! Agradeço por me ter acompanhado de uma forma especial ao longo deste ano, por ter aturado as minhas manias, a minha maneira autoritária de falar e, especialmente, por ser a melhor pessoa que eu podia ter ao meu lado neste desafio.
Um gigante agradecimento a todas as pessoas que fazem parte da minha sala, companheiros de mestrado, Vera Constâncio, Rita Oliveira, Mariana Brütt e Gonçalo Pinho que sofreram da mesma dor que eu, as mais recentes mestres, Sandra Nunes, Catarina Macedo e Ana Lameirinhas, à aluna de doutoramento infiltrada, Daniela Barros, sem esquecer os mais recentes alunos de mestrado, Zé Pedro, Luísa e Filipa, e à Carina Maia, por nos mandar fazer os consentimentos nas alturas mais inoportunas. Eles que ouviram as minhas histórias diárias, sentiram a minha dor com as imunohistoquímica e Western blot, aturarem a personagem que é a “Teixas” e melhor de tudo, fizeram deste magnífico ano no Porto, o melhor que eu podia desejar. Uma nota particular para a Daniela Barros e Ana Lameirinhas porque de facto foram incansáveis na reta final e a ajuda delas foi preciosa!
Quero também agradecer às mais velhas, Vera Gonçalves pela disponibilidade a toda a hora, Sofia Salta e Helena Pereira pela ajuda que disponibilizaram e por relembrar sempre que o cabelo tem que estar atado no laboratório e claro, Vânia Camilo.
Também incluído no grupo dos “mais velhos”, mas sem dúvida o mais imprescindível, João Lobo. Mesmo na Holanda, esteve sempre, sempre mesmo, disponível para o meu projeto e sem ele, não seria possível a concretização do mesmo. Um gigante obrigado.
Quero agora deixar um agradecimento à Iris Garrido Cano, a espanhola que encheu três meses deste percurso de alegria e muito ensinamento. Não podia imaginar que neste momento estaria aqui a
demonstrar este carinho gigante por ela, mas sem dúvida que foi um pilar essencial, que me ensinou muito e que me enche de orgulho! Nunca a vou esquecer e vai ter um lugar especial no meu coração.
Deixo também uma palavra ao Miguel Queirós que mesmo na capital de Portugal, longe de mim, aturou-me um ano em Lisboa e continuou a aturar-me durante este ano no Porto. É uma pessoa incrível que eu só posso desejar o melhor que a vida pode oferecer. Quero também deixar uma palavra de agradecimento à Ana Rita Prada que também me acompanhou em Lisboa e que tornou Lisboa uma cidade mais bonita aos meus olhos.
Quero também expressar o meu agradecimento aos meus amigos que não lidam tanto comigo no dia a dia, mas contribuíram para o sucesso da minha vida profissional e também pessoal, em especial à Mariana Andrade e à Paula Sampaio que estão lá quando preciso.
Embora um pouco de fora de toda esta história que é a “ciência”, quero demonstrar o meu enorme agradecimento à minha família! Só eu sei o quanto eles olham para mim e se sentem orgulhosos por esta caminhada que realizei até aqui. Começo pelo melhor pai do mundo, que me transmite sempre muita confiança e muito positivismo! Que mesmo longe, consegue com uma chamada alegrar o meu dia e me fazer sorrir mesmo que tudo esteja a correr mal. Agradeço de igual maneira à minha mãe que teve sempre uma palavra amiga para me dar, que desejou sempre o meu sucesso e me ajudou nesta luta diariamente. Obrigado por todos os conselhos e por me teres tornado a mulher que sou hoje.
Quero agradecer ao meu irmão de uma forma muito especial, por ser um orgulho para mim, por todo o apoio, por todos os risos e especialmente por ser um confidente. Agradeço aos meus avós, tios, primos pelo papel ativo na minha educação e pela presença nesta caminhada.
RESUMO
O cancro de bexiga é o nono cancro mais incidente no mundo e a décima terceira principal causa de morte por cancro, de acordo com o estudo GLOBOCAN 2018. A maioria dos casos de cancro de bexiga (> 90%) surge no revestimento interno do trato urinário (urotélio) e são designados por carcinoma de células uroteliais. Os subtipos menos comuns são o carcinoma espinocelular, adenocarcinoma, carcinoma de pequenas células e sarcoma. Adicionalmente, o cancro de bexiga pode ser classificado em não músculo-invasivo e em músculo-invasivo. Este primeiro, é responsável por aproximadamente 75% de todos os cancros de bexiga diagnosticados. Apesar destes tumores, geralmente, não representarem uma ameaça à vida dos doentes, a taxa de recorrência é elevada. Por outro lado, tumores músculo-invasivos, que representam cerca de 25% dos casos, são tumores clinicamente mais agressivos, que podem progredir rapidamente, apresentando capacidade de invadir e metastizar para outros órgãos. Assim, há uma necessidade urgente de compreender os mecanismos de progressão do cancro de bexiga, para assim desenvolver novas estratégias de diagnóstico, bem como abordagens terapêuticas efetivas.
Nos últimos anos, o número de estudos na área da genética, epigenética e epitranscriptómica aumentaram drasticamente, principalmente devido ao rápido aprimoramento das tecnologias de sequenciação de alto rendimento de nova geração.
CH Waddington, definiu originalmente o termo Epigenética como o estudo de "mecanismos causais pelos quais os genes do genótipo produzem efeitos fenotípicos". Ao longo do tempo, esta definição sofreu algumas alterações, sendo, hoje, definida como “o estudo de alterações hereditárias na expressão génica que ocorrem independentemente das alterações na sequência primária de ADN". Recentemente foram identificados novos mecanismos de regulação da expressão génica, ao nível do ácido ribonucleico (ARN), designado por epitranscriptómica. Esta refere-se ao estudo de modificações químicas, reversíveis, que podem ocorrer quer em moléculas de ARN, quer em ARN não codificante (ncARN) e em ARN mensageiro (mARN).
A N6-metiladenosina (m6A), metilação da adenosina na posição nitrogénio-6, é a modificação
química interna mais abundante nos mARNs dos seres eucarióticos. Esta modificação ocorre, preferencialmente, na sequência DRACH (onde D indica A/G/U; R indica A/G e H indica A/C/U), sendo especificamente enriquecida próximo do codão stop, nas regiões 3' não-traduzidas e em grandes exões internos. O seu potencial na regulação da expressão génica foi recentemente explorado e sabe-se que, esta modificação pode afetar diferentes vias do mARN, como a transcrição, splicing, exportação do núcleo e tradução. Nas células de mamíferos, esta modificação é catalisada pelo complexo m6A
metiltransferase ("writters") e pode ser removida pelas desmetilases ("erasers"). Além disso, existem proteínas que se ligam diretamente à modificação m6A, mediando a sua função. Estas são conhecidas
como “readers”. Vários estudos revelaram que a metilação do m6A, bem como das suas proteínas
reguladoras, desempenha um papel crucial no processo de tumorigénese em diferentes modelos. No entanto, o envolvimento desta modificação no cancro de bexiga é ainda limitado, sendo, portanto, necessário investigar as suas funções no contexto desta neoplasia.
O objetivo do nosso estudo é descobrir o papel da m6A no cancro de bexiga, a fim de perceber
quais os mecanismos moleculares subjacentes à agressividade tumoral.
A seleção das proteínas reguladoras da m6A mais informativas para o nosso projeto foi realizada
pela análise in silico dos dados de ARN-seq de doentes com cancro de bexiga músculo-invasivo, disponíveis na base de dados do TCGA. Esta análise revelou que as principais proteínas reguladoras da m6A desreguladas eram o METTL3, METTL14, VIRMA, WTAP, que formam um “writter complex”,
sendo o METTL3 a única proteína com atividade catalítica, o ALKBH5 e FTO, que têm a capacidade de desmetilar o m6A, e o YTHDF3 que tem como função “ler” a marca no citoplasma, determinando se
Assim, foi selecionada (n=120) uma série de tecidos de cancro de bexiga primário, sem qualquer tratamento, dos quais 50% são músculo-invasivo e 50% não músculo-invasivo), bem como uma série de tecidos normais. Em seguida, foi realizada quantificação proteica, por imunohistoquímica. Tal serviu para comparar a expressão em tecidos tumorais e tecidos normais, sendo que, dentro dos tecidos tumorais, a expressão diferencial nos músculo-invasivo e não músculo-invasivo também foi avaliada.
A METTL3, METTL14, VIRMA, ALKBH5 e YTHDF3 apresentam uma expressão significativamente menor nos tumores por comparação com tecidos normais. Além disso, a METTL3 e a METTL14, que formam um heterodímero estável, apresentam uma redução de expressão significativa nos tumores músculo-invasivo, quando comparado com os não músculo-invasivos.
Analisámos a correlação da expressão destas proteínas reguladores e da m6A entre si. Para além
disso, observámos que a expressão do reader (YTHDF3) e de todos os writters estudados se correlacionou positivamente com a expressão da m6A. O mesmo foi observado em relação à expressão
das erasers. Curiosamente, também foram observadas correlações entre a expressão dos writters e erasers, com exceção da WTAP com ambas as erasers, bem como do VIRMA e do FTO. Assim, estes resultados sugerem que a correlação observada entre os writters e as erasers pode ser explicada através de um feedback compensatório, ou seja, a diminuição dos escritores vai diminuir consequentemente a m6A, levando a uma diminuição das erasers que desmetilam esta modicação.
A metilação desta modificação no ARN e a expressão das suas proteínas reguladoras, foi avaliada em linhas celulares de bexiga através do ensaio colorimétrico e Western blot, respetivamente. Uma linha celular normal, SVHUC-1, e sete linhas celulares tumorais foram usadas. Relativamente à modificação da m6A, não foram observadas diferenças significativas nas diferentes linhas celulares. Em
relação às proteínas reguladoras, também não se observaram diferenças significativas para a expressão destas entre as linhas celulares testadas, com exceção do METTL14 que apresentou níveis bastantes variáveis, sendo a linha UMUC3, aquela com valores mais elevados desta proteína.
Nesta sequência, com o objetivo de induzir in vitro a ablação da expressão do METTL14, foi realizado o knockdown deste gene na linha celular UMUC3, recorrendo ao sistema CRISPR-Cas9. Para avaliar a eficiência desta técnica, realizámos Western blot, onde foi comparada a expressão do METTL14 na linha celular com knockdown e na linha UMUC3 normal.
Após confirmar a eficiência da redução da expressão em pelo menos 50% do METTL14, os níveis da modificação da m6A foram avaliados, a fim de perceber a importância desta proteína no
complexo. Posteriormente, foram realizados ensaios fenotípicos para determinar o impacto da diminuição da sua expressão na linha celular de cancro de bexiga.
Os ensaios in vitro demonstraram que a redução da expressão do METTL14 promoveu uma redução de 50% na modificação da m6A. Destes, os ensaios de viabilidade e proliferação celular,
demonstram que a redução de METTL14 aumenta significativamente a viabilidade e proliferação das células de cancro de bexiga. Além disso, verificámos igualmente, que havia um aumento na capacidade de invasão e migração, comparativamente com as linhas controlo. Em sentido inverso, o knockdown do METTL14 traduziu-se numa redução na taxa de apoptose das células tranfectadas.
Em resumo, a expressão das proteínas modeladoras da marca m6A encontram-se desregulada
no cancro de bexiga. Particularmente, a regulação negativa do complexo METTL3/METTL14 metiltransferase associou-se à progressão do cancro de bexiga não musculo-invasivo para o cancro de bexiga músculo-invasivo.
Estudos anteriores indicam que, embora a METTL14 não possua uma função catalítica, é capaz de formar um heterodímero com a METTL3, sendo necessário para a estabilização e função do complexo. Interações específicas entre o domínio METTL14- MTD14 e o domínio do METTL3- MTD3 são necessárias para a atividade catalítica da METTL3. Na mesma linha, descobrimos que a redução da expressão da METTL14 diminui a atividade do complexo writter e, portanto, a capacidade de
um papel supressor tumoral, estando a redução da sua expressão associada a características celulares tumorais de maior agressividade.
ABSTRACT
N6-methyladenosine (m6A) modification is the most abundant internal chemical modification
of mRNAs in eukaryotes. Several studies revealed that m6A RNA methylation and the associated
regulatory proteins, play crucial roles in the tumorigenesis processes of numerous types of cancers. However, knowledge of the mechanistic network between m6A and bladder cancer (BC) is limited and
therefore it is necessary to investigate the functions of this modification.
The aim of our study is to uncover the role of this modification in BC in order to understand the mechanisms associated with tumour aggressiveness.
In silico analysis of TCGA data disclosed altered expression of the major m6A regulatory proteins,
prompting subsequent validation. M6A, METTL3, METTL14, VIRMA, WTAP, ALKBH5, FTO and
YTHDF3 protein expression were evaluated in a series of primary BC (n=120) and normal bladder (n=40) tissues. M6A RNA methylation and respective regulatory proteins expression were also assessed
in bladder cell lines. METTL14 knockdown was performed in UMUC3 cell line using CRISPR-Cas9 system in order to study its relevance in bladder carcinogenesis.
METTL3, METTL14, VIRMA, ALKBH5 and YTHDF3 showed significantly lower expression levels in tumour compared to normal tissues. Moreover, METTL3 and METTL14 (heterodimeric catalytic core) showed a significant reduction in muscle invasive (MIBC) comparing with non-muscle bladder cancer (NMIBC). No differences were apparent for m6A regulatory proteins’ expression among
the tested cell lines, except for METTL14, that presented heterogenous levels of this writer in the different cells comparing with normal cell line. The in vitro METTL14 downregulation promoted a 50% reduction in m6A modification. METTL14 knockdown showed increased cell viability/proliferation,
invasion and migration capacity, whereas decreased apoptosis was found in the same cells compared with the control.
Our results suggest that METTL14 might have an important role in bladder cancer, and its expression associated with bladder cancer aggressiveness.
TABLE OF CONTENTS
INTRODUCTION ... 1
MATERIALS AND METHODS ... 7
In Silico Analysis ... 7
Patients and Samples Collection ... 7
Immunohistochemical analysis ... 7
Bladder Cancer Cell Lines Studies ... 9
Protein Extraction and Quantification ... 9
Western Blot ... 10
Immunofluorescence analysis ... 11
M6A Quantification ... 11
METTL14 Gene Knockdown ... 11
Cell Viability and Proliferation Assays ... 11
Apoptosis evaluation ... 12
Wound Healing Assay ... 12
Invasion Assay ... 13
Statistical Analysis ... 13
RESULTS ... 14
In Silico Analysis ... 14
Characterization of METTL3, METTL14, VIRMA, WTAP, ALKBH5, FTO, YTHDF3 and m6A immunoexpression in primary tumours ... 15
Characterization of METTL3, METTL14, VIRMA, WTAP, ALKBH5, FTO and YTHDF3 protein expression in bladder cell lines ... 18
Cellular localization of m6A and regulatory proteins in cell lines ... 18
RNA m6A methylation quantification in cell lines ... 19
CRISPR-Cas9 System in UMUC3... 20
Phenotypic impact of METTL14 in UMUC3 cell line ... 20
DISCUSSION ... 22
CONCLUSION AND FUTURE PRESPECTIVES ... 24
FIGURE INDEX
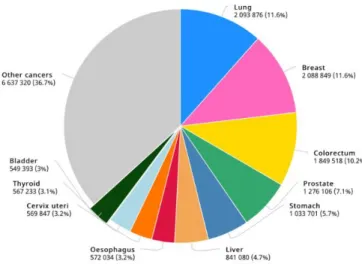
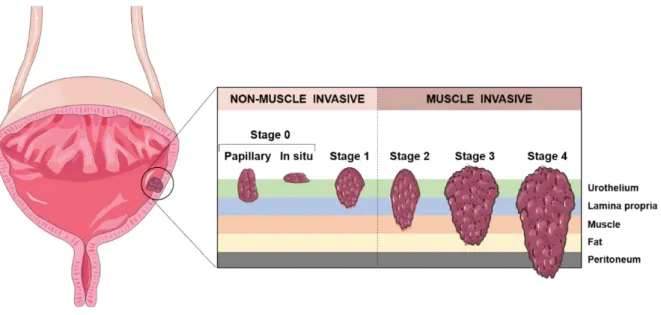
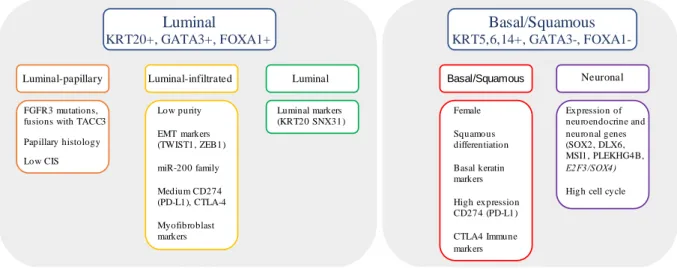
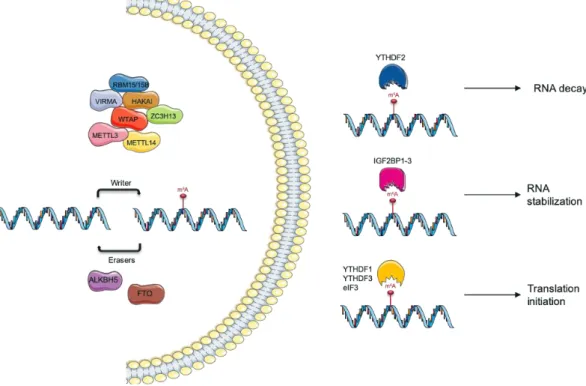
Figure 1. Worldwide Bladder Cancer incidence. Estimated number of new cases in 2018, worldwide, all cancers, both sexes, all ages. Adapted from (1). ... 1 Figure 2. Staging of urothelial carcinoma. Bladder cancer stages are assigned on the basis of tumour invasion through the layers of tissue that constitute the bladder. Adapted from (2). ... 2 Figure 3. Molecular subtype classification based on RNA subtype classification, pathway information, EMT and CIS signatures, and immune infiltrate analyses. Adapted from (14). ... 3 Figure 4. N6-methyladenosine (m6A) modification regulation by “writers”, “erasers” and
“readers”. This modification is a dynamic and reversible process coordinated by a complex consisting of methyltransferases, METTL3/14, WTAP, RBM15/15B, and KIAA1429 (VIRMA); demethylases FTO and ALKBH5 and “reader” proteins that mediate their function. Teixeira, C. unpublished... 4 Figure 5. In silico analysis: frequency of alterations in queried genes in TCGA database. ... 14 Figure 6. Analysis of expression in normal bladder tissue and BC samples (TCGA data, Red box for tumour tissue, n=404; grey box for normal tissue, n=28). Only METTL14 was downregulated in BC. ... 14 Figure 7. Illustrative images of immunostaining for m6A (a), METTL3 (b), METTL14 (c), VIRMA
(d); WTAP (e), ALKBH5 (f), FTO (g) and YTHDF3 (h) in bladder cancer. a Strong (9+) m6A nuclear
immunoexpression in bladder cancer; b Strong (9+) METTL3 nuclear immunoexpression in bladder cancer; c Weak/moderate (6+) METTL14 nuclear immunoexpression in bladder cancer; d Weak/moderate (6+) VIRMA nuclear immunoexpression in bladder cancer; e Strong (9+) WTAP nuclear immunostaining in bladder cancer; f Strong (9+) ALKBH5 nuclear immunostaining in bladder cancer; g Strong (9+) FTO nuclear immunostaining in bladder cancer; h Strong (9+) YTHDF3 cytoplasmic immunoexpression in bladder cancer. ... 16 Figure 8. Characterization of METTL3, METTL14, VIRMA, ALKBH5 and YTHDF3 in normal and bladder cancer tissues by immunohistochemistry. a METTL3 (NMIBC vs MIBC p=0.023; NUT vs NMIBC p=0.005) , b VIRMA (NUT vs NMIBC p=0.003; NUT vs MIBC p=0.006), c METTL14 (NMIBC vs MIBC p=0.049; NUT vs MIBC p=0.003), d ALKBH5 (NUT vs NMIBC p<0.0001; NUT vs MIBC p<0.0001;) and e YTHDF3 (NUT vs NMIBC p=0.003; NUT vs MIBC p=0.006) immunostaining based on h-score (ranges from 0, +1, +2, +3, +4, +6, +9). Qui-square, *p<0.05, **p<0.01, ***p<0.001, ****p<0.0001, ns- non signification. NUT- normal urothelial tumour, NMIBC- non muscle-invasive bladder cancer, MIBC- muscle-invasive bladder cancer. ... 16 Figure 9. Association between METTL3 protein level and pathological stage. Kruskal-Wallis test (p=0.01). ... 17 Figure 10. Characterization of regulatory proteins in bladder cancer cell lines a. METTL3, WTAP, FTO and ALKBH5 protein levels in the same cell lines. b. The expression of METTL14 protein in 7 bladder cancer cell lines in Western blot. SV-HUC1 cell line was used as control. Kruskal-Wallis test. ... 18 Figure 11. Illustrative images of IF for all tested m6A regulatory proteins. Results are compared to
negative control. Photograph taken in microscope Olympus IX51 with a digital camera Olympus XM10 (400x amplification). ... 19 Figure 12. Percentage of m6A in mRNA, using the ELISA m6A. Kruskal-Wallis test. ... 19
Figure 13. Knockdown of METTL14 on the UMUC3 cell line. a. We observed an efficiency in the protein expression of 48% in the condition of 1.5 µl Lipofectamine 3000 and 40% in the condition of 3 µl Lipofectamine 3000. Kruskal-Wallis test, p=0.05. b. Through the colorimetric assay of m6A, we
the condition of 3 µl Lipofectamine 3000 (p=0.0407). Kruskal-Wallis test: *p < 0.05, p=0.0286. Abbreviations: WT- Will type. ... 20 Figure 14. Phenotypic impact METTL14 knockdown in UMUC3 cell line. a. in cell viability b. in BrdU assay c. apoptosis levels after 48 hours (mean ± SD, n = 3) d. cell invasion after 24 hours e. cell migration after 48 hours. Mann–Whitney U‐test: *p < 0.05, **p < 0.01, ***p < 0.001 and ****p < 0.0001 compared to control (WT: UMUC3). Abbreviations: WT- Will Type. ... 21
TABLES INDEX
Table 1. Primary antibodies used in Immunohistochemistry ... 8
Table 2. Clinicopathologic characterization of bladder cell lines ... 9
Table 3. Primary antibodies used in Western blot and Immunofluorescence ... 10
Table 4. Clinicopathological parameters of the bladder cancer patients ... 15
Table 5. Correlation between different regulatory proteins. Spearman's rank correlation coefficient (rho) ... 17
LIST OF ABBREVIATIONS
3ÙTR- 3`untranslated regionsAJCC- American Joint Committee on Cancer ALKBH5- alkB homologue 5
ATCC- American Type Culture Collection BC- Bladder cancer
BCG- Bacillus Calmette-Guérin BSA- Bovine serum albumin BUC- Bladder Urothelial carcinoma Cis- Carcinoma in situ
DAB- 3,3’ – Diaminobenzidine DAPI- 4’,6-diamidino-2-phenylindole DMSO- Dimethyl Sulfoxide
EDTA- Ethylenediamine tetra acetic acid EMT- Epithelial-mesenchymal transition FBS- Fetal Bovine Serum
FFPE- Formalin-fixed and paraffin-embedded FITC- Fluorescein isothiocyanate
FTO- Human obesity-associated ICC- Immunocytochemistry IF- Immunofluorescence IgG- Immunoglobulin G IHC- Immunohistochemistry lncRNA- long non-coding RNA M6A- N6-Methyladenosine
METTL14- Methyltransferase-like protein 14 METTL3- Methyltransferase-like protein 3 MIBC- Muscle invasive bladder cancer MMC- Mitomycin
MMC- Mitomycin C
mRNA- Messenger ribonucleic acids NAC- Neoadjuvant chemotherapy ncRNA- non-coding RNA
NMIBC- non-muscle invasive bladder cancer NUT- Normal urothelial tract
OD- Optical density
PBS- Phosphate buffered saline PBS- Phosphate-buffered saline PFA- Paraformaldehyde PIC- Protein inhibitor cocktail PVDF- Polyvinylidene fluoride
RBM15/15B- RNA-binding motif proteins 15/15B RIPA- Radio immune precipitation assay
RNA- Ribonucleic acid SAM- S-adenosyl-methionine
SDS- Sodium dodecyl sulphate TBS- Tris-buffered saline
TCGA- The Cancer Genome Atlas TRITC- Tetramethyl rhodamine
TURBT- Transurethral resection of bladder tumour UCC- Urothelial cell carcinoma
VIRMA- Virilizer WB- Western blot
WHO- World Health Organization
WTAP- Wilm`s tumour-associated protein YTHDF3- YTH m6A-binding protein 3
ZC3H13- Zinc finger CCCH domain-containing β-ACT- Beta-actin
INTRODUCTION
Bladder cancer (BC) is the tenthmost incident cancer worldwide and the thirteenth leading cause of death from cancer, according to GLOBOCAN 2018 study (Figure 1) (1). In 2018, 549,000 new cases were diagnosed, and it is expected an increase to 900,700 new cases by 2040 (2, 3). BC has higher incidence and mortality rates in males when compared to females in a 3:1 ratio, approximately. Incidence also correlates positively with age. Furthermore, smoking is the strongest risk factor associated with this disease, with an attributable risk of approximately 50%. Chronic urinary tract infections, exposure to aromatic amines and other carcinogenic substances (such as arsenic in the drinking water) are other common BC drivers (4-6).
Most cases of bladder cancer (>90%) arise from the inner lining of the urinary tract (urothelium) and are commonly designated urothelial cell carcinomas (UCCs). The less-common types are squamous cell carcinoma, adenocarcinoma, small-cell carcinoma and sarcoma (4, 7). Bladder cancer is classified in non-muscle invasive BC (NMIBC) and muscle invasive BC (MIBC). NMIBC accounts for approximately 75% of all diagnosed BC. Although these tumours usually do not represent a survival threat, they frequently recur. Moreover, 10-30% of patients with NMIBC progress to MIBC. The former tumours represent about 25% of the cases are clinically more aggressive tumours that can rapidly progress and metastasize (3, 8). NMIBC and MIBC are staged according with the degree of tumour invasion into the bladder wall. Stage 0 carcinomas, which can be papillary (Ta) or in situ (Tis), and are restricted to the urothelium, and stage 1 (T1) carcinomas, which invade the lamina propria, are grouped as NMIBC. Tumours which invade the superficial muscle (stage T2a) or deep muscle (stage T2b), the peri-vesical fat layer (stage T3) and adjacent organs (stage T4), are grouped as MIBC (Figure 2) (9, 10).
Figure 1. Worldwide Bladder Cancer incidence. Estimated number of new cases in 2018, worldwide, all cancers, both
Figure 2. Staging of urothelial carcinoma. Bladder cancer stages are assigned on the basis of tumour invasion through the
layers of tissue that constitute the bladder. Adapted from (11).
At the molecular level, several classifications of BC have been, so far, described, and all of them are partially coincident allowing to distinguish two major molecular subtypes: luminal and basal-like BC (10, 12) . The Lund classification was the first defined in urothelial carcinoma including NMIBC and MIBC. Five tumour classes were defined with different cell adhesion gene signatures and also different genetic mutations (11). Two other molecular classification systems have been described: The Cancer Genome Atlas (TCGA) and MD Anderson Cancer Center, defined according to messenger ribonucleic acids (mRNA) expression profile studies, included MIBC alone. The group at the University of North Carolina assembled a large dataset showing that tumours could be divided into only two groups, luminal and basal, which is currently the established classification (13).
The most comprehensive classification is provided by TCGA in which muscle-invasive bladder cancer are characterized by multiple TCGA analytical platforms from studies on mRNA, long non-coding RNA (ncRNA) and microRNA’s expression, differential epithelial-mesenchymal transition (EMT) status, carcinoma in situ (Cis) scores, histologic features, and survival. The well-known luminal and basal subtypes of BC were stratified into 5 distinct subtypes: luminal-papillary subtype (35%), luminal-infiltrated subtype (19%), luminal subtype (6%), basal-squamous subtype (35%) and neuronal subtype (5%), was recently recognized by others in an independent cohort (Figure 3) (14).
Figure 3. Molecular subtype classification based on RNA subtype classification, pathway information, EMT and CIS
signatures, and immune infiltrate analyses. Adapted from (14).
Haematuria (blood cells in urine) is the most common symptom of BC, although it is also associated with various other benign and malignant causes (15). Among benign causes there are trauma, exercise, urinary tract infections, vascular malformations or prostate hyperplasia. Besides BC, malignant causes of haematuria also include kidney and prostate cancer. Because of that, early detection and diagnosis of BC still constitutes a challenge, although urine cytology is performed in high-risk patients for the investigation of the presence of a bladder tumour. Confirmation of presence of tumour cells is performed by cystoscopy (insertion a flexible or rigid scope through the urethra into to bladder), that allows visualization of the inside of the urinary bladder (5). Through this procedure, a biopsy can also be performed, allowing for cytology confirmation. Although, several new tests have been developed, such as bladder tumour associated antigen, the immunocyte assay, nuclear matrixprotein-22 and the Uro Vysion assay, none of them is commonly used in clinical practice due to relatively low sensitivities and/or specificities and the diagnosis is performed by Cytology and/ or histology (4).
The standard treatment for early-stage BC patients is the transurethral resection of bladder tumour (TURBT), that might be followed by intravesical therapy, either with a chemotherapeutic agent (Mitomycin C - MMC) or immunotherapy (bacillus Calmette-Guérin - BCG). Advanced cancers may require removal of the entire bladder (cystectomy), radiation and/or systemic chemotherapy treatments (11, 16). As the recurrence rate for this type of cancer is very high, some patients have to endure various surgeries through time, increasing their morbidity and also the financial costs related with BC treatment. Therefore, there is an urgent need to understand the mechanisms of bladder cancer progression for the development of new diagnostic and therapeutic strategies. This is of great importance for clinical patient’s management. In the last few years, the number of genomic, epigenomic and epitranscriptomic studies have increased dramatically, mostly due to the rapid improvement of high-throughput DNA sequencing technologies.
C. H. Waddington originally defined the term Epigenetics as the study of "causal mechanisms by which genes of the genotype bring about phenotypic effects” (17). However, this initial definition evolved over time, being less focused on the genotype, and more implicated in a wide variety of biological processes. Thus, the current definition of epigenetics is “the study of heritable changes in gene expression that occur regardless of changes in the primary DNA sequence” (18). The main epigenetic molecular mechanisms are grouped into four main groups: DNA methylation, histone post-translational modifications or chromatin remodelling, histone variants, and ncRNAs regulation (19).
Recently, a new layer of gene expression regulation at the RNA level was identified.
Luminal KRT20+, GATA3+, FOXA1+ Basal/Squamous KRT5,6,14+, GATA3-, FOXA1-Basal/Squamous Neuronal Luminal-papillary FGFR3 mutations, fusions with TACC3 Papillary histology Low CIS Luminal-infiltrated Low purity EMT markers (TWIST1, ZEB1) miR-200 family Medium CD274 (PD-L1), CTLA-4 Myofibroblast markers Luminal Luminal markers (KRT20 SNX31) Female Squamous differentiation Basal keratin markers High expression CD274 (PD-L1) CTLA4 Immune markers Expression of neuroendocrine and neuronal genes (SOX2, DLX6, MSI1, PLEKHG4B, E2F3/SOX4)
molecules, including ncRNA and mRNA (20-22). N6-methyladenosine (m6A), methylation of the
adenosine base at the nitrogen-6 position, is the most abundant internal chemical modification of mRNAs and in long non-coding RNA (lncRNA) in eukaryotes. Its potential in gene expression regulation has been recently explored (22).
This modification occurs preferentially in DRACH sequence (where D denotes A/G/U; R denotes A/G and H denotes A/C/U) (23, 24). The m6A is specifically enriched near the stop codon, in
the 3`untranslated regions (3`-UTR), and within long internal exons, thereby affecting different steps of mRNA’s life, such as transcription, splicing, nuclear export and translation (24). In mammalian cells, this modification is catalysed by the m6A methyltransferase complex (“writers”) and can be removed
by m6A demethylases (“erasers”). There are also proteins that bind directly to the m6A mark and mediate
its function, known as “readers” (Figure 4) (25-27).
The m6A modification is catalysed by the methylase complex composed by the
methyltransferase-like 3 and 14 proteins (METTL3 and METTL14) and their cofactors: Wilm`s tumour-associated protein (WTAP), Virilizer (KIAA1429/VIRMA), RNA-binding motif proteins 15/15B (RBM15/15B), and zinc finger CCCH domain-containing protein 13 (HAKAI and ZC3H13) (28).
METTL3 and METTL14 constitute a heterodimer that induces m6A synergistically. Although
METTL3 was already reported to play a central role in complex stability, data is lacking for METTL14 (28, 29). WTAP is a regulatory subunit required for the nuclear complex, since it positions METTL3 and METTL14 to allow its connection/functionality, and also recruits other factors to the methyltransferase complex (26, 27). VIRMA recruits the methyltransferase core components - METTL3, METTL14 and WTAP - via WTAP in a RNA-independent manner, and rather favours mRNA methylation near the 3`-UTR and stop codon regions (30). The RNA binding protein RBM15 and its
Figure 4. N6-methyladenosine (m6A) modification regulation by “writers”, “erasers” and “readers”. This modification
is a dynamic and reversible process coordinated by a complex consisting of methyltransferases, METTL3/14, WTAP, RBM15/15B, and KIAA1429 (VIRMA); demethylases FTO and ALKBH5 and “reader” proteins that mediate their function. Teixeira, C. unpublished.
homolog RBM15b, preferentially bind to RNA’s U-rich regions, recruiting the m6A complex through
interaction with METTL3 in a WTAP-dependent manner (22).
Furthermore, m6A modification can be demethylated by the human obesity-associated protein
(FTO), which is conserved among eukaryotes and it is one of the RNA demethylases that belongs to the ALK family. AlkB homologue 5 (ALKBH5) is another demethylase that binds to single stranded nucleic acids and therefore differs from the other members of the ALKB protein family (31, 32). These proteins ensure a balanced equilibrium of m6A modification.
The identified “readers” of m6A are YTH domain family proteins. Specifically, YTH m6
A-binding protein 3 (YTHDF3) cooperates with YTHDF1 (promoting translation) and YTHDF2 (promoting mRNA degradation) affecting cytoplasmic metabolism of methylated mRNAs, and translation (33).
Several studies showed that m6ARNA methylation and the associated regulatory proteins are
implicated in cancer, including leukaemia, breast, lung, brain, liver, cervical and endometrial cancer. However, knowledge of the mechanistic network between m6A and BC is rather limited, being necessary
to further investigate the role of this modification in this malignancy. Hence, the deregulation of the main players: METTL3, METTL14, WTAP, VIRMA, FTO, ALKBH5 and YTHDF3 was also investigated.
Aims
The m6A modification and the associated regulatory proteins (METTL3, METTL14, WTAP,
VIRMA, FTO, ALKBH5 and YTHDF3) play critical roles in the pathogenesis of various types of cancers, however, the role of these proteins remains poorly explored in bladder cancer. Thus, studying the role of this modification may uncover mechanisms associated with BC aggressiveness.
Specifically, the following tasks were set:
1. Evaluate m6A, METTL3, METTL14, WTAP, VIRMA, ALKBH5, FTO and YTHDF3
expression in a patient’s cohort of BC patients diagnosed with primary tumour prior to any treatment. Proteins’ s expression was also evaluated in a series of normal bladder tissues. 2. Compare the immunoexpression findings with clinical and pathological features of bladder
cancer patients.
3. Assess m6A RNA methylation expression levels and respective players protein expression and
cellular localization in eight bladder cell lines to molecularly characterize and identify the best in vitro model for further studies.
4. Modulate the most promising m6A regulator using CRISPR-Cas9 system, in order to study its
MATERIALS AND METHODS
In Silico Analysis
To evaluate the expression of m6A writers, erasers and readers, the online platform cBio-Portal
was used for in silico analysis. The Cancer Genome Atlas (http://ca ncergenome.nih.gov) database was selected to determine which subunit may play the crucial role of m6A deregulation in BC.
For this, the online platform cBio-Portal for Cancer Genomics was used (34), with the user-defined entry gene set “METTL3, METTL14, VIRMA, WTAP, ALKBH5, FTO and YTHDF3”.
GEPIA web server was used for analysing the RNA sequencing expression data of bladder tumours and normal samples from the TCGA and GTEx projects using a standard processing pipeline: |log2FC| Cut-off =1 ; p-value cut-off= 0.01 (35).
Patients and Samples Collection
One hundred twenty (sixty of NMIBCs and others sixty of MIBCs) formalin-fixed and paraffin-embedded tissues were collected from the archives of the department of pathology of Portuguese Oncology Institute of Porto.
These samples are representative of primary bladder urothelial carcinomas (BUCs), without any prior treatment, and diagnosed between 1997 and 2005 at Portuguese Oncology Institute- Porto, Portugal.
Additionally, for control purposes, 40 tissue samples of normal urothelial tract (NUT), originating from nephrectomy specimens of patients with kidney cancer.
This study was approved by the ethics committee (Comissão de Ética para a Saúde) of the Portuguese Oncology Institute of Porto (CES-IPO 372/2017).
Clinical files and pathology reports were reviewed. All histological slides (of primary tumours) were reviewed by a pathologist and tumours were reclassified in light of the most recent 2016 World Health Organization (WHO) Classification of Tumours of the Urinary System and Male Genital Organs (36). Staging was performed according to the 8th edition of the American Joint Committee on Cancer
(AJCC) staging manual (37).
Immunohistochemical analysis
Immunohistochemistry (IHC) analysis for m6A modification, m6A writers METTL3,
METTL14, VIRMA and WTAP, erasers ALKBH5 and FTO, and reader YTHDF3 was performed using the NovolinkTM Max Polymer Detection System (Leica Biosystems, Germany). Four μm thick sections
were cut and placed in coated slides. In short, after sections deparaffinization (through xylene) and hydration (through a graded alcohol series), antigen retrieval was accomplished by microwave at 800 W or water bath at 95ºC in specific buffer, depending on the protein studied (Table 1). Then, endogenous peroxidase activity was inhibited with freshly prepared 0.6% hydrogen peroxide solution for 20 minutes, and the unspecific bindings were blocked with horse serum (1:50 dilution) for 20 minutes, at room temperature (RT) in a humidified chamber. Incubation of the primary antibody was performed overnight at 4ºC, at a dilution dependent on the specific antibody (Table 1). Afterwards, slides were washed in tris-buffered saline (TBS) solution with 0.1% Tween 20, and incubated with post primary, followed by polymer (30 minutes each). Slides were therefore washed, developed with 3,3`-Diaminobenzidine tetrahydrocloride chromogen (DAB, Sigma-AldrichTM, Germany) and
diaphanization, slides were mounted in Entellan® (Merck-Millipore, Germany). Appropriate positive controls were used for each antibody and can be consulted in Table 1.
The semi-quantitative analysis of immunoexpression was performed by an experienced pathologist and categorized according intensity (between 0-3) and percentage (between 0-100%, and later categorized between 0-3). The score for intensity was performed as score 0 (absent immunoexpression), score 1+ (immunoexpression less intense that in control tissue), score 2+ (immunoexpression similar to control tissue), score 3+ (immunoexpression more intense that in control tissue). The score for percentage was classified in: score 0 (<1% of immunoreactive cells), score 1+ (<50% of immunoreactive cells), score 2+ (50-75% of immunoreactive cells) and score 3+ (75-100% of immunoreactive cells). The final staining score was calculated by multiplying intensity and percentage score, resulting in a score value ranging from 0 to 9+. Pictures were taken in a microscope Olympus BX41 with digital camera Olympus U-TV0.63XC using Cell A software.
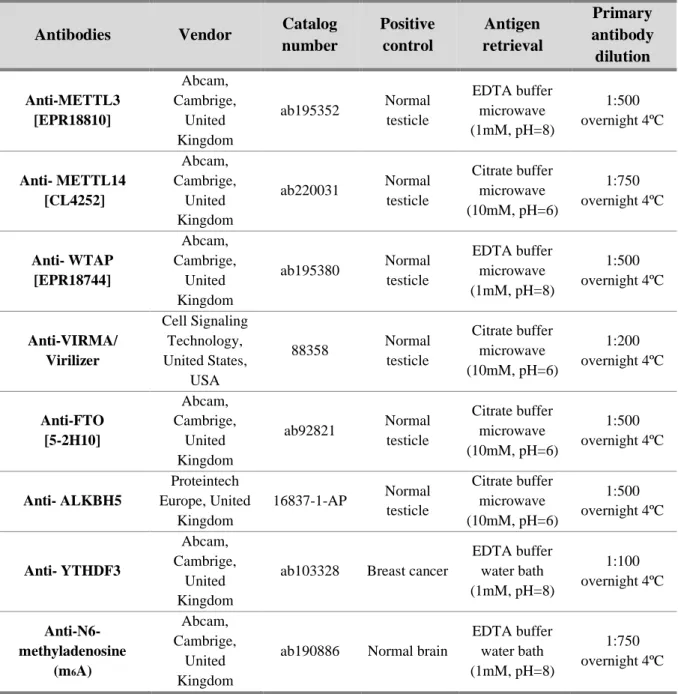
Table 1. Primary antibodies used in Immunohistochemistry
Antibodies Vendor Catalog
number Positive control Antigen retrieval Primary antibody dilution Anti-METTL3 [EPR18810] Abcam, Cambrige, United Kingdom ab195352 Normal testicle EDTA buffer microwave (1mM, pH=8) 1:500 overnight 4ºC Anti- METTL14 [CL4252] Abcam, Cambrige, United Kingdom ab220031 Normal testicle Citrate buffer microwave (10mM, pH=6) 1:750 overnight 4ºC Anti- WTAP [EPR18744] Abcam, Cambrige, United Kingdom ab195380 Normal testicle EDTA buffer microwave (1mM, pH=8) 1:500 overnight 4ºC Anti-VIRMA/ Virilizer Cell Signaling Technology, United States, USA 88358 Normal testicle Citrate buffer microwave (10mM, pH=6) 1:200 overnight 4ºC Anti-FTO [5-2H10] Abcam, Cambrige, United Kingdom ab92821 Normal testicle Citrate buffer microwave (10mM, pH=6) 1:500 overnight 4ºC Anti- ALKBH5 Proteintech Europe, United Kingdom 16837-1-AP Normal testicle Citrate buffer microwave (10mM, pH=6) 1:500 overnight 4ºC Anti- YTHDF3 Abcam, Cambrige, United Kingdom
ab103328 Breast cancer
EDTA buffer water bath (1mM, pH=8) 1:100 overnight 4ºC Anti-N6-methyladenosine (m6A) Abcam, Cambrige, United Kingdom
ab190886 Normal brain
EDTA buffer water bath (1mM, pH=8)
1:750 overnight 4ºC
Bladder Cancer Cell Lines Studies
Seven bladder cancer, MGHU3, RT112, 5637, J82, T24, UMUC3, TCCSUP, and one bladder cell line SV-HUC1 from American Type Culture Collection (ATCC), were used for m6A players’
characterization (Table 2).
All culture media were supplemented with 10% Fetal Bovine Serum (FBS, Biochrom, MERK, Germany) and 1% penicillin/streptomycin (GIBCO®, Invitrogen, USA). Cells were maintained at 37ºC
with 5% CO2 and routinely tested for Mycoplasma sp. contamination using a PCR-based universal
mycoplasma detection kit (PCR Mycoplasm Detection Set, Clontech Laboratories, Oxford, UK). To perform cellular assays, sub-confluent cells were detaching with trypsin at 37oC (Gibco,
Invitrogen). Trypsin was inactivated with media 10% FBS, collected and centrifuged at 1,200 rpm during 5 minutes. Cells were resuspended in fresh medium and 10 μl of cell suspension were collected for cell counting with 10 μl of Trypan Blue in the Neubauer chamber. Cell density was then calculated to the different assays.
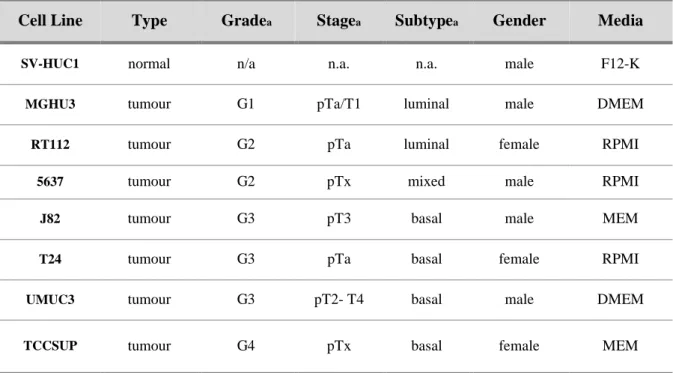
Table 2. Clinicopathologic characterization of bladder cell lines
Cell Line Type Gradea Stagea Subtypea Gender Media
SV-HUC1 normal n/a n.a. n.a. male F12-K
MGHU3 tumour G1 pTa/T1 luminal male DMEM
RT112 tumour G2 pTa luminal female RPMI
5637 tumour G2 pTx mixed male RPMI
J82 tumour G3 pT3 basal male MEM
T24 tumour G3 pTa basal female RPMI
UMUC3 tumour G3 pT2- T4 basal male DMEM
TCCSUP tumour G4 pTx basal female MEM
n.a.- not applicable a- according to (38)
Protein Extraction and Quantification
Total protein was extracted from cells, in triplicates, using the radioimmunoprecipitation assay buffer (RIPA) (Santa Cruz Biotechnology Inc., USA) complemented with 10% of protein inhibitor cocktail (PIC). After 15 minutes in the ice, the samples were centrifuged at 13,000 rpm during 30 minutes at 4ºC and the supernatant was collected.
Subsequently, quantified using a Pierce BCA Protein Assay Kit (Thermo Scientific Inc., USA), according to manufacturer’s instructions.
Western Blot
Briefly, 30 µg of protein from each cell line was resuspended in loading buffer, denatured at 95ºC for 5 minutes, and loaded in 8% polyacrylamide gel where they were separated by size through sodium dodecyl sulphate-polyacrylamide gel electrophoresis (SDS-PAGE) at 120 V for RT. Then, proteins were transferred to 0.2 μm polyvinylidene fluoride (PVDF) membranes (Bio-Rad Laboratories Inc., Hercules, CA, USA) using 25 mM Tris-base/glycine buffer and a Trans-Blot Turbo Transfer system (Bio-Rad) at 25 V and 1.3 mA for 15 minutes. After that, membranes were blocked with 5% bovine serum albumin (BSA; Santa Cruz, USA) or 5% dry milk in TBS with 0.1% Tween (TBS-T, pH=7.6), and then incubated with primary antibody (Table 3). After incubation, membranes were incubated with secondary antibody coupled with horseradish peroxidase (Bio-Rad, USA), for 1 hour at RT. To ascertain equal loading of protein, the membranes were incubated with an endogenous control antibody. Quantification was performed using band densitometry analysis from the ImageJ software (version 1.6.1, National Institutes of Health), by comparing the specific protein band intensity with the loading control beta-actin (β-ACT).
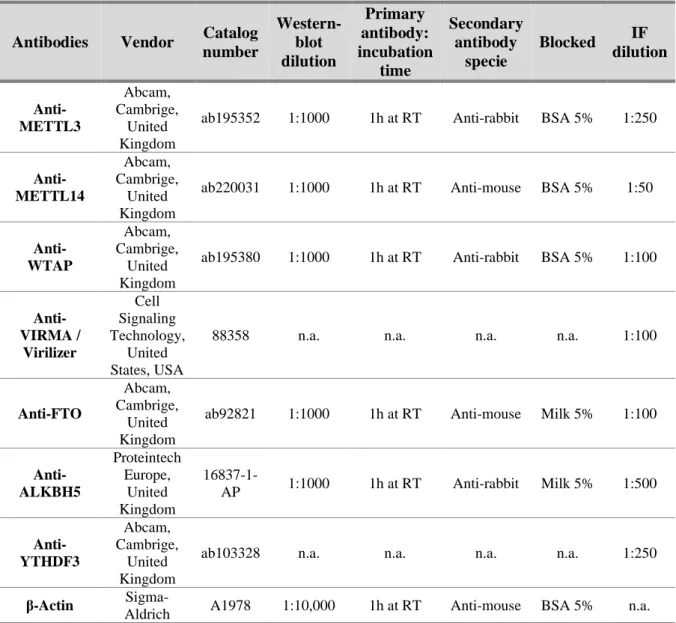
Table 3. Primary antibodies used in Western blot and Immunofluorescence
Antibodies Vendor Catalog number Western-blot dilution Primary antibody: incubation time Secondary antibody specie Blocked IF dilution Anti-METTL3 Abcam, Cambrige, United Kingdom
ab195352 1:1000 1h at RT Anti-rabbit BSA 5% 1:250
Anti- METTL14 Abcam, Cambrige, United Kingdom
ab220031 1:1000 1h at RT Anti-mouse BSA 5% 1:50
Anti- WTAP Abcam, Cambrige, United Kingdom
ab195380 1:1000 1h at RT Anti-rabbit BSA 5% 1:100
Anti-VIRMA / Virilizer Cell Signaling Technology, United States, USA
88358 n.a. n.a. n.a. n.a. 1:100
Anti-FTO
Abcam, Cambrige,
United Kingdom
ab92821 1:1000 1h at RT Anti-mouse Milk 5% 1:100
Anti- ALKBH5 Proteintech Europe, United Kingdom 16837-1-AP 1:1000 1h at RT Anti-rabbit Milk 5% 1:500 Anti- YTHDF3 Abcam, Cambrige, United Kingdom
ab103328 n.a. n.a. n.a. n.a. 1:250
β-Actin
Sigma-Aldrich A1978 1:10,000 1h at RT Anti-mouse BSA 5% n.a. n.a. – not applicable; RT – room temperature
Immunofluorescence analysis
M6A, METTL3, METTL14, VIRMA, WTAP, ALKBH5, FTO and YTHDF3 protein expression
and cellular localization assessed by immunofluorescence (IF). Cells were seeded in coverslips in 24-well plates at 25,000 cells/24-well previously optimized concentration and allowed to adhere at 37ºC, 5% CO2 overnight. In the next day, cells were fixed 4% paraformaldehyde (PFA) for 10 minutes and
permeabilized with 0.25% Triton X-100 solution in phosphate-buffer saline (PBS) for 15 minutes. After that, cells were blocked with 5% BSA for 30 minutes, followed by primary antibody incubation at specific dilution (Table 3), overnight at RT.
Following primary antibody, cells were incubated with secondary antibody anti-rabbit immunoglobulin G (IgG) (Alexa FluorTM 488 goat, A11008; Invitrogen, USA) or anti-mouse IgG-
fluorescein isothiocyanate (FTIC goat SLB4878, Sigma-AldrichTM) for 1 hour, at RT (Table 4). Then,
nuclear stained was performed with 4’,6- diamidino-2-phenylindole (DAPI) (AR1176, BOSTER Biological Technologies, China) in mounting medium. Pictures were taken in fluorescence microscope Olympus IX51 with a digital camera Olympus XM10 using CellSens software (Olympus, Japan) (400x magnification).
M
6A Quantification
RNA was extracted from cell lines by TripleXtractor (GRiSP, Portugal) according to manufacturer’s recommend protocol. To detect m6A levels, m6A RNA Methylation Quantification Kit
(ab185912; Abcam) was used as the recommended. In this assay, the m6A is detected using capture and
detection antibodies. The detected signal is enhanced and then quantified using colorimetric methodology by reading the absorbance in a microplate spectrophotometer. The amount of m6A is
proportional to the optical density (OD) intensity measured.
METTL14 Gene Knockdown
After protein analysis by Western blot, UMUC3 cell line was chosen to perform METTL14 gene knockdown by plasmids carrying the CRISPR-Cas9 system containing a guide RNA sequence targeting METTL14 (GenScript, Piscataway, NJ). For plasmid transfection, Lipofectamine® 3000
reagent (Invitrogen, USA) was used according to manufacture instructions, followed by selection of cells which incorporated the CRISPR-Cas9 system with 1μg of puromycin for each 1mL of DMEM cell culture medium (Sigma).
After selection, cells were expanded, and total protein was extracted in order to confirm METTL14 protein downregulation. UMUC3 will type cells were used as controls for Western blot analysis.
Cell Viability and Proliferation Assays
The effects on cell viability was assessed by MTT assay (Sigma-Aldrich, Germany). Viable cells incorporate MTT solution and the mitochondrial enzyme succinate-dehydrogenase convert them into a purple coloured formazan product.
Cell proliferation was measured by using the Cell Proliferation ELISA BrdU assay (Roche Applied Sciences), based on DNA synthesis analysis. This is a colorimetric immunoassay where 5-bromo-2’-deoxyuridine (BrdU), a pyrimidine analogous, is incorporated in placed of pyrimidine into
the newly synthesized DNA. The quantity of BrdU incorporated into cells is directly correlated to the number of proliferating cells.
Cells were plated into 96 well plates in complete DMEM Medium at density of 6,000 cells/well and incubated overnight, at 37ºC in 5% CO2. Then, cells were maintained with DMEM 1% FBS, from
0 hours until 48 hours.
In MTT assay, the culture medium was removed, and cells were incubated during 1 hour at 37oC
with 5 μg/mL MTT solution in complete culture medium. After that, formazan crystals formed were dissolved in dimethyl sulfoxide (DMSO) and spectrophotometric measurement was done at 540nm (reference wavelength: 655 nm) in a microplate reader (Fluostar Omega, BMG Labtech, Germany). DMSO was used as blanks to correct the OD values, and OD obtained for 48 hours was normalized for the 0 hours’ time point.
For BrdU assay, cells were incubated with 20 μM BrdU labelling solution for 12 hours. After removing labelling medium, cells were fixed for 30 minutes at room temperature with FixDenat solution. This solution induces DNA denaturation necessary to allow conjugated antibody binding to the incorporated BrdU. Then, FixDenat was removed, and anti-BrdU-POD antibody (dilution 1:100) was added to detect the incorporated BrdU in DNA. After 90 minutes, at room temperature, the antibody was removed, and cells were rinsed 3 times with 1X PBS. The immune complex formed was detected by adding 100 μl/well of substrate solution and incubated for 5-10 minutes, until colour development. Then, the reaction was stopped with 1 M H2SO4 added to each well, and the reaction product was
quantified in a microplate reader (Fluostar Omega, BMG Labtech, Germany) by measuring absorbance at 450 nm (reference wavelength: 690 nm). The OD values obtained for 48 hours was normalized for the 0 hours` time point.
The results represent the mean of three independent experiments, each one in triplicate, and were analysed using a GraphPad Software.
Apoptosis evaluation
In order to complement cell behaviour studies, apoptosis assay were performed. Briefly, 4x10⁴
cell/well of cells were seeded on 24-well plates and incubated during 48 hours at 37ºC and 5% CO2.
After 48 hours, the Cell-APOPercentageTM apoptosis assay kit (Biocolor, United Kingdom) were
performed according the manufacturing instructions. Then, cells were incubated with 300 μl/well of APOPercentageTM dye solution at ratio 1:20 respectively, during 30 minutes at 37ºC. Next, cells were
washed with PBS 1X and detached from well plate with TrypLeTM Express (GBICO, Invitrogen, USA)
at 37ºC. After that, APOPercentageTM dye release reagent was added and plate were vigorously agitated
during 15 minutes, following colorimetric measurement at 550 nm with 620 nm reference filter (Fluostar Omega, BMG Labtech, Offenburg, Germany). The H2O2 was used as a positive control. The OD
obtained for apoptosis assay was normalized for the OD obtained by viability assay at the same time point.
Wound Healing Assay
The wound-healing assay is one of the earliest developed methods to study directional cell migration in vitro and, mimics cell migration during wound healing in vivo.
Cells were seeded (6-well plate) in complete DMEM Medium at an optimal density to obtain at least 95% of confluence in the next 24 hours, and incubated at 37ºC, 5% CO2. In the next day, the culture
wound and incubated with complete cell medium (DMEM 1% FBS). The wound areas were photographed in two specific sites at 40x magnification using an Olympus IX51 inverted microscope equipped with an Olympus XM10 Digital Camera System. The photos were taken at regular time points (between 0 and 48 hours) until wound closure. The relative migration distance (5 measures by wound) was calculated with the following formula: relative migration distance (%) = (A–B)/C x100, where A is the width of cell wound at 0 hours incubation, B is the width of cell wound after specific hours of incubation, and C is the width mean of cell wound for 0 hours of incubation. For relative migration distance, the results were analysed using the beWound - Cell Migration Tool (Version 1.5) (developed by A.H.J. Moreira, S. Queirós and J.L. Vilaça, Biomedical Engineering Solutions Research Group, Life and Health Sciences Research Institute - University of Minho; available at http://www.besurg.com/sites/default/files/beWoundApp.zip). At least three independent experiments were performed.
Invasion Assay
Cell invasion was evaluated by using 24-well BD BioCoat Matrigel Invasion Chambers, with 8μm pore size membranes (BD BioSciences, USA). These invasion chambers allow to compare the in vitro cells invasive behaviour in specific conditions. Invasive cells are able to detach themselves and invade through the Matrigel Matrix. On the order hand, the thin layer of Matrigel Matrix mimics a basal membrane that occludes the pores of the membrane, blocking non-invasive cells from migrating through the membrane.
After BD Matrigel Chambers rehydration between 30 minutes and 2 hours with serum free culture media at 37ºC, cells at a density of 30,000 cells/insert were seeded in complete culture medium supplemented with 1% FBS and incubated during 24 hours at 37ºC in 5% CO2. Then, the non-invading
cells were removed by with swab and invaded cells were methanol fixed, DAPI stained and counted in a fluorescence microscope Olympus IX51 with a digital camera Olympus XM10 using CellSens software. The invasion was calculated as % of cell invasion normalized for the control condition.
Statistical Analysis
Statistical analysis was performed using the GraphPad Prim 7.0 software (GraphPad Software Inc., Chicago IL, USA) and IBM® SPSS® Statistic software version 23 (IBM-SPSS Inc., La Jolla, CA;
USA). Significance level was set at p<0.05. Non-parametric Mann-Whitney U test were used to compare two groups. For comparison between three or more groups, non-parametric Kruskal-Wallis test was used, followed by Mann-Whitney U test for pairwise comparisons and Bonferroni’s correction, when applicable. Differences in METTL3, METTL14, VIRMA, WTAP, ALKBH5, FTO, YTHDF3 and m6A
immunoexpression between normal urothelial tract and BUCs tissues was assessed by Chi-square or Fisher’s exact test. Correlation between continuous variables was assessed with Spearman’s (rs) non-parametric correlation test.
P-values were considered statistically significant when inferior to 0.05. Significance is shown vs. the respective control and depicted as follows: *p ≤ 0.05, **p < 0.01, ***p < 0.001, ****p < 0.0001 and nsp> 0.05 (non-significant).
RESULTS
In Silico Analysis
We first aimed to characterize the expression of m6A regulatory proteins using available data at
the online platform cBio-Portal for Cancer Genomics was used (34), with the user-defined entry gene set “METTL3, METTL14, VIRMA, WTAP, ALKBH5, FTO and YTHDF3”.
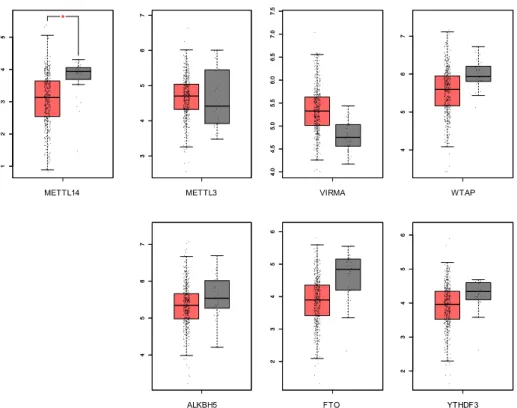
The database includes tumours samples of 413 patients with MIBC although node negative. Seventy-four % were male whereas 26% were females with a median age at diagnosis of 61 years (Figure 5).
Figure 5. In silico analysis: frequency of alterations in queried genes in TCGA database.
In silico analysis showed that m6A players displayed different molecular alterations in MIBC.
From all the known RNA-modification enzymes related with m6A modifications, VIRMA was the most
frequently altered gene in these tumours. Furthermore, only METTL14 mRNA expression was significantly downregulated in bladder cancer compared to the normal bladder tissue (Figure 6).
Since, no data is available for NMIBC and validation is lacking for MIBC, these genes were studied in a patient’s cohort of IPOPorto.
Characterization of METTL3, METTL14, VIRMA, WTAP, ALKBH5, FTO, YTHDF3
and m
6A immunoexpression in primary tumours
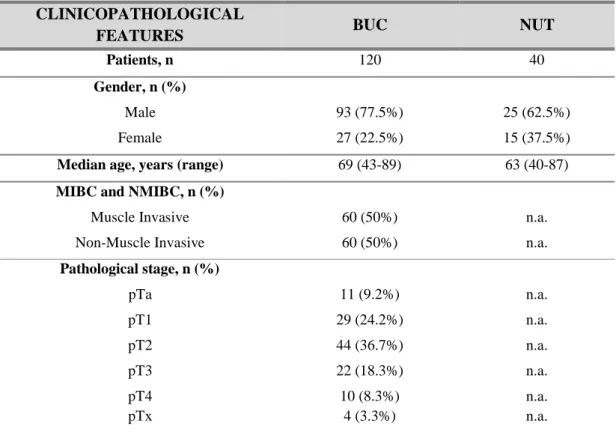
Immunohistochemistry assay was performed to evaluate proteins` expression in IPOPorto bladder tissues. For this, a total of 120 patients, comprising 60 (50%) NMIBC and 60 (50%) MIBC were included in this study. Additionally, normal urothelial obtained from 40 renal cell carcinoma patients submitted to nephrectomy without urothelial cancer was also analysed (Table 4).
Table 4. Clinicopathological parameters of the bladder cancer patients
CLINICOPATHOLOGICAL
FEATURES BUC NUT
Patients, n 120 40
Gender, n (%)
Male 93 (77.5%) 25 (62.5%)
Female 27 (22.5%) 15 (37.5%)
Median age, years (range) 69 (43-89) 63 (40-87)
MIBC and NMIBC, n (%)
Muscle Invasive 60 (50%) n.a.
Non-Muscle Invasive 60 (50%) n.a.
Pathological stage, n (%) pTa 11 (9.2%) n.a. pT1 29 (24.2%) n.a. pT2 44 (36.7%) n.a. pT3 22 (18.3%) n.a. pT4 10 (8.3%) n.a. pTx 4 (3.3%) n.a.
BUC: bladder urothelial carcinomas; NUT: normal urothelial tract
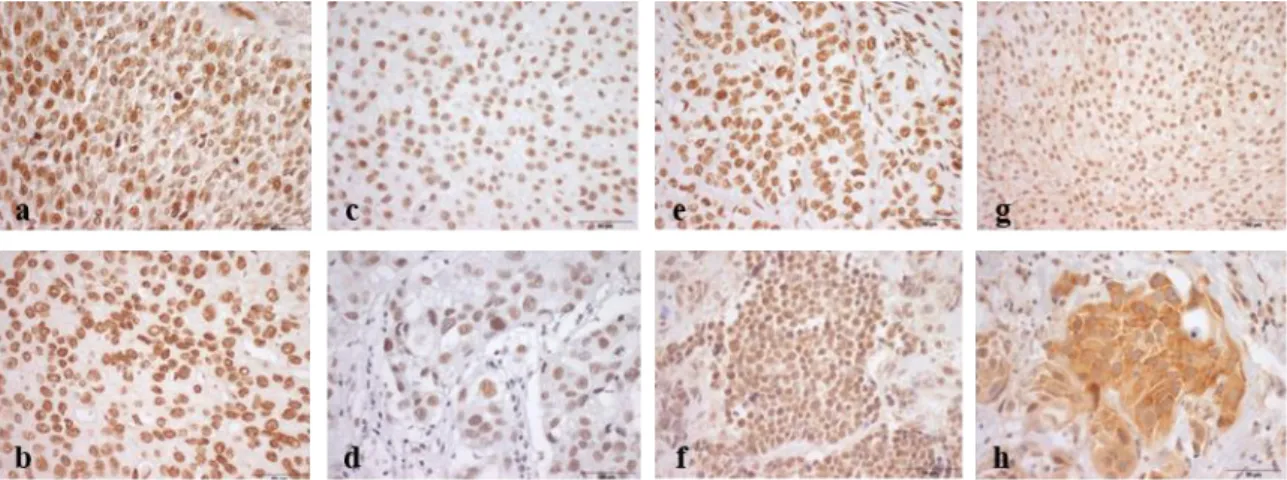
Nuclear expression was observed for all tested proteins, excepting for the “reader” YTHDF3, which exclusively showed a cytoplasmic expression (Figure 7).
Figure 7. Illustrative images of immunostaining for m6A (a), METTL3 (b), METTL14 (c), VIRMA (d); WTAP (e),
ALKBH5 (f), FTO (g) and YTHDF3 (h) in bladder cancer. a Strong (9+) m6A nuclear immunoexpression in bladder cancer; b
Strong (9+) METTL3 nuclear immunoexpression in bladder cancer; c Weak/moderate (6+) METTL14 nuclear immunoexpression in bladder cancer; d Weak/moderate (6+) VIRMA nuclear immunoexpression in bladder cancer; e Strong (9+) WTAP nuclear immunostaining in bladder cancer; f Strong (9+) ALKBH5 nuclear immunostaining in bladder cancer; g Strong (9+) FTO nuclear immunostaining in bladder cancer; h Strong (9+) YTHDF3 cytoplasmic immunoexpression in bladder cancer.
Overall, METTL3, METTL14, VIRMA, ALKBH5 and YTHDF3 immunoexpression differed significantly between tumour and normal tissues. Specifically, METTL3 (p=0.0030), METTL14 (p=0.0019), VIRMA (p=0.0081), ALKBH5 (p<0.0001) and YTHDF3 (p=0.0107) showed significantly lower expression in bladder cancer compared with normal tissues. Moreover, METTL3 and METTL14 (heterodimeric catalytic core) showed a significant reduction in muscle invasive tumours comparing with NMIBC (p=0.0227 and p=0.0489, respectively) (Figure 8). Nonetheless, no significant differences were apparent regarding m6A, WTAP and FTO expression among the three studied groups.
Figure 8. Characterization of METTL3, METTL14, VIRMA, ALKBH5 and YTHDF3 in normal and bladder cancer tissues by immunohistochemistry. a METTL3 (NMIBC vs MIBC p=0.023; NUT vs NMIBC p=0.005) , b VIRMA (NUT vs
NMIBC p=0.003; NUT vs MIBC p=0.006), c METTL14 (NMIBC vs MIBC p=0.049; NUT vs MIBC p=0.003), d ALKBH5 (NUT vs NMIBC p<0.0001; NUT vs MIBC p<0.0001;) and e YTHDF3 (NUT vs NMIBC p=0.003; NUT vs MIBC p=0.006) immunostaining based on h-score (ranges from 0, +1, +2, +3, +4, +6, +9). Qui-square, *p<0.05, **p<0.01, ***p<0.001, ****p<0.0001, ns- non signification. NUT- normal urothelial tumour, NMIBC- non muscle-invasive bladder cancer, MIBC-
(n=60) (n= 60) (n= 40) a b c (n=60) (n=60) (n=40) (n=40) (n= 60) (n=60) (n=60) (n= 60) (n= 40) d e (n=60) (n=60) (n=40)
NUT NMIBC MIBC 0 20 40 60 80 100 ALKBH5 % o f ca se s 0 1 2 3 4 6 9 **** **** ns NUT NMIBC MIBC 0 20 40 60 80 100 METTL3 % o f ca se s 1 3 6 9 ** * ns
NUT NMIBC MIBC 0 20 40 60 80 100 % o f ca se s METTL14 0 1 2 3 4 6 9 *** * ns
NUT NMIBC MIBC 0 20 40 60 80 100 VIRMA % o f ca se s 0 1 2 3 4 6 9 ** ** ns
NUT NMIBC MIBC 0 20 40 60 80 100 % o f ca se s YTHDF3 2 3 6 9 ** ** ns
The expression of the reader (YTHDF3) and all studied writers positively correlated with m6A
expression in tumour samples. The same was observed regarding ALKBH5 eraser expression. Interestingly, correlations were also observed between writers and erasers’ expression, excepting for WTAP and both the erasers, as well as for VIRMA and FTO. Nonetheless, no correlation was found among the erasers’ expression (Table 5).
Table 5. Correlation between different regulatory proteins. Spearman's rank correlation coefficient (rho)
m6A METTL3 METTL14 VIRMA WTAP FTO ALKBH5 YTHDF3
m6A - p= 0.001 R= 0.488 p< 0.0001 R= 0.306 p= 0.015 R= 0.223 p= 0.035 R= 0.194 p= 0.081 R=0.162 p= 0.014 R=0.225 p= 0.003 R=0.269 METTL3 - - p< 0.0001 R= 0.435 p<0.0001 R= 0.343 p<0.0001 R= 0.415 p= 0.014 R=0.014 p= 0.001 R= 0.294 p<0.0001 R= 0.374 METTL14 - - - p<0.0001 R= 0.373 p= 0.008 R= 0.243 p= 0.066 R=0.169 p<0.0001 R= 0.458 p<0.0001 R= 0.384 VIRMA - - - - p= 0.001 R= 0.289 p= 0.309 R=0.094 p<0.0001 R= 0.416 p= 0.011 R= 0.237 WTAP - - - p= 0.342 R=0.089 p= 0.131 R= 0.140 p= 0.043 R= 0.192 FTO - - - p= 0.869 R=-0.015 p= 0.063 R= 0.175 ALKBH5 - - - p= 0.097 R= 0.156
We evaluation the association between the expression of the m6A regulatory proteins with
clinicopathological parameters of the bladder cancer patients.
No significant differences were found for any of the tested proteins expression and patients smoking habits, gender and age of diagnosis. Nonetheless, a significant association was found between METTL3 expression and pathological stage. Indeed, decreased METTL3 expression was displayed by advanced disease (Figure 9).
Figure 9. Association between METTL3 protein level and pathological stage. Kruskal-Wallis test (p=0.01).
pTa pT1 pT2 pT3 pT4 0 20 40 60 80 100 % o f ca se s METTL3 1 3 6 9
Characterization of METTL3, METTL14, VIRMA, WTAP, ALKBH5, FTO and
YTHDF3 protein expression in bladder cell lines
Western blot was performed to evaluate proteins` expression in bladder cell lines.
No differences were apparent for m6A regulatory proteins’ expression among the tested cell
lines, except for METTL14 (Figure 10a). Specifically, all BC cell lines presented heterogenous levels of this writer comparing with normal cell line. Among the tumour cells, UMUC3 showed the highest METTL14 expression (Figure 10b).
Figure 10. Characterization of regulatory proteins in bladder cancer cell lines a. METTL3, WTAP, FTO and ALKBH5
protein levels in the same cell lines. b. The expression of METTL14 protein in 7 bladder cancer cell lines in Western blot. SV-HUC1 cell line was used as control. Kruskal-Wallis test.
Cellular localization of m
6A and regulatory proteins in cell lines
Immunofluorescence was performed in order to verify cellular localization.
Overall, all writers and erasers were located in the nucleus of all cell lines, whereas the reader was found in the cytoplasm (Figure 11), which is in accordance with the observations in primary tumours by IHC. a b β-actin 42KDa WTAP 50KDa METTL3 75KDa ALKBH5 45KDa FTO 58KDa SVH UC MGHURT1 12 5637 J82 T24 UMU C3 TCCS UP 0 20 40 60 80 100 METTL14 P ro te in le ve ls 65KDa Basal Luminal
Normal Normal Basal Luminal
SV-H UC1 MG HU3 RT1 12 5637 J82 T24 UMU C3 TCCS UP 0.0 0.5 1.0 1.5 2.0 METTL3 P ro te in le ve ls SV-H UC1 MGHU 3 RT1 12 5637 J82 T24 UMU C3 TCCS UP 0.0 0.5 1.0 1.5 2.0 METTL3 P ro te in le ve ls
Figure 11. Illustrative images of IF for all tested m6A regulatory proteins. Results are compared to negative control.
Photograph taken in microscope Olympus IX51 with a digital camera Olympus XM10 (400x amplification).
RNA m
6A methylation quantification in cell lines
The m6A quantification was performed for assess RNA methylation expression levels.
Overall, bladder cancer cells exhibited higher RNA m6A methylation percentage comparing
with normal cells, although no statistically significant difference was found. Indeed, the highest % was observed in 5637, T24 and UMUC3, with 47%, 29% and 52%, respectively (Figure 12).
Figure 12. Percentage of mA in mRNA, using the ELISA mA. Kruskal-Wallis test.
SV -H U C 1 J8 2 M G H U 3 T2 4 SV -H U C 1 M G H U 3 R T1 1 2 T2 4 m6A
ALKBH5 FTO WTAP
M G H U 3 U M U C 3 METTL3 M G H U 3 U M U C 3 VIRMA SV -H U C 1 TC C SU P YTHDF3 SV-H UC1 MGH U3 RT11 2 5637 J82 T24 UMUC 3 TCCS UP 0.00 0.02 0.04 0.06 0.08 m6A % m 6A o f m R N A