1 Nitrogen uptake and internal recycling in Zostera marina exposed to oyster
1
farming: eelgrass potential as a natural biofilter 2
3
Estuaries and Coasts 39: 1694, doi: 10.1007/s12237-016-0102-4 (2016) 4
5
Jose Sandoval-Gil1, Ana Alexandre2, Rui Santos2, Víctor F. Camacho-Ibar*1 6
7
1Instituto de Investigaciones Oceanológicas (IIO), Universidad Autónoma de Baja
8
California (UABC), Carretera Transpeninsular Ensenada-Tijuana No. 3917, Frac. 9
Playitas, Ensenada, B.C. 22860, México. 10
2 Marine Plant Ecology Research Group, Centre of Marine Sciences (CCMAR),
11
Faculdade de Ciências e Tecnologia, Universidade do Algarve, Gambelas, Faro, 12
Portugal. 13
*Corresponding author: Víctor F. Camacho-Ibar, phone: 152(646)174-4601 ext-162, 14
email: [email protected] 15
16 17
Keywords: eelgrass, oyster aquaculture, ammonium uptake, nitrogen recycling, stable 18 isotopes, biofilter 19 20 21 22 23 24 25
2 Abstract
26
Oyster farming in estuaries and coastal lagoons frequently overlaps with the distribution 27
of seagrass meadows, yet there are few studies on how it/this aquaculture practice 28
affects seagrass physiology. We compared in situ nitrogen uptake and the productivity 29
of Zostera marina shoots growing near/alongside off-bottom longlines and at a site not 30
affected by oyster farming in San Quintín Bay, a coastal lagoon in Baja California, 31
Mexico. We used benthic chambers to measure leaf NH4+ uptake capacities by
pulse-32
labeling with 15NH4+, and plant photosynthesis and respiration. The internal 15N
33
resorption/recycling was measured in shoots two weeks after incubations. The natural 34
isotopic composition of eelgrass tissues and vegetative descriptors were also examined. 35
Plants growing at the oyster farming site showed a higher leaf NH4+ uptake rate (33.1
36
mmol NH4+ m–2 day–1) relative to those not exposed to oyster cultures (25.6 mmol NH4+
37
m–2 day–1). We calculated that an eelgrass meadow of 15–16 ha (which represents only 38
about 3–4% of the subtidal eelgrass meadow cover in the western arm of the lagoon) 39
can potentially incorporate the total amount of NH4+ excreted by oysters (~5.2 × 10⁶
40
mmol NH4+ day–1). This highlights the potential of eelgrass to act as a natural biofilter
41
for the NH4+ produced by oyster farming. Shoots exposed to oysters were more efficient
42
in re-utilizing the internal 15N into the growth of new leaf tissues or to translocate it to 43
belowground tissues. Photosynthetic rates were greater in shoots exposed to oysters, 44
which is consistent with higher NH4+ uptake and more positive δ13C values. Vegetative
45
production (shoot size, leaf growth) was also higher in these shoots. 46
Aboveground:belowground biomass ratio was lower in eelgrass beds not directly 47
influenced by oyster farms, likely related to the higher investment in belowground 48
biomass to incorporate sedimentary nutrients. 49
3 Introduction
51 52
Aquaculture is a growing activity but its potential impacts on adjacent marine habitats, 53
especially on seagrass-dominated ecosystems, are not well known (Pillay 2004; Ruiz et 54
al. 2010). Seagrass meadows are amongst the most productive communities in coastal 55
marine habitats, providing valuable ecological and socio-economic functions and 56
services to coastal ecosystems (Green and Short 2003; Fourqurean et al. 2012). 57
Aquaculture activities, such as oyster farming, often overlap with the distribution of 58
seagrass meadows in estuaries and coastal lagoons (Everett et al. 1995; Simenstad and 59
Fresh 1995). The effects of oyster farming on seagrasses have been investigated, 60
particularly on the temperate species Zostera marina L. (Everett et al. 1995; Simenstad 61
and Fresh 1995). Effects may include a decrease in growth, density and recruitment of 62
plants, depending on the farming practice employed (e.g. on- versus off-bottom 63
cultures), the effect of farming structures on the hydrology, sedimentation and shading 64
of the meadows, the degree of physical disturbance during oyster placement and 65
harvest, and the accumulation of oyster biodeposits (Everett et al. 1995; Wisehart et al. 66
2007; Tallis et al. 2009; Wagner et al. 2012; Skinner et al. 2014). 67
Nutrient inputs from bivalve excretion may have positive and negative effects on 68
seagrasses (Reush et al. 1994; Vinther and Holmer 2008). Peterson and Heck (2001a, b) 69
demonstrated through manipulative experiments that nutrient enrichment of the 70
substrate caused by biodeposits of a suspension-feeding mussel can lead to an increase 71
in biomass productivity of Thalassia testudinum. Reusch et al. (1994) also found a 72
positive relation between ammonium concentration in sediment pore water originating 73
from mussel biodeposition and the size of eelgrasses. On the other hand, biodeposit 74
accumulation can lead to eelgrass metabolic toxicity due to an increase in sulfate 75
4 reduction rates and a consequent increase of sulfide in sediments (Vinther and Holmer 76
2008). Increased ammonium concentrations in the water column may result in large 77
epiphyte loads on eelgrass leaves, affecting eelgrass performance probably due to a 78
decrease in the incident irradiance on the leaves (Vinther and Holmer 2008; Vinther et 79
al. 2008). 80
Seagrasses take up dissolved inorganic nitrogen (DIN: NH4+ and NO3–) from the water
81
column and from sediment pore water (Touchette and Burkholder 2000; McGlathery 82
2008); they also take up organic nitrogen (urea, amino acids and peptides) as a 83
complementary nitrogen (N) source (Vonk et al. 2008; Alexandre et al. 2015). N 84
acquisition by seagrasses is mainly regulated by uptake kinetic properties of leaves and 85
roots (i.e. maximum uptake rates, Vmax, and affinity, α, for DIN sources; Touchette and
86
Burkholder 2000; Alexandre et al. 2011), which, in turn, can vary within and among 87
seagrass species depending on a variety of natural factors that determine DIN 88
availability (e.g. seasonal and local factors regulating external DIN pools, nutrient 89
diffusion limits, type of substrate; Maier and Pregnall 1990; Stapel et al. 1996; Terrados 90
and Williams 1997; Lee and Dunton 1999; Hasegawa et al. 2005). 91
Ammonium, which is directly excreted by bivalves or produced by the remineralization 92
of their biodeposits (Newell et al. 2005; Hoellein and Zarnoch 2014), is the preferential 93
DIN source for seagrasses (Alexandre et al. 2011 and references therein). Therefore, 94
seagrasses may act as biofilters buffering the excess nutrient loading from oyster 95
farming (and other aquaculture practices) by increasing their productivity and retaining 96
N in belowground tissues (McGlathery et al. 2007). This biofiltering capacity has been 97
widely demonstrated in seaweeds and halophytic plants, and has been applied in 98
economic activities such as Integrated Multi-Trophic Aquaculture (Neori 2008; 99
Buhmann and Papenbrock 2013). To the best of our knowledge, the potential of 100
5 seagrasses as biofilters of aquaculture-derived DIN has not been addressed. Seagrasses 101
may be more efficient biofilters than macroalgae because they can acquire DIN not only 102
from the water column but also from the substrate through their roots. In addition, 103
seagrass tissues exhibit longer retention of nutrients over time and decompose slowly in 104
sediments (McGlathery et al. 2007 and references therein). 105
The incorporation of DIN by seagrasses may depend on photosynthesis, since N 106
assimilation can be limited by the availability of carbon skeletons of photosynthates 107
required for such assimilation (Invers et al. 2004). The internal recycling of N within 108
the shoot or within the plant clonal structure involves processes such as nutrient 109
resorption from senescent tissues and nutrient translocation among ramets, which can 110
limit the dependence on external DIN to sustain the N required for plant growth 111
(Hemminga et al. 1999; Lepoint et al. 2002). Therefore, integrative studies involving 112
physiological and vegetative responses of seagrasses exposed to bivalve aquaculture are 113
needed for an in-depth understanding of the interaction between aquaculture practices 114
and seagrass habitats. Furthermore, these studies could provide valuable insights for the 115
assessment of the ecological status, management and restoration of seagrass habitats 116
exposed to shellfish farming, and to elucidate their role as ‘coastal filters’ under 117
potential conditions of N loading from such activity (McGlathery et al. 2007; Tallis et 118
al. 2009; Buzzelli et al. 2015; Forde et al. 2015). 119
In this study we investigate the potential of the seagrass Z. marina as a biofilter of the 120
DIN (i.e. ammonium) released by oyster farming, by comparing the NH4+ uptake rates
121
of shoots growing near oyster racks with those of shoots not directly affected by oyster 122
farming. To this end, we quantified in situ leaf ammonium uptake rates by pulse-123
labeling with 15N in benthic chambers. Among other vegetative descriptors, we 124
measured eelgrass biomass to estimate the capacity of eelgrass meadows to incorporate 125
6 the NH4+ excreted by cultured oysters. The relationship between N uptake and other key
126
processes such as photosynthesis and internal recycling of N was also examined. Net 127
photosynthetic rates were measured in situ using benthic chambers, while the recycling 128
of 15N was measured in plant tissues two weeks after pulse labeling. 129
130
Materials and Methods 131
132
Study site 133
The study was carried out in March 2015 at San Quintín Bay (30° 30' N, 116° 00' W), a 134
Y-shaped coastal lagoon (43 km2, 2 m average depth) located on the northwestern
135
Pacific coast of the Baja California Peninsula, Mexico (Fig. 1a). The region has a 136
Mediterranean-type climate and arid conditions prevail throughout most of the year. 137
Land inputs of water and nutrients via runoff are non-existent except during the winters 138
of very wet years. Water exchange and circulation are mainly dominated by semidiurnal 139
tidal flows (average tidal amplitude of 1.6 m) between the lagoon and the coastal ocean, 140
which represents the main external source of nutrients. The bay connects with the ocean 141
through a single mouth and has two arms: an eastern, inner arm known as Bahía San 142
Quintín and a western arm known as Bahía Falsa. Water circulation largely occurs 143
through narrow and deep (5–7 m) channels that extend along the length of both arms. A 144
detailed description of the bay and its biogeochemical characteristics can be found in 145
Camacho-Ibar et al. (2003), Hernández-Ayón et al. (2004) and Ribas-Ribas et al. 146
(2011). Monospecific meadows of the seagrass Z. marina develop extensively along the 147
intertidal and shallow subtidal flats, occupying about 45 % of the total surface area of 148
the lagoon (about 2000 ha; Poumian-Tapia and Ibarra-Obando 1999; Ward et al. 2003). 149
In Bahía Falsa, intensive oyster aquaculture practices (mostly oyster racks and off-150
7 bottom longlines) have co-occured with dense Z. marina meadows for more than 30 151
years (Ward et al. 2003; García-Esquivel et al. 2004). For this study, two eelgrass 152
meadows (~2 m depth during high tides) were selected in Bahía Falsa: one where shoots 153
grow alongside off-bottom longlines (Fig. 1b), hereafter referred to as the "oyster site" 154
(N 30° 25’ 53.4”, W115° 59’ 59.8”), and one where Z. marina shoots are not directly 155
affected by oyster aquaculture (~1 km from oyster farming structures), hereafter 156
referred to as the "reference site" (N 30° 25’ 22.5”, W116° 00’ 9.7”) (Fig. 1a). The 157
selected sites were in close proximity since Sandoval-Gil et al. (2015) recently 158
demonstrated that Z. marina exhibits high plasticity of its physiological properties, 159
including its DIN uptake kinetics, according to its location in the lagoon. Also, 160
environmental variables that may control DIN assimilation, including temperature and 161
salinity, show strong spatial gradients (Camacho-Ibar et al. 2003); thus, site proximity 162
would limit potential differences in the uptake kinetics due to spatial differences in 163
environmental parameters. Similar light availability, bottom depth and sediment 164
characteristics were also considered for the selection of the sites. Maintaining these 165
parameters as similar as possible allowed for a better evaluation of the effect of oyster 166
farming on DIN assimilation by seagrasses. 167
Vegetative descriptors 168
Leaf growth (g DW shoot–1 day–1; DW = dry weight) was determined using the 169
punching method described for seagrasses by Zieman et al. (1974). All leaves from ten 170
random shoots collected at each meadow site were punched with a hypodermic needle 171
immediately above the leaf sheath. After 14 days, the growth of all leaves of each shoot 172
was measured and summed and the average shoot growth was calculated (n = 10). The 173
size (surface area) of each leaf (cm2) was calculated from the length and three 174
measurements (taken with a digital vernier caliper) of the width at the basal, 175
8 intermediate and apical parts of the leaf. The percentages of new leaf tissue produced 176
were calculated from the area of the new leaf tissue grown relative to the total area of 177
each leaf. The leaf area (cm2) corresponding to necrotic tissue and the coverage of
178
epiphytes was also measured and expressed as the percentage of the entire surface of 179
each leaf. Shoot density (number of shoots m-2) was determined from shoot counts 180
within 40 × 40 cm2 quadrats (n = 4), while above- and belowground biomass (g DW m -181
2) were determined collecting all plant material within 3.5-cm-diameter cores placed in
182
the sediment (n = 4). 183
Elemental composition and isotopic analysis 184
The total carbon (C) and N contents and their natural stable isotopic composition (δ13C
185
and δ15N; Coplen 1994 and Sharp 2005) were determined in leaf and rhizome tissues of
186
three shoots from each site. Elemental C and N composition was expressed as 187
percentage per unit of dry weight and as the molar C/N ratio. Isotopic determinations 188
were carried out at the University of California Davis Stable Isotope Facility using an 189
elemental analyzer interfaced to a continuous flow isotope ratio mass spectrometer. The 190
standard deviation was 0.2 ‰ for δ13C and 0.3‰ for δ15N . The analytical details can be
191
found at http://stableisotopefacility.ucdavis.edu/13cand15n.html. 192
In situ plant incubations 193
Plant incubations were carried out at each site to measure leaf 15NH4+ uptake using 4-L
194
transparent Plexiglas benthic chambers (65 cm height, 10 cm diameter), each with a 195
transparent lid to cover the top and held vertically by a tripod structure attached to the 196
sediment (Fig. 2a). Each chamber containing one rooted Z. marina shoot was inserted 5 197
cm into the sediment avoiding damage to the rhizome. Prior to chamber insertion, 198
epiphytes on leaves were carefully removed in situ with a razor blade (avoiding leaf 199
damage) to limit their contribution to 15NH
4+ uptake, since epiphytes on seagrasses can
9 incorporate large amounts of DIN (e.g. Dudley et al. 2001, Apostolaki et al. 2012). At 201
each site, chambers (n = 6) were deployed for 24 h without cover lid before the 202
experimental incubations to allow stabilization of suspended sediments in the water 203
within the chambers. Benthic chambers at each site were placed in close proximity, 204
within an area of about 10 m2, in order to avoid confounding factors in the comparison 205
between sites, such as differences due to eelgrass physiology and/or changes in 206
environmental conditions associated with heterogeneity at the meadow spatial scale. For 207
incubations, chambers were covered at the top and 50 mL of tracer (15NH4Cl at.% = 99,
208
Cambridge Isotope Laboratories) were added with a polyethylene syringe to obtain an 209
ammonium concentration of ~10 µM. The ammonium concentration in the incubations 210
was higher than the natural concentration measured at the time of the experiment (~1 211
µM), but it is within the concentration range commonly experienced by Z. marina in 212
San Quintín Bay (1.8–17 µM; Hernández-Ayón et al. 2004). During incubations, the 213
seawater inside the chambers was continuously mixed with a submersible propeller 214
pump to homogenize the tracer and reduce the leaf boundary layer (Cornelisen and 215
Thomas 2004). At both sites, incubations were performed at similar irradiance, salinity, 216
temperature and tidal conditions (906.8 ± 88 µmol photons m-2 s-1; S = 34 practical 217
salinity scale; 18.1 ± 0.1 °C). Environmental parameters were monitored using an 218
underwater spherical quantum sensor (LI-193, LI-COR, USA) and a submersible multi-219
parameter probe (YSI Pro Plus, USA). After 1 h of incubation (Ti) all chambers were
220
removed but only three of the six incubated shoots at each site were collected. The 221
leaves of the other three shoots were left rooted in the sediment for two weeks to follow 222
the recycling of 15N within plant tissues and to measure growth (Tf, see below). These
223
shoots were tagged with plastic tape wrapped around the rhizome to facilitate recovery. 224
Immediately after collection, leaves were cleaned of epiphytes and tissues were rinsed 225
10 with distilled water to remove any adsorbed tracer. The leaves were detached from 226
belowground tissues and separated according to age. Leaves and rhizomes were dried at 227
60 ºC for 48 h and ground to a fine powder. Nutrient concentrations were determined 228
from filtered seawater and sediment pore water samples (n = 6) collected at the 229
experimental sites and analyzed spectrophotometrically (Skalar SanPlus Analyzer). 230
Nutrient samples were collected at high tide when ammonium concentrations are less 231
variable (typically <10 µM), as during low tides, sediment resuspension may induce 232
short-lived (< 1 h) ammonium pulses of up to 50 µM (Hernández-Ayón et al. 2004). 233
Specific ammonium uptake rates by each leaf (Vleaf, expressed as μmol 15N g−1 DW h−1)
234
were calculated following Alexandre et al. (2011) and Sandoval-Gil et al. (2015): 235
(Eq. 1) Vleaf = [(15Nexp-15Nback) × Nc] / (MN × t)
236
where the difference (15Nexp-15Nback, at. %) is the 15N enrichment relative to natural 15N
237
levels of leaves of different age, Nc is the N content (g N g−1 DW), MN is the molar mass
238
of N, and t is the duration of the incubation (1 h). We assumed that during the 1-h 239
incubation no significant water to sediment flux of 15NH4 tracer occurred; thus, the
240
amount of 15N recovered in the rhizomes was included in the calculations to determine
241
the rates of 15N uptake by the leaves. 242
Also, absolute uptake rates of eelgrass aboveground biomass (Vab, expressed as mmol 243
15N m-2 h−1) were calculated as:
244
(Eq. 2) Vab = ∑(Vleaf * ableaf) 245
where ableaf is the aboveground biomass of the different leaves (gDW m-2). 246
Internal recycling of 15N was determined as the percentage of 15N which remained in 247
plant tissues at the end of the experiment by comparing the values of 15N (µg DW) in
248
the leaves and rhizomes of plants collected after the 1-h incubations (Ti) with those in
249
plant tissues that remained rooted in the field for two weeks (Tf).
11 Net photosynthesis (net-P) and respiration (R) rates were also determined in situ by 251
incubating whole plants (leaves plus rhizome and roots) in closed benthic chambers 252
(Fig. 2b). Four plants from each site, collected by scuba diving, were carefully cleaned 253
of epiphytes, avoiding leaf damage, and placed separately in two benthic chambers. 254
During handling, shoots were kept in a Ziploc plastic bag filled with seawater to avoid 255
emersion, and shaded with a dark plastic mesh to prevent exposure to excessive light. 256
The above/belowground plant biomass ratios (1.9–2.2) were similar in all chambers. 257
Incubations were performed simultaneously at the reference site to ensure that shoots 258
were subjected to the same environmental conditions of irradiance, temperature and pH. 259
For these experimental incubations, uprooting of shoots was unavoidable. To restrict the 260
effects of uprooting on photosynthesis and respiration, the collection of plants and the 261
incubations were done on the same day. In order to have a large number of net-P 262
measurements, incubations were performed on four consecutive days at different tidal 263
heights and, therefore, at different irradiance levels ranging from 750 to 2400 µmol 264
photons m-2 s-1. On any given day, incubations were conducted with the same shoots
265
collected that day. Rates of net-P by eelgrass leaves (expressed as µmol O2 g-1 leaves
266
DW h-1) were calculated from the increments in dissolved oxygen (DO) inside each 267
chamber during short incubation periods (see below), measured with a multi-parameter 268
probe with a DO polarographic sensor (Pro Series YSI) inserted in the upper lid cover. 269
Following the recent study of Olivé et al. (2015), we conducted some trials to optimize 270
the experimental incubation by using different amounts of tissue biomass within the 271
chambers, and different incubation times. We finally selected a plant biomass per 272
seawater volume of about 0.7–0.9 g DW L-1 and short incubation times of 25 min to 273
ensure accurate measurements of photosynthetic rates avoiding the underestimation of 274
12 photosynthesis due to oxygen over-saturation and/or C limitation. The seawater within 275
chambers was completely renewed before each new incubation. 276
Respiration was measured as described above for photosynthesis, but in this case 277
incubations were performed in the dark by covering the chambers with polyvinyl 278
carbonate tubes. Incubations lasted for 40 minutes. Respiration rates (µmol O2 g DW-1
279
h-1, n = 3) were calculated from the decrease of DO inside the chambers at time 280
intervals of ~10 min. The accuracy of the DO measurements obtained with the 281
polarographic sensor method was tested against DO measurements using the Winkler 282
titration method in preliminary trials. The DO values obtained with the different 283
methods were similar, with a data variance of about 0.05%. P:R ratios were calculated 284
as the integration of net-P and R during the daily photoperiod at the time of experiment 285
(i.e. net-P × 11 hours of light; R × 13 hours of darkness). Although R may vary during 286
the photoperiod (e.g. Rasmusson and Björk 2014), P:R ratios were used as a proxy of 287
the plants daily C balance. 288
Statistical analyses 289
Statistical differences in the ammonium uptake rates, nutrient and isotopic composition 290
of the different leaves of shoots from both sites were examined by two-way ANOVA 291
with two fixed factors: meadow site (with two levels, reference site and oyster site) and 292
leaf age (with five levels, leaf #1 to leaf #5). The application of this analysis has the 293
implicit assumption of biological independence among leaves of different ages within a 294
shoot, which is not the case for the natural situation in the field (see Alcoverro et al. 295
1998, 2001). However, since all the incubated shoots had the same number of leaves, 296
and thus the same dependence effect is present in all replicates, the use of a general 297
linear model is justified to test differences among leaves of shoots within sites. Post-hoc 298
mean comparisons for the ANOVA (Student–Newman–Keuls) were performed to 299
13 identify specific treatment level(s) causing significant effects. Effects were considered 300
statistically significant at p < 0.05. Significant differences in Vab, the descriptors of 301
eelgrass vegetative performance (i.e. shoot size, density, biomass, growth), and in 302
photosynthesis and respiration between shoots from each meadow site (reference site 303
and oyster site) were examined using Student t-tests. Prior to the analysis, data were 304
checked for normality and homocedasticity, and transformed when necessary. Statistical 305
analyses were performed using the SIGMAPLOT 11 statistical package (Systat 306
Software Inc, USA). 307
308
Results 309
310
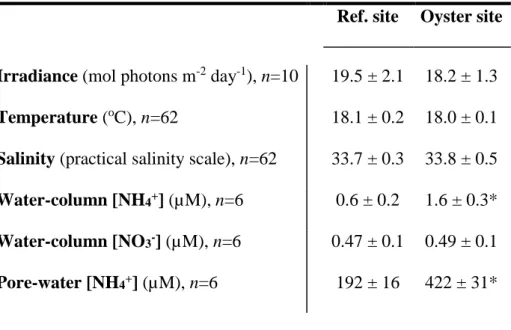
Among the measured environmental parameters (Table 1), only NH4+ concentration was
311
significantly different between sites, being higher at the oyster site, both in the water 312
column and in pore water. 313
Values of Vleaf varied significantly with site and leaf age (two-way ANOVA, F4, 29 = 314
7.214; p < 0.001) (Fig. 3). The uptake rates of older leaves (#3 to #5) were higher at the 315
oyster site than at the reference site. In shoots from both sites, uptake rates by leaves #2 316
and #3 were ~2.5 fold higher than by leaves #4 and #5. On average, shoots from the 317
oyster site took up ammonium at a rate 37% higher than those from the reference site 318
(Fig. 3a). Values of Vab were also significantly higher (t = -3.065, p = 0.022) at the 319
oyster site (Fig. 3b). 320
Values of net-P were, on average, 38% higher in plants from the oyster site than in 321
those from the reference site (p < 0.03, Fig. 4a). The P:R ratio was higher at the oyster 322
site (t-test; t = -3.025, df = 34; p = 0.005; Fig. 4b) as a result of similar leaf respiration 323
rates at both sites (~15.5 µmol O2 g-1 DW h-1) and a higher net-P rate at the oyster site.
14 All leaf and rhizome tissues of Z. marina from the oyster site showed significantly 325
lower values of δ15N (by 3.5‰: p < 0.01) (Fig. 5a) than those from the reference site. In
326
contrast, δ13C values were ~1.8‰ higher (except for leaf #4) (Fig. 5b) at the oyster site.
327
Leaf %N was higher at the oyster site (p < 0.01), whereas no differences were detected 328
in %C. Both %N and %C significantly decreased from the youngest leaf (#1) to the 329
oldest leaf (#5). In general, %N and %C were lowest in rhizomes (Fig. 5c, d). The C/N 330
molar ratio showed the opposite pattern, increasing by ~60% from the youngest to the 331
oldest leaf at both sites, whereas maximum C/N values were found in rhizomes (p < 332
0.01; Fig. 5e). The C/N values were significantly higher in leaves and rhizomes from 333
the reference site. 334
Epiphyte and necrotic tissue cover measured in the oldest leaves (#3 to #5) did not vary 335
significantly between sites (Table 2). On the other hand, shoot morphology and meadow 336
structure were significantly different between sites (Table 3). Shoot size and leaf growth 337
were about two-fold higher in plants from the oyster site than from the reference site. 338
On the contrary, belowground biomass and shoot density were significantly lower at the 339
oyster site. Above/belowground biomass ratio was 1.7-fold higher in plants from the 340
oyster site. 341
Values of 15N content of plant tissues decreased in eelgrass shoots from both sities (Fig. 342
6) two weeks after the experimental incubations (Tf) until values close to those found at
343
T0 (i.e. natural isotope abundance). On the contrary, 15N enrichment significantly
344
increased in leaf #0 (by ~50%) and rhizome tissues (by 80%) of shoots from the oyster 345
site, but not from the reference site. Within each site, we did not find significant 346
differences between old and new tissues of each leaf. 347
348
Discussion 349
15 350
In our study, Z. marina shoots growing around off-bottom oyster farming structures 351
showed a higher capacity of leaf incorporation of NH4+ (Vleaf and Vab, Fig. 3) than those
352
growing ~1 km from oyster farming structures, indicating physiological adjustments at 353
the level of NH4+ uptake kinetics and/or its metabolic assimilation (Touchette and
354
Burkholder 2000, 2007; Rubio et al. 2007). Although not assessed in this study, it is 355
likely that shoots growing near oysters show specific uptake kinetics properties, such as 356
higher Vmax (i.e. maximum uptake rates) and/or higher α (i.e. uptake affinity) for NH4+,
357
as compared to those from the reference site. Differences in these descriptors of the 358
uptake of DIN species among eelgrass plants from different sites in San Quintín Bay 359
have recently been reported by Sandoval-Gil et al. (2015). Based on incubations under 360
laboratory conditions of eelgrass shoots from four sites in the bay, using 15N tracers 361
(15NH4+ and 15NO3-) Sandoval-Gil et al. (2015) obtained significantly higher Vmax and/or
362
higher α values for the uptake of ammonium by Z. marina shoots collected at two oyster 363
farming sites in Bahía Falsa compared to shoots collected at the mouth of the lagoon 364
and at a site in the eastern arm, away from oyster farming activity. This physiological 365
plasticity of Z. marina is consistent with the differences found between shoots from the 366
reference and oyster sites in this work. Since there were no substantial differences in 367
environmental parameters (e.g. salinity, temperature, irradiance) between sites, these 368
differences can be related to the higher capacity of shoots at the oyster site to exploit a 369
valuable source of NH4+ from oyster excretion.
370
Oysters release large amounts of NH4+ by direct excretion to the water column and also
371
enhance NH4+ sediment–water fluxes through the remineralization of their biodeposits
372
(Newell at al. 2005; Kellogg et al. 2014). This may represent an important DIN supply 373
in the N budget of San Quintín Bay, particularly during weak or non-upwelling periods, 374
16 considering that the main external source of nutrients to this lagoon is the adjacent 375
ocean (Hernández-Ayón et al. 2004; Camacho-Ibar et al. 2003). Based on calculations 376
and assumptions reported by Hernández-Ayón et al. (2004), corrected with recent oyster 377
production figures for Bahía Falsa (~1240 t in 2013), we estimate that all oysters 378
cultivated in this bay excrete about 5.2 × 10⁶ mmol NH4+ day-1. According to our
379
measurements of eelgrass NH4+ uptake rates and aboveground biomass, eelgrass
380
meadows at Bahía Falsa located near oyster farms would have the potential to 381
incorporate about 33.1 mmol NH4+ m-2 day-1 and those located farther away, about 25.6
382
mmol NH4+ m-2 day-1. Consequently, it would take an area of 15–16 ha of eelgrass to
383
incorporate the whole amount of NH4+ excreted by oysters. This area represents only
384
about 3–4% of the 547 ha of subtidal eelgrass cover in Bahía Falsa (Ward et al. 2003), 385
clearly showing the biofiltration potential of Z. marina meadows in San Quintín Bay, 386
which may act as effective buffers of the NH4+ loading from oyster farms. It must be
387
noted, however, that seagrasses are not the sole sink of the ammonium derived from 388
oyster aquaculture. Opportunistic macroalgae (Ulva spp.) are also present in San 389
Quintín Bay and are particularly abundant in Bahía Falsa (Zertuche-González et al. 390
2009). As Ulva spp. is probably N-limited in San Quintín Bay (Zertuche-González et al. 391
2009), the uptake of NH4+ by eelgrass in Bahía Falsa may exert some control on the
392
growth of opportunistic macroalgae. These results highlight the critical role of 393
seagrasses in the N budget of this bay, and also their relevance for management 394
strategies developed to cope with potential sources of eutrophication (e.g. wastewater, 395
agriculture and groundwater, etc.) in other coastal ecosystems (McGlathery et al. 2007). 396
More research efforts must be conducted to assess the biofiltering role of Z. marina in 397
San Quintín Bay, because oyster production can, in turn, lead to alterations in vegetative 398
descriptors at shoot and meadow levels (Tallis et al. 2009), which have not been 399
17 evaluated for Bahía Falsa. Direct/indirect effects of oyster aquaculture like shading, 400
competition for space and increasing sedimentation caused by aquaculture structures, as 401
well as oyster harvesting methods, may have negative impacts on Z. marina. Negative 402
effects include a reduction in photosynthesis, the alteration of meadow structure (e.g. 403
shoot density, cover and aboveground biomass), and a decrease in recruitment (i.e. seed 404
production and seedling density) (Everett et al. 1995; Kelly and Volpe 2007; Wisehart 405
et al. 2007; Wagner et al. 2012; Skinner et al. 2014). Conversely, these descriptors can 406
be positively affected depending on oyster culture density, sediment characteristics or 407
cultivation practices employed(Booth and Heck 2009; Tallis et al. 2009; Wagner et la. 408
2012). In this study we observed that photosynthesis, leaf growth and plant size were 409
higher for shoots from the oyster site, where a higher concentration of NH4+ in the water
410
column and in the sediment pore water is available for plant tissues. In contrast, the 411
lower above/belowground biomass ratio of eelgrass at the reference site was probably 412
caused by a higher investment in belowground tissues to compensate for lower nutrient 413
availability (Short 1987; Lee and Dunton 1999). However, studies at different sites have 414
also reported that NH4+ excretion and biodeposition from bivalves (i.e. mussels) can
415
lead to adverse effects on eelgrass performance due to the decrease in light availability 416
by increasing leaf epiphyte cover and increased sulfide toxicity (Vinther and Holmer 417
2008; Vinther et al. 2008; Korhonen et al. 2012). As reported by Korhonen et al. (2012), 418
we observed that eelgrass beds were almost absent only directly under the oyster 419
structures; this may indicate that shoots at the oyster site (i.e. 1–4 m near oyster 420
longlines) were not directly exposed to the negative effects of oysters (e.g. sulfide and 421
NH4+ toxicity or structure shading). The average NH4+ concentration in sediment pore
422
water at the oyster site (422 µM) was much lower than the toxic levels observed to 423
cause detrimental effects on Z. marina productivity under experimental conditions 424
18 (~1200 µM; Vinther and Holmer 2008). Also, epiphyte coverage on leaves was similar 425
between sites. A positive interaction between mussel culture and the productivity of Z. 426
marina and Thalasssia testudinum has also been reported, mainly due to the fertilization
427
of sediments by mussel biodeposition and a reduction of epiphytic loads on the leaves 428
(Reusch at al. 1994; Peterson and Heck 2001a, b). 429
Photosynthesis and the P:R ratio of Z. marina were higher near oyster cultures, probably 430
fuelled by the higher NH4+ uptake since N and C metabolism are closely related
431
(Burkholder et al. 1992; Invers et al. 2004; Touchette and Burkholder 2007). Higher 432
carbon fixation rates and higher mobilization of storage carbohydrates may be required 433
by shoots near oyster farming structures in order to assimilate the NH4+ available from
434
oyster excretion and to incorporate it into organic compounds like free amino acids 435
(Invers et al. 2004). Photosynthesis decreased in shoots from both sites at high 436
irradiances when tidal height decreased and pH and temperature increased, probably due 437
to the combined effects of photoinhibiton and C limitation (Invers et al. 1997; Olivé et 438
al. 2015). 439
Nitrogen content decreased with leaf age in Z. marina. This pattern has been previously 440
described for seagrasses, and results from the dilution of the N pool by a higher relative 441
abundance of structural components as suggested by the higher C/N ratio, and/or the N 442
resorption from senescent leaves (Pedersen and Borum 1993; Lepoint et al. 2002). 443
Observing consistently higher %N in leaves and rhizomes of shoots from the oyster site 444
was an expected response likely related to the storage of excess N for plant growth 445
(Burkholder et al. 2007). Although C content declined in older leaves, the C/N molar 446
ratio gradually increased from younger to older leaves, reflecting that structural C 447
compounds are less mobile than N-containing components (Stapel and Hemminga 448
1997). 449
19
Zostera marina shoots from the oyster site showed natural δ15N values of around 450
12.5‰, which were lower than the δ15N values for the reference site (~16‰). This can
451
be a consequence of the lighter isotope being preferentially uptaken over the heavier 452
isotope at the oyster site due to a greater availability of DIN. It may also be related to 453
differences in the isotopic signal of different sources of dissolved organic/inorganic N 454
(Alkhatib et al. 2012). On the other hand, we did not find significant differences in the 455
natural N isotopic signal among the leaves of different ages and rhizomes of eelgrass 456
shoots within each site. This suggests that even with different uptake rates, leaves of 457
different ages do not exhibit differences in discrimination against the heavier isotope, or 458
such differences are masked by other processes such as intra-plant fractionation due to 459
N translocation or exudation (Evans 2001; Yamamuro et al. 2004). 460
Values of δ13C were higher in shoots at the oyster site, reflecting a higher C demand at 461
this site where photosynthetic production was higher. Under high demand, C isotopic 462
discrimination during photosynthesis decreases, leading to higher isotopic ratios in leaf 463
tissues (Hemminga and Mateo 1996). The decrease in δ13C values of leaves with age
464
suggests the effects of a progressive decrease in growth and thus in C demand. Similar 465
trends have been documented elsewhere, reflecting the reduction in the photosynthetic 466
rates and the change in the carbohydrate composition with leaf ageing (Lepoint et al. 467
2003). 468
Different leaves of Z. marina shoots from both sites exhibited different NH4+ uptake
469
rates, a probable consequence of different levels of growth activity. We found higher 470
uptake rates for intermediate, actively-growing leaves (#2 and #3), while lower rates 471
corresponded to the older, less active leaves (#4 and #5). These leaves showed larger 472
necrotic areas and higher epiphyte cover, which also limit NH4+ uptake (Cornelisen and
473
Thomas 2004). The youngest leaf (#1) showed lower NH4+ uptake capacity than leaves
20 #2 and #3, in contrast to previous studies reporting higher uptake in the youngest leaves 475
of Z. marina and other seagrasses after experimental incubation using labeled NH4+
476
(Iizumi and Hattori 1982; Pedersen et al. 1997; Lepoint et al. 2002). This discrepancy 477
may be explained by the larger incubation periods used in the cited studies (from 24 478
hours to 7 days), which potentially allowed for translocation and/or internal N recycling 479
that could have increased the 15N abundance in the youngest tissues that act as N sinks 480
(Hemminga et al. 1999; Lepoint et al. 2002; Marbá et al. 2002). In addition, it must be 481
noted that most of the surface of the youngest leaf was within the sheath, probably 482
restricting the incorporation of NH4+ directly from the water column.
483
The abundance of 15N in eelgrass leaf tissues generally decreased two weeks after pulse
484
labeling (Tf). This resulted from the dilution of the internal 15N pool by active uptake of
485
unlabeled external N sources. This is consistent with the notion that fast growing 486
species like Z. marina depend to a lesser extent on internal N recycling compared to 487
slow-growing species (e.g. Posidonia oceanica) that have a longer leaf life span 488
(Hemminga et al. 1999). Also, within each leaf, there were no significant differences in 489
the 15N content between old and new tissues, except for leaf #0 (i.e. entirely new leaf) of 490
shoots from the oyster site which showed the highest enrichment compared to the rest of 491
plant tissues; rhizome tissues were also enriched in 15N after two weeks incubation (Tf)
492
but only in shoots exposed to oysters. This may indicate that the greater availability of 493
NH4+ from oyster excretion allows shoots at the oyster site to use the N incorporated to
494
satisfy the N requirements of younger actively growing tissues, as well as to store 495
excess N in belowground tissues through basipetal translocation (Pedersen et al. 1997; 496
Stapel et al. 2001). 497
In summary, Z. marina plants directly influenced by oyster aquaculture in the western 498
arm of San Quintín Bay showed higher rates of NH4+ uptake than shoots located ~1 km
21 from oyster longlines. This indicates that eelgrass growing near oysters are
500
physiologically adapted to efficiently acquire NH4+ from bivalve excretion. We
501
calculate that about 3% of the area covered by eelgrass meadows in Bahía Falsa could 502
incorporate the total of NH4+ excreted by oysters, which highlights the biofiltering
503
potential of eelgrass meadows in this bay. Vegetative productivity and photosynthesis 504
of eelgrass were also higher at the oyster site, reflecting the higher metabolic utilization 505
of N compounds for plant growth. However, the capacity of eelgrass as a biofilter of 506
oyster aquaculture-derived nutrients in Bahía Falsa may also depend on other spatio-507
temporal factors that must be addressed in future studies. For instance, the biofiltering 508
capacities of eelgrass meadows can be influenced by changes in vegetative productivity, 509
which changes seasonally (Cabello-Pasini et al. 2003), or by environmental factors that 510
show spatial gradients within the bay (e.g. salinity, temperature; Ribas-Ribas et al. 511
2011). Aditionally, the interaction between oyster aquaculture and submerged 512
vegetation must be examined, given that the abundance of opportunistic macroalgae 513
(e.g. Ulva spp.) has increased recently in San Quintín Bay, probably as a result of oyster 514
cultivation (Zertuche et al. 2009). The complete understanding of the complex 515
relationship between co-occuring oyster farming and eelgrass, which provides important 516
ecosystem and economic services, will provide valuable scientific criteria urgently 517
needed for the management, conservation and restoration of coastal lagoons and 518
estuaries worldwide (Buzzelli et al. 2015; Dumbauld and McCoy 2015; Forde et al. 519 2015; Sharma et al. 2016). 520 521 Acknowledgments 522 523
22 This research was funded by the National Council for Science and Technology 524
(CONACYT, Mexico, project CB-2010-01-154376 awarded to VFCI). JMSG was 525
supported by a postdoctoral grant from the Mexican Ministry of Public Education (SEP, 526
PROMEP/103.5/13/5009). AA was supported by an Academic Mobility Grant provided 527
by the Autonomous University of Baja California (UABC) and a postdoctoral 528
fellowship from the Portuguese Foundation for Science and Technology (FCT, 529
SFRH/BPD/91629/2012). 530
We are especially grateful to Christine Harris (from the editorial team of the journal 531
Ciencias Marinas) for her support during the revision of the manuscript, and to Julieta 532
Hernández, Nevia Alfaro, M. Carmen Ávila-López and Eduardo Ortíz-Campos, Jesús 533
Galarza (IIO-UABC) and the personnel from Ostrícola Nautilus for their technical 534
support. Data of irradiance was kindly provided by Dr. Alejandro Cabello-Pasini. 535
536
References 537
538
Alcoverro, T., M. Manzanera, and J. Romero. 1998. Seasonal and age-dependent 539
variability of Posidonia oceanica (L.) Delile photosynthetic parameters. Journal 540
of Experimental Marine Biology and Ecology 230: 1-13.
541
Alcoverro, T., M. Manzanera, and J. Romero. 2001. Annual metabolic carbon balance 542
of the seagrass Posidonia oceanica: the importance of carbohydrate 543
reserves. Marine Ecology Progress Series 211: 105-116. 544
Alexandre, A., J. Silva, T.J. Bouma, and R. Santos. 2011. Inorganic nitrogen uptake 545
kinetics and whole-plant nitrogen budget in the seagrass Zostera noltii. Journal of 546
Experimental Marine Biology and Ecology 401: 7-12.
23 Alexandre, A., P.W. Hill, D.L. Jones, and R. Santos. 2015. Dissolved organic nitrogen: 548
a relevant, complementary source of nitrogen for the seagrass Zostera marina. 549
Limnology and Oceanography. doi: 10.1002/lno.10084
550
Alkhatib, M., M.F. Lehmann, and P.A. del Giorgio. 2012. The nitrogen isotope effect of 551
benthic remineralization-nitrification-denitrification coupling in an estuarine 552
environment. Biogeosciences 9: 1633–1646. 553
Apostolaki, E.T., S. Vizzini, and I. Karakassis. 2012. Leaf vs. epiphyte nitrogen uptake 554
in a nutrient enriched Mediterranean seagrass (Posidonia oceanica) 555
meadow. Aquatic botany 96(1): 58-62. 556
Booth, D.M., and K.L. Heck. 2009. Effects of the American oyster Crassostrea 557
virginica on growth rates of the seagrass Halodule wrightii. Marine Ecology
558
Progress Series 389: 117−126.
559
Buhmann, A., and J. Papenbrock. 2013. Biofiltering of aquaculture effluents by 560
halophytic plants: basic principles, current uses and future perspectives. 561
Environmental and Experimental Botany 92: 122–133.
562
Burkholder, J.M., D. Tomasko, and B.W. Touchette. 2007. Seagrasses and 563
eutrophication. Journal of Experimental Marine Biology and Ecology 350: 46-72. 564
Buzzelli, C., P. Gorman, P.H. Doering, Z. Chen, and Y. Wan. 2015. The application of 565
oyster and seagrass models to evaluate alternative inflow scenarios related to 566
Everglades restoration. Ecological Modeling 297: 154-170. 567
Cabello-Pasini, A., R. Muniz-Salazar, and D.H. Ward. 2003. Annual variations of 568
biomass and photosynthesis in Zostera marina at its southern end of distribution 569
in the North Pacific. Aquatic Botany 76: 31-47. 570
24 Camacho-Ibar, V.F., J.D. Carriquiry, and S.V. Smith. 2003. Non-conservative P and N 571
fluxes and net ecosystem production in San Quintín Bay, Mexico. Estuaries 26: 572
1220-1237. 573
Coplen, T.B. 1994. Reporting of stable hydrogen, carbon, and oxygen isotopic 574
abundances (technical report). Pure and Applied Chemistry 66(2): 273-276. 575
Cornelisen, C.D., and F.I.M. Thomas. 2004. Ammonium and nitrate uptake by leaves of 576
the seagrass Thalassia testudinum: impact of hydrodynamic regime and epiphyte 577
cover on uptake rates. Journal of Marine Systems 49: 177-194. 578
Cullen-Unsworth, L.C., L. Nordlund, J. Paddock, S. Baker, L.J. McKenzie, and R.K.F. 579
Unsworth. 2013. Seagrass meadows globally as a coupled social-ecological 580
system: implications for human wellbeing. Marine Pollution Bulletin 83: 387-397. 581
Dudley, B.J., A.M.E. Gahnstöm, and D.I. Walker. 2001. The role of benthic vegetation 582
as a sink for elevated inputs of ammonium and nitrate in a mesotrophic estuary. 583
Marine Ecology Progress Series 219: 99-107.
584
Dumbauld, B.R., and L.M. McCoy. 2015. Effect of oyster aquaculture on seagrass 585
Zostera marina at the estuarine landscape scale in Willapa Bay, Washington
586
(USA). Aquaculture Environmental Interactions 7: 29-47. 587
Evans, R.D. 2001. Physiological mechanisms influencing plant nitrogen isotope 588
composition. Trends in Plant Science 6: 121–26. 589
Everett, R.A., G.M. Ruiz, and J.T. Carleton. 1995. Effect of oyster mariculture on 590
submerged aquatic vegetation: an experimental test in a Pacific Northwest 591
estuary. Marine Ecology Progress Series 125: 205-217. 592
Forde, J., F.X. O’Beirn, J.P.C. O’Carroll, A. Patterson, and R. Kennedy. 2015. Impact of 593
intertidal oyster trestle cultivation on the Ecological Status of benthic habitats. 594
Marine Pollution Bulletin. doi:10.1016/j.marpolbul.2015.04.013
25 Fourqurean, J.W., C.M. Duarte, H. Kennedy, N. Marbá, M. Holmer et al. 2012.
596
Seagrass ecosystems as a globally significant carbon stock. Nature Geoscience 5: 597
505-509. 598
García-Esquivel, S., M.A. González-Gómez, F. Ley-Lou, and A. Mejía-Trejo. 2004. 599
Oyster culture potential in the west arm of San Quintín Bay: current biomass and 600
preliminary estimate of the carrying capacity. Ciencias Marinas 30: 61-74. 601
Hasegawa, N., H. Iizumi, and H. Mukai. 2005. Nitrogen dynamics of the surfgrass 602
Phyllospadix iwatensis. Marine Ecology Progress Series 293: 59-68.
603
Hemminga, M.A., B.P. Koutstaal, J. Van Soelen, and A.G.A.M. Merks. 1994. The 604
nitrogen supply to intertidal eelgrass (Zostera marina L.). Marine Biology 118: 605
223-227. 606
Hemminga, M.A., and M.A. Mateo. 1996. Stable carbon isotopes in seagrasses: 607
variability in rations and use in ecological studies. Marine Ecology Progress 608
Series 140: 285–298.
609
Hemminga, M.A., N. Marbá and J. Stapel. 1999. Leaf nutrient resorption, leaf lifespan 610
and the retention of nutrients in seagrass systems. Aquatic Botany 65: 141-158. 611
Hernández-Ayón, J.M., S. Galindo-Bect, V.F. Camacho-Ibar, S. García-Esquivel, M.A. 612
González-Gómez, and F. Ley-Lou. 2004. Nutrient dynamics in the west arm of 613
San Quintín Bay, Baja California, Mexico. Ciencias Marinas 30: 119-132. 614
Hoellein, T.J., and C.B. Zarnoch. 2014. Effect of eastern oysters (Crassostrea virginica) 615
on sediment carbon and nitrogen dynamics in an urban estuary. Ecological 616
Applications 24: 271-286.
617
Iizumi, H., A. Hattori, and C.P. McRoy. 1982. Ammonium regeneration and 618
assimilation in eelgrass (Zostera marina) beds. Marine Biology 66: 59–65. 619
26 Invers, O., J. Romero, and M. Pérez. 1997. Effects of pH on seagrass photosynthesis: a 620
laboratory and field assessment. Aquatic Botany 59: 185–194. 621
Invers, O., G.P. Kraemer, M. Pérez, and J. Romero. 2004. Effects of nitrogen addition 622
on nitrogen metabolism and carbon reserves in the temperate seagrass Posidonia 623
oceanica. Journal of Experimental Marine Biology and Ecology 303: 97-114.
624
Kelly, J.R., and J.P. Volpe. 2007. Native eelgrass (Zostera marina L.) survival and 625
growth adjacent to non-native oysters (Crassostrea gigas Thunberg) in the Strait 626
of Georgia, British Columbia. Botanica Marina 50: 143-150. 627
Kellogg, M.L., A.R. Smyth, M.W. Luckenbach, R.H. Carmichael, B.L. Brown, J.C. 628
Cornwell, M.F. Piehler, M.S. Owens, D.J. Dalrymple, and C.B. Higgins. 2014. 629
Use of oysters to mitigate eutrophication in coastal waters. Estuarine, Coastal and 630
Shelf Science 151: 156-168.
631
Korhonen, L.K., V. Macías-Carranza, R. Abdala, F.L. Figueroa, and A. Cabello-Pasini. 632
2012. Effects of sulfide concentration, pH, and anoxia on photosynthesis and 633
respiration of Zostera marina. Ciencias Marinas 38: 625–633. 634
Lepoint, G., S. Millet, P. Dauby, S. Gobert, and J.M. Bouquegneau. 2002. Annual 635
nitrogen budget of the seagrass Posidonia oceanica as determined by in situ 636
uptake experiments. Marine Ecology Progress Series 237: 87–96. 637
Lepoint, G., M. Fontaine, P. Dauby, S. Gobert, and J.M. Bouquegneau. 2003. Carbon 638
and nitrogen isotopic ratios of the seagrass Posidonia oceanica: depth related 639
variations. Botanica Marina 46: 555-561. 640
Lee, K.-S., and K.H. Dunton. 1999. Inorganic nitrogen acquisition in the seagrass 641
Thalassia testudinum: development of a whole-plant nitrogen budget. Limnology
642
and Oceanography 44: 1204-1215.
27 Maier, C.M., and A.M. Pregnall. 1990. Increased macrophyte nitrate reductase activity 644
as a consequence of groundwater input of nitrate through sandy beaches. Marine 645
Biology 107: 263-271.
646
Marbá, N., M.A. Hemminga, M.A. Mateo, C.M. Duarte, Y. Mass, J. Terrados, and E. 647
Gacia. 2002. Carbon and nutrient translocation between seagrass ramets Marine 648
Ecology Progress Series 226: 287-300.
649
McGlathery, K.J., K. Sundback, and I.C. Anderson. 2007. Eutrophication in shallow 650
coastal bays and lagoons: the role of plants in the coastal filter. Marine Ecology 651
Progress Series 348: 1-18.
652
McGlathery, K.J. 2008. Seagrass habitats. In Nitrogen in the marine environment, ed. 653
D. G. Capone, D. A. Bronk, M. R. Mulholland, and E. J. Carpenter, 1037-1060. 654
Academic Press. 655
Neori, A. 2008. Essential role of seaweed cultivation in integrated multi-trophic 656
aquaculture farms for global expansion of mariculture: an analysis. Journal of 657
Applied Phycology 20: 567–570.
658
Newell, R.I.E., T.R. Fisher, R.R. Holyoke, and J.C. Cornwell. 2005. Influence of 659
Eastern oysters on nitrogen and phosphorus regeneration in Chesapeake Bay, 660
USA. In The Comparative Roles of Suspension Feeders in Ecosystems, NATO 661
Series: IV e Earth and Environmental Sciences, ed. R. Dame and S. Olenin,
93-662
120. Springer. 663
Olivé, I., J. Silva, M.M. Costa and R. Santos. 2015. Estimating seagrass community 664
metabolism using benthic chambers: the effect of incubation time. Estuaries and 665
Coasts. doi: 10.1007/s12237-015-9973-z.
666
Pedersen, M.F., and J. Borum. 1993. An annual nitrogen budget for a seagrass Zostera 667
marina population. Marine Ecology Progress Series 101: 169–177.
28 Pedersen, M.F., E.I. Paling, and D.I. Walker. 1997. Nitrogen uptake and allocation in 669
the seagrass Amphibolis antarctica. Aquatic Botany 56: 105-117. 670
Peterson, H., and K.L. Heck. 2001a. Positive interactions between suspension-feeding 671
bivalves and seagrass—a facultative mutualism. Marine Ecology Progress Series 672
213: 143-155. 673
Peterson, H., and K.L. Heck. 2001b. An experimental test of the mechanism by which 674
suspension feeding bivalves elevate seagrass productivity. Marine Ecology 675
Progress Series 218: 115-125.
676
Pillay, T.V.R. 2004. Aquaculture and the environment. Wiley-Blackwell. 677
Poumian-Tapia, M., and S.E. Ibarra-Obando. 1999. Demography and biomass of the 678
seagrass Zostera marina in a Mexican coastal lagoon. Estuaries 22: 879-889. 679
Rasmusson, L.M., and M. Björk 2014. Determining light suppression of mitochondrial 680
respiration for three temperate marine macrophytes using the Kok 681
method. Botanica Marina 57(6): 483-486. 682
Reusch, T.B.H., A.R.O. Chapman, and J.P. Gröger. 1994. Blue mussels Mytilus edulis 683
do not interfere with eelgrass Zostera marina but fertilize shoot growth through 684
biodepostion. Marine Ecology Progress Series 108: 265-282. 685
Ribas-Ribas, M., J.M. Hernández-Ayón, V.F. Camacho-Ibar, and others. 2011. Effects 686
of upwelling, tides and biological processes on the inorganic carbon system of a 687
coastal lagoon in Baja California. Estuarine, Coastal and Shelf Science 95: 367-688
376. 689
Rubio, L., A. Linares-Rueda, M.J. García-Sánchez, and J.A. Fernández. 2007. 690
Ammonium uptake kinetics in root and leaf cells of Zostera marina L. Journal of 691
Experimental Marine Biology and Ecology 352(2): 271–279.
29 Ruiz, J.M., C. Marco-Méndez, and J.L. Sánchez-Lizaso. 2010. Remote influence of 693
offshore fish farm waste on Mediterranean seagrass (Posidonia oceanica) 694
meadows. Marine Environmental Research 69: 118-126. 695
Sandoval-Gil, J.M., V.F. Camacho-Ibar, M.C. Ávila-López, J. Hernández-López, J.A. 696
Zertuche-González, and A. Cabello-Pasini. 2015.Dissolved inorganic nitrogen 697
uptake kinetics and δ15N of Zostera marina L. (eelgrass) in a coastal lagoon with 698
oyster aquaculture and upwelling influence. Journal of Experimental Marine 699
Biology and Ecology 472: 1-13.
700
Sharma, S., J. Goff, R.M. Moody, D. Byron, K.L. Heck Jr, S.P. Powers, C. Ferraro, and
701
J. Cebrian. 2016.Do restored oyster reefs benefit seagrasses? An experimental
702
study in the Northern Gulf of Mexico. Restoration and Ecology, doi:
703
10.1111/rec.12329.
704
Sharp, Z. 2005. Principles of stable isotope geochemistry. Prentice Hall. 705
Short, F.T. 1987. Effects of sediment nutrients on seagrasses: literature review and 706
mesocosm experiments. Aquatic Botany 27: 41–57. 707
Simenstad, C.A., and K.I. Fresh. 1995. Influence of intertidal aquaculture on benthic 708
communities in Pacific Northwest estuaries: scales of disturbance. Estuaries 18: 709
43-70. 710
Skinner, M. A., S.C. Courtenay, C.W. McKindsey, C.E. Carver, and A.L. Mallet. 2014. 711
Experimental determination of the effects of light limitation from suspended bag 712
oyster (Crassostrea virginica) aquaculture on the structure and photosynthesis of 713
eelgrass (Zostera marina). Journal of Experimental Marine Biology and Ecology 714
459: 169−180. 715
Stapel, J., T.L. Aarts, B.H.M. van Duynhoven, J.D. De Groot, P.H.W. van den Hoogen, 716
and M.A. Hemminga. 1996. Nutrient uptake by leaves and roots of the seagrass 717
30
Thalassia hemprichii in the Spermonde Archipelago, Indonesia. Marine Ecology
718
Progress Series 134: 195-206.
719
Stapel, J., and M.A. Hemminga. 1997. Nutrient resorption from seagrass leaves. Marine 720
Biology 128 (2): 197–206.
721
Tallis, H.M., J.L. Ruesink, B. Dumbauld, S. Hacker, and L.M. Wisehart. 2009. Oysters 722
and aquaculture practices affect eelgrass density and productivity in a Pacific 723
Northwest estuary. Journal of Shellfish Research 28: 251-261. 724
Terrados, J., and S.L. Williams. 1997. Leaf versus root nitrogen uptake by the surfgrass 725
Phyllospadix torreyi. Marine Ecology Progress Series 149: 267-277.
726
Touchette, B.W., and J.M. Burkholder. 2000. Review of nitrogen and phosphorus 727
metabolism in seagrasses. Journal of Experimental Marine Biology and Ecology 728
250: 133-167. 729
Touchette, B.W., and J.M. Burkholder. 2007. Carbon and nitrogen metabolism in the 730
seagrass, Zostera marina L.: environmental control of enzymes involved in 731
carbon allocation and nitrogen assimilation. Journal of Experimental Marine 732
Biology and Ecology 350: 216-233.
733
Vinther, H.F., and M. Holmer. 2008. Experimental test of biodeposition and ammonium 734
excretion from blue mussels (Mytilus edulis) on eelgrass (Zostera marina) 735
performance. Journal of Experimental Marine Biology and Ecology 364: 72-79. 736
Vinther, H.F., J.S. Laursen, and M. Holmer. 2008. Negative effects of blue mussel 737
(Mytilus edulis) presence in eelgrass (Zostera marina) beds in Flensborg fjord, 738
Denmark. Estuarine, Coastal and Shelf Science 77: 91-103. 739
Vonk, J.A., J.J. Middelburg, J. Stapel, and T.J. Bouma. 2008. Dissolved organic 740
nitrogen uptake by seagrasses. Limnology and Oceanography 53 (2): 542–548. 741
31 Wagner, E., B.R. Dumbauld, S.D. Hacker, A.C. Trimble, L.M. Wisehart, and J.L. 742
Ruesink. 2012. Density-dependent effects of an introduced oyster, Crassostrea 743
gigas, on a native intertidal seagrass, Zostera marina. Marine Ecology Progress
744
Series 468: 149-160.
745
Ward, D.H., A. Morton, T.L. Tibbitts, D.C. Douglas, and E. Carrera-González. 2003. 746
Long-term change in eelgrass distribution at Bahía San Quintín, Baja California, 747
Mexico, using satellite imagery. Estuaries 26: 1529-1539. 748
Wisehart, L.M., B.R. Dumbauld, J.L. Ruesink, and S.D. Hacker. 2007. Importance of 749
eelgrass early life history stages in response to oyster aquaculture disturbance. 750
Marine Ecology Progress Series 344: 71-80.
751
Yamamuro, M., Y. Umezawa, and I. Koike. 2004. Internal variations in nutrient 752
concentrations and the C and N stable isotope ratios in leaves of the seagrass 753
Enhalus acoroides. Aquatic Botany 79(1): 95-102.
754
Zertuche-González, J., V.F. Camacho-Ibar, I. Pacheco-Ruíz, A. Cabello-Pasini, L. 755
Galindo-Bect, J. Guzmán-Calderón, V. Macías-Carranza, and J. Espinoza-Avalos. 756
2009. The role of Ulva spp. as a temporary nutrient sink in a coastal lagoon with 757
oyster cultivation and upwelling influence. Journal of Applied Phycology 21: 729-758
736. 759
Zieman, J.C. 1984. Methods for the study of the growth and production of turtle grass 760
Thalassia testudinum König. Aquaculture 4: 139-143.
761 762 763 764 765 766
32 Figure captions
767
Fig. 1 (a) Map of San Quintín Bay indicating the location of the study sites (reference 768
and oyster sites) and the approximate distribution of oyster farms. (b) Photo of the 769
oyster site at low tide showing Zostera marina growing alongside off-bottom longlines 770
Fig. 2 Benthic chambers used to measure Zostera marina in situ (a) leaf uptake of 771
15NH
4+ and (b) leaf photosynthesis/respiration
772
Fig. 3 (a) Specific (Vleaf) and (b) absolute (Vab) uptake rates of 15NH4+ by Zostera
773
marina at the reference and oyster sites. Leaves are ranked from the youngest (leaf #1)
774
to the oldest (leaf #5). Significant differences are indicated by different letters. Values 775
are means and standard errors 776
Fig. 4 Variation of Z. marina net photosynthesis (net-P) with irradiance at the reference 777
and oyster sites. The upper panel (a) shows the variation in tide height, pH, and 778
temperature throughout the day. The daily P:R ratio of Z. marina leaves at each site is 779
presented in (b). Values are means and standard errors 780
Fig. 5 Natural isotopic nitrogen and carbon composition (δ15N, a; δ13C, b) and nutrient
781
content (% N, c; % C, d) of Z. marina leaves and rhizomes at the reference and oyster 782
sites. Leaves are ranked from the youngest (leaf #1) to the oldest (leaf #5). Significant 783
differences are indicated by different letters. Values are means and standard errors 784
Fig. 6 15N content of Z. marina leaves and rhizomes after in situ incubations (Ti, panel
785
a) and two weeks after incubations (Tf, panel b). Lines within the bars in panel a)
786
indicate the natural 15N content in eelgrass tissues at T0. Leaves are ranked from the
787
youngest (#1) to the oldest (#5). In the upper panels, schematic representations of the 788
different leaves within a shoot are presented; new tissue that developed during the two 789
weeks is differentiated (dashed columns) from old tissue. Leaf #0 corresponds to an 790
entirely new leaf produced after the incubation. Leaf #5 was lost two weeks after 791
33 incubation. Significant differences are indicated by different letters. Values are means 792
and standard errors 793
794
Tables 795
796
Table 1 Environmental parameters measured at the reference and oyster sites. 797
Significant differences (Student t-test) between sites are indicated by asterisks 798
(*p<0.05). Values are means and standard errors 799
800
Ref. site Oyster site
Irradiance (mol photons m-2 day-1), n=10 19.5 ± 2.1 18.2 ± 1.3 Temperature (oC), n=62 18.1 ± 0.2 18.0 ± 0.1 Salinity (practical salinity scale), n=62 33.7 ± 0.3 33.8 ± 0.5 Water-column [NH4+] (µM), n=6 0.6 ± 0.2 1.6 ± 0.3* Water-column [NO3-] (µM), n=6 0.47 ± 0.1 0.49 ± 0.1 Pore-water [NH4+] (µM), n=6 192 ± 16 422 ± 31* 801 802 803 804 805 806 807
34 Table 2 Vegetative descriptors and epiphyte coverage measured in leaves of Z. marina 808
at the reference and oyster sites, and collected two weeks after in situ incubations (see 809
Fig. 4). Leaves are ranked from the youngest (#0) to the oldest (#4). Values are means 810
and standard errors 811
812
Ref. site
Leaf #0 Leaf #1 Leaf #2 Leaf #3 Leaf #4
Leaf size (cm2) 10.5 ± 4.4 28.1± 3.7 36.4 ± 1.4 36.2 ± 2.5 25.5± 4.2 New leaf tissue (%) 100 57.9 ±10.3 38.6 ± 7.4 10.2 ± 2.6 0 Necrotic tissue (%) 0 0 5.3 ± 1.01 12.7 ± 3.34 32.2 ± 5.7
Epiphyte coverage (%) 0 0 0 18.1 ± 4.1 39.2 ± 3.3
Oyster site
Leaf #0 Leaf #1 Leaf #2 Leaf #3 Leaf #4
Leaf size (cm2) 7.4 ± 2.2 33.9 ± 2.6 43.9 ± 0.8 49.6 ± 3.6 38.3± 1.1 New leaf tissue (%) 100 71.6 ± 8.3 49.3 ± 7.4 5.3 ± 0.8 0
Necrotic tissue (%) 0 0 6.8 ± 2.01 8.5 ± 4.3 35.2 ± 8.7 Epiphyte coverage (%) 0 0 2.3 ± 0.2 13.2 ± 6.2 36.7 ± 9.1 813 814 815 816 817
35 Table 3 Vegetative parameters of Z. marina shoots and meadow structure measured at 818
the reference and oyster sites. Significant differences (Student t-test) between sites are 819
indicated by asterisks (*p<0.05; **p<0.01; ***p<0.001). Values are means and standard 820
errors 821
Ref. site Oyster site t p
Shoot size (leaf-cm2 shoot-1), n=10 165.8 ± 7.6 210.6 ± 8.1 -4.052 ***
Shoot growth (leaf-g DW shoot-1 day-1), n=10 0.005 ± 0.0002 0.009 ± 0.0004 6.295 *** Meadow density (shoots m-2), n=4 525 ± 27.3 340.6 ± 32.3 4.39 **
Aboveground biomass (g DW m-2), n=4 178.7 ± 0.2 144.7 ± 7.3 2.068 ns Belowground biomass (g DW m-2), n=4 93.1 ± 6.1 45.7 ± 4.7 6.181 *** Biomass ratio 1.92 ± 0.1 3.3 ± 0.5 -2.799 * 822 823 824 825 826 827 828 829 830 831 832 833 834
36 Figures 835 836 837 838 839 840 Fig. 1 841 842 843 844 845 846 847 848 849 850 851 852
37 853 854 855 Fig. 2 856 857 858 859 860 861 862 863 864 865 866 867 868