i
Digital Divide at Individual Level: Evidence for
Eastern and Western European Countries
Petya Rangelova Chipeva
Dissertation presented as partial requirement for obtaining
the Master’s degree in Statistics and Information
i
Title: Digital Divide at Individual Level: Evidence for Eastern and Western European Countries
Petya Rangelova Chipeva
MEGI
2016
ii
NOVA Information Management School
Instituto Superior de Estatística e Gestão de Informação
Universidade Nova de LisboaDigital Divide at Individual Level: Evidence for Eastern and Western
European Countries
by
Petya Rangelova Chipeva
Dissertation presented as a partial requirement for obtaining the Master’s degree in Statistics and Information Management, with a specialization in Information Analysis and Management
Co-Advisors: Tiago Oliveira Frederico Cruz-Jesus
iii
November 2016
ACKNOWLEDGEMENTS
MY MOST SINCERE THANKS TO:
FIRST AND FOREMOST, MY THESIS CO-ADVISORS, TIAGO OLIVEIRA AND FREDERICO CRUZ-JESUS, FOR THEIR TIME, SUPPORT, MOTIVATION, DEDICATION, IDEAS AND KNOWLEDGE SHARED.
SECOND, MY FRIEND DESSIE, FOR THE ENCOURAGEMENT AND EDITING HELP.
iv
ABSTRACT
The current study explores the digital divide by checking the phenomenon at the individual level. It digs into the individual pattern of adoption and use of a broad set of information and communications technologies (ICTs) by introducing a conceptual model combining the extended unified theory of acceptance and use of technology (UTAUT2) and the five-factor model of personality. Therefore, it provides insights on factors affecting technology adoption and the role of personality on individual usage behavior. Most of the UTAUT2 hypotheses are supported, with performance expectancy being the strongest predictor. Openness is a significant predictor of behavioral intention, whereas for usage behavior the significant personality predictors are openness, extraversion and agreeableness. Moreover, as data was collected in Bulgaria and Portugal, a multi-group analysis revealed significant country differences. The effect of performance expectancy, habit, agreeableness and neuroticism on behavioral intention, as well as the effect of age on usage, are stronger for Bulgaria, whereas the effect of hedonic motivation on behavioral intention and the effect of behavioral intention on usage are stronger for Portugal.
KEYWORDS
Information and communications technologies (ICTs); digital divide, extended unified theory of acceptance and use of technology (UTAUT2); personality
v
INDEX
1.
Introduction ... 1
2.
Theoretical Background ... 2
2.1.
The Digital Divide ... 2
2.2.
Adoption models at the individual level ... 4
2.3.
Personality traits ... 5
3.
Research model and hypotheses ... 8
4.
Data collection research methodology ... 12
4.1.
Measurement items ... 12
4.2.
Data collection ... 12
5.
Data analysis and results ... 14
5.1.
Measurement model ... 14
5.2.
Structural model and hypotheses testing ... 17
6.
Discussion ... 20
6.1.
Theoretical implications ... 20
6.2.
Practical implications ... 23
6.3.
Limitations and future research ... 24
7.
Conclusions ... 25
8.
Bibliography ... 26
9.
Appendix ... 32
9.1.
Appendix A - Instrument ... 32
vi
LIST OF FIGURES
Figure 1. Extended unified theory of acceptance and use of technology (UTAUT2) model. .... 5
Figure 2. Conceptual model ... 11
vii
LIST OF TABLES
Table 1. ICTs and support ... 3
Table 2. Summary of previous research on personality traits in technology adoption context
published on peer review journals ... 7
Table 3 Sample characteristics ... 13
Table 4. AVE, CR, Cronbach’s alpha and loadings ... 15
Table 5. Fornell-Larcker Criterion ... 16
Table 6. VIF, outer weights and outer loadings ... 17
Table 7. Structural model with path coefficients and R2 for UTAUT2 model, Personality
model and UTAUT2 + Personality model ... 18
Table 8. PLS Multi-group analysis... 19
viii
LIST OF ABBREVIATIONS AND ACRONYMS
DOI Theory of diffusion of innovations
FFM Five factor model
ICT Information and communication technologies
IDC International Data Corporation
ITU International Telecommunication Union
MM Motivational model
MPCU PC utilization model
NTIA National Telecommunications and Information Administration
SCT Social cognitive theory
TAM Technology acceptance model
TPB Theory of perceived behavior
TRA Theory of reasoned action
UNDP United Nations Development Program
UTAUT Unified theory of acceptance and use of technology
1
1. INTRODUCTION
Information and communication technologies (ICTs) become more integrated across all sectors of economy and society (European Commission, 2015). Research has shown that investment in ICTs is associated with economic benefits, such as higher productivity, lower costs, new economic opportunities, job creation, innovation and increased trade. ICT also help provide better services in health and education, and strengthen social cohesion (World Bank, 2014). According to the International Telecommunications Union (ITU, 2014), ICTs will continue to play a major role in facilitating access to information, knowledge and key services. As more and more people join the information society and high-speed communication networks, the tracking and measurement of ICTs developments becomes even more relevant. Continuous monitoring and measurement of ICTs developments will help to identify progress and gaps.
The advancement and diffusion of technologies has evolved at historical rates. For example, global internet penetration grew from 6.5% in 2000 to 47% in 2016 and many developed countries are experiencing penetration rates of more than 90% (ITU, 2015, 2016). The ongoing development of ICTs in all its forms and applications is driving radical change in our lives, with the constant creation of new products and services, new ways of conducting business, new markets and investment opportunities, new social and cultural expressions and new channels for citizens and government to interact (OECD,2003). Hence, the continued existence of a digital divide, however defined, is an obstacle to any agenda of social inclusion. If societies are today partly, and will in the future more or less be completely structured around ICTs, then the demand of economic efficiency as well as social and political equity, require that no social group finds itself excluded from participation (Alvares et al., 2014). Hence, understanding how ICTs are adopted can help in reducing the digital divide.
This study explores the digital divide phenomenon from the perspective of individual ICTs acceptance. It digs into the individual pattern of behavioral intention and usage behavior of a set of ICTs. Therefore, its main contributions are threefold: Firstly, it adds to the current knowledge on digital divide by checking the phenomenon in a broader context at the individual level. Secondly, the study proposes a theoretical model for the acceptance of the ICTs at the individual level that combines the extended unified theory of acceptance and use of technology (UTAUT2) (Venkatesh, Thong, & Xu, 2012) with the big five personality traits (Costa & McCrae, 1992; Digman, 1990). By doing so, it provides insights on factors affecting the adoption of technologies and explores if and how the big five personality traits (openness, extraversion, agreeableness, conscientiousness and neuroticism) influence usage behavior, empirically testing its applicability in the context of Eastern and Western European countries. Thirdly, it aims at identifying what factors in the proposed model differ the most across cultures (in the context of Eastern and Western European countries).
The remainder of the paper is structured as follows. Firstly, a theoretical background of the problem is presented, introducing the concept of digital divide, previous research on the phenomenon, overview of adoption models at the individual level and personality traits concept. Secondly, a research model is proposed and hypotheses are developed. Thirdly, the research method is described and study results are exhibited. Finally, a discussion, implications and conclusions are presented.
2
2. THEORETICAL BACKGROUND
2.1. T
HED
IGITALD
IVIDEThe digital divide is a complex phenomenon that hinges on many different factors (Hilbert, 2011). Initially, the digital divide was defined as the gap between “those who have access to digital
ICT and those who do not” (OECD, 2001). Studies conducted in the 1990s were primarily concerned
with issues surrounding access, where access was measured in terms of having a computer at home that connects to the internet. Representative surveys of this period that were focused on the number and categories of people with access to a computer and Internet, are the first “Falling Through the Net” reports from the US Department of Commerce's National Telecommunications and Information Administration (NTIA) (US Department of Commerce, 1995, 1998, 1999). However, since the year 2002, the physical access among the different categories of people in the developed countries started to decline (US Department of Commerce, 2000). Therefore, an increasing number of researchers suggested reframing the overly technical concept of the digital divide, to go beyond access and pay more attention to social, psychological and cultural backgrounds (van Dijk, 2006). DiMaggio, et.al. (2004) were among the first to expand the context of digital divide by referring to not just differences in access (later labeled as the first-order digital divide), but autonomy of use, skill, social support and the purposes for which the technology is employed, labeled as the second-order digital divide. Indeed, as the majority of the participants in any social system have obtained access to a technology, the second order divide starts to become more important than the first order divide (Dewan & Riggins, 2005).
The digital divide is, therefore, a multidimensional and complex phenomenon that extends beyond access to technology and incorporates several perspectives. Previous research on issues related to the digital divide has been conducted at three levels of analysis: the individual level, organizational level, and global level (Dewan & Riggins, 2005). In this paper the phenomenon is analyzed at the individual level and the concept ‘digital divide’ refers to the difference in usage of ICTs, and correspondingly to information content and any socio-economic opportunities related to it. In terms of indicators used to measure the digital divide, these have changed over time due to the changing characteristics and introduction of new ICTs applications. Over time international institutions tracking digital development have been introducing new indicators to measure the information society. While indicators initially concentrated on access and connectivity issues, their scope has later been extended to cover new product groups and means of delivering communication technologies to end-users (Eurostat, 2013). For example, in its latest module examining the information society, Eurostat’s statistics includes the use of cloud computing services. Studies have examined digital divide in the context of various technologies, e.g., there are studies that focus on differences in Internet use (Brandtzæg, Heim, & Karahasanović, 2011; Zhang, 2013), mobile devices adoption (see, e.g., Lee, Park, & Hwang, 2015; Magsamen-Conrad, Upadhyaya, Joa, & Dowd, 2015; Shim, You, Lee, & Go, 2015), advanced e-services (see, e.g., Akhter, 2003; Chong, Chan, & Ooi, 2012; Gulati, Williams, & Yates, 2014; Hung, Chang, & Kuo, 2013), social networks (Hargittaia & Hsiehb, 2010), among others. Research in the digital divide has often used variables from international institutions such as the EUROSTAT, the OECD, the World Bank, the United Nations Development Program (UNDP), the International Data Corporation (IDC), and the International Telecommunication
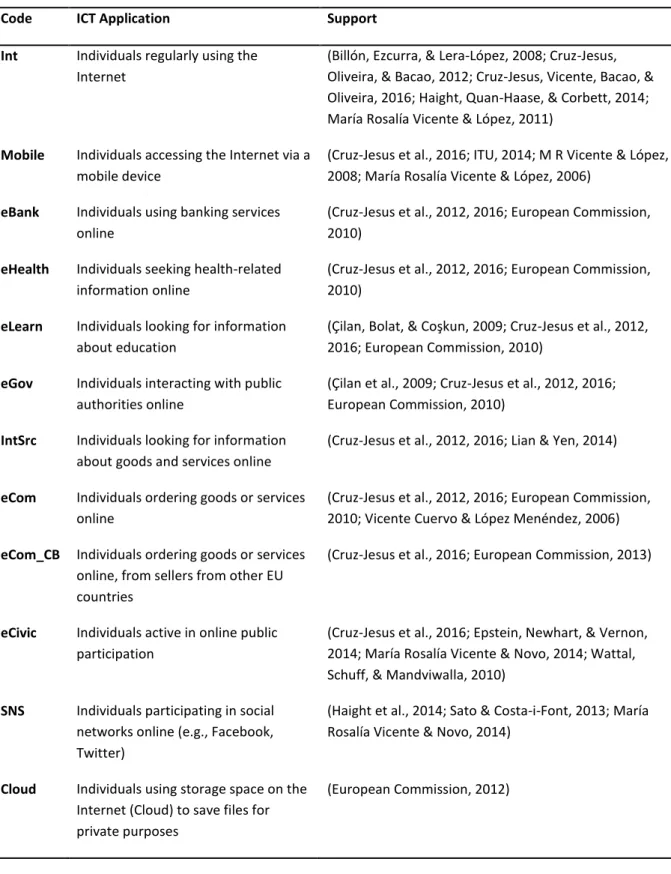
3 Union (ITU) to measure the phenomenon. The indicators applied to measure technology use are based on the research literature and are described in Table 1.
Table 1.ICTs and support
Code ICT Application Support
Int Individuals regularly using the Internet
(Billón, Ezcurra, & Lera-López, 2008; Cruz-Jesus, Oliveira, & Bacao, 2012; Cruz-Jesus, Vicente, Bacao, & Oliveira, 2016; Haight, Quan-Haase, & Corbett, 2014; María Rosalía Vicente & López, 2011)
Mobile Individuals accessing the Internet via a
mobile device
(Cruz-Jesus et al., 2016; ITU, 2014; M R Vicente & López, 2008; María Rosalía Vicente & López, 2006)
eBank Individuals using banking services
online
(Cruz-Jesus et al., 2012, 2016; European Commission, 2010)
eHealth Individuals seeking health-related
information online
(Cruz-Jesus et al., 2012, 2016; European Commission, 2010)
eLearn Individuals looking for information
about education
(Çilan, Bolat, & Coşkun, 2009; Cruz-Jesus et al., 2012, 2016; European Commission, 2010)
eGov Individuals interacting with public
authorities online
(Çilan et al., 2009; Cruz-Jesus et al., 2012, 2016; European Commission, 2010)
IntSrc Individuals looking for information
about goods and services online
(Cruz-Jesus et al., 2012, 2016; Lian & Yen, 2014)
eCom Individuals ordering goods or services
online
(Cruz-Jesus et al., 2012, 2016; European Commission, 2010; Vicente Cuervo & López Menéndez, 2006) eCom_CB Individuals ordering goods or services
online, from sellers from other EU countries
(Cruz-Jesus et al., 2016; European Commission, 2013)
eCivic Individuals active in online public
participation
(Cruz-Jesus et al., 2016; Epstein, Newhart, & Vernon, 2014; María Rosalía Vicente & Novo, 2014; Wattal, Schuff, & Mandviwalla, 2010)
SNS Individuals participating in social networks online (e.g., Facebook, Twitter)
(Haight et al., 2014; Sato & Costa-i-Font, 2013; María Rosalía Vicente & Novo, 2014)
Cloud Individuals using storage space on the
Internet (Cloud) to save files for private purposes
4
2.2. A
DOPTION MODELS AT THE INDIVIDUAL LEVELSeveral technology acceptance theories and models have been developed and used to better understand the aspects that influence information technology acceptance in terms of behavioral intention (BI) and usage. One of the first frameworks to address technology acceptance is the theory of diffusion of innovations (DOI) (Rogers, 1995), which investigates innovations' characteristics that influence its adoption. These are the theory of reasoned action (TRA), for example, states that an individual’s behavioral intentions determine his or her actual behavior. Behavioral intention is in turn determined by the individual’s attitude toward this behavior and subjective norms with regard to the performance of this behavior (Fishbein & Ajzen, 1975). Based on the theory of reasoned action, (Davis, 1989) developed the technology acceptance model (TAM) to find out what factors cause people to accept or reject an information technology on the job. He suggests that perceived usefulness and perceived ease of use are the two most important individual beliefs about using an information technology. The theory of perceived behavior (TPB) is also based on the TRA and developed by Ajzen (1991), who adds a new construct - perceived behavioral control defined as the perceived ease or difficulty of performing the behavior.
Considering the lack of a unified view on technology acceptance theory Venkatesh et al. (2003) combined previous acceptance models and introduced the unified theory of acceptance and use of technology (UTAUT) built on eight previously developed theories: TRA, TAM, the motivational model (MM) (Davis, Bagozzi, & Warshaw, 1992) TPB, the PC utilization model (MPCU) (Thompson, Higgins, & Howell, 1991), DOI (Rogers, 1995) and social cognitive theory (SCT) (Compeau & Higgins, 1995), and an integrated model of technology acceptance and planned behavior (TAM-TPB) (Taylor & Todd, 1995). The model proposes four constructs: performance expectancy, effort expectancy, social influence, and facilitating conditions. Besides it proposes four moderator variables, that is, gender, age, experience, and voluntariness of use.
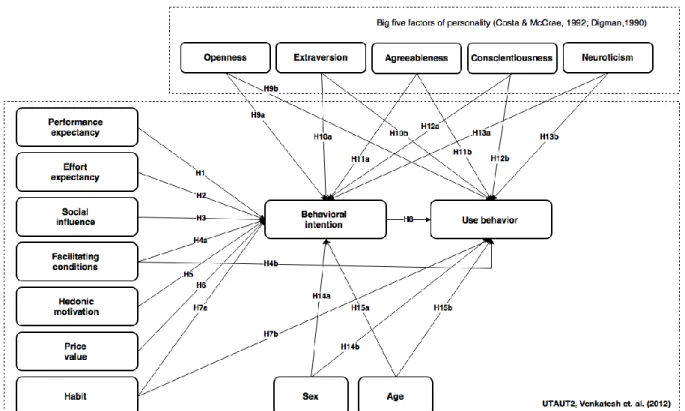
Later on Venkatesh et al. (2012) revise the UTAUT and adapt the original model to the context of consumer services, adding three new factors: hedonic motivations, cost, and habit. The model is composed of seven constructs: performance expectancy, effort expectancy, social influence, facilitating conditions, hedonic motivation, price value, and habit (please, see Figure 1). Like in UTAUT there are moderating variables (age, gender, and experience), but the voluntariness is dropped. Experience is proposed to moderate as well the effect of behavioral intention on use. Another change is that UTAUT2 facilitating conditions influence not only actual behavior (like in UTAUT), but also behavioral intention. The construct of habit is also hypothesized to influence both behavioral intention and actual usage.
5 Figure 1. Extended unified theory of acceptance and use of technology (UTAUT2) model.
2.3. P
ERSONALITY TRAITSPersonality refers to an individual’s unique internal traits (Walczuch & Lundgren, 2004). Prior research on personality has demonstrated a lot of traits that have been a subject of investigation since 1930, when 4500 descriptive terms have been identified for personality by Allport & Odbert (1936). Although a universal view on the dimensions of personality lacks, it is widely accepted among psychologists that the domain of personality can be described by five constructs (Barrick, Mount, & Judge, 2001; Digman, 1990). This theoretical approach to personality classification has become known as the Five Factor Model (FFM) and its dimensions are referred to as the big five. It consists of five broad personality traits, namely, openness, extraversion, agreeableness, conscientiousness and neuroticism. These basic tendencies are inborn and develop throughout one’s lifespan, influencing an individual’s thoughts, feelings, and actions (Costa, & McCrae, 1992).
Research in social psychology has shown that personality traits often determine an individual’s beliefs and behavior across different aspects of life (Digman, 1990). Studies have tested the role of personality in a variety of contexts, like behavior in trading activities (Kleine, Wagner, & Weller, 2015), eco-friendly behavior (Fraj & Martinez, 2006; Kvasova, 2015), social networks use (see e.g., Amichai-Hamburger & Vinitzky, 2010; Hughes, Rowe, Batey, & Lee, 2012; Kokkinos, Baltzidis, & Xynogala, 2016).
There has been a growing interest in personality as an explanatory tool in technology acceptance (Li, Tan, Teo, & Tan, 2006). Although a number of studies have researched links between personality and technology use (see e.g., Behrenbruch, Söllner, Leimeister, & Schmidt, 2013; Tang, Chen, Yang, Chung, & Lee, 2016) this area of research is still scarce. In light of his gap in the
6 technology acceptance literature, one of the contributions of this paper is to expand the knowledge in the area and incorporate personality in the UTAUT2 in order to examine if and how personality influences technology adoption. It analyzes the effects of personality not as an external variable that may impact intention and use through the other constructs of UTAUT2, but as directly affecting intention and use.
Table 2 summarizes previous research on personality regarding technology adoption. It shows the research model applied (where applicable), main findings in terms of significant personality predictors and the technology context of the research. Although Information Systems (IS) research has demonstrated the relevance of personality regarding technology adoption behaviors, e.g. within the framework of TAM, the extant research is still scant. Of the illustrative studies shown in table 2, personality traits are examined as having an impact on behavioral intention via other constructs and only one paper (Picazo-Vela, Chou, Melcher, & Pearson, 2010) hypothesizes a direct effect of
personality on behavioral intention. As for the papers where personality is not incorporated in an established technology adoption model, the direct relationship between personality traits and ICT use is examined. Therefore, one of the contributions of the current study is that it hypothesizes direct relationships to both behavioral intention and usage behavior.
7 Table 2. Summary of previous research on personality traits in technology adoption context published on peer review journals
Reference Underlying theory/Relationship Main findings Technology
context (Landers &
Lounsbury, 2006)
Examines the relationship between personality traits and Internet use
Internet use was negatively related to
agreeableness, conscientiousness, and extraversion as well as two narrow traits – optimism and work drive, and positively related to tough-mindedness
Internet use
(Devaraj, Easley, & Grant, 2008)
TAM and big five personality traits conscientiousness, extraversion, neuroticism and agreeableness affect perceived usefulness and subjective norms towards the acceptance and use of technology commercial collaborative system (e-project) (Butt & Phillips, 2008)
Examines the relationship between personality and mobile phone use
agreeableness, extraversion and neuroticism explain patterns of mobile phone use
mobile phones use (Hunsinger, Poirier, & Feldman, 2008)
Examines the relationship between personality and attitudes towards Individual response technology (IRT) use
extraversion and conscientiousness are positively related to IRT use
Individual response technology
(Picazo-Vela et al., 2010)
TPB and big five personality framework
neuroticism and conscientiousness are significant predictors of an individual’s intention to provide an online review providing an online review (Amichai-Hamburger & Vinitzky, 2010)
Examines how personality is related to behavior on Facebook
each of the personality factors examined is relevant to aspects of Facebook use
Facebook (Svendsen, Johnsen, Almås-Sørensen, & Vittersø, 2011)
TAM and the big five personality traits
extraversion has significant, positive relations to BI; neuroticism is related to BI; openness to experience is significantly and positively related to perceived ease of use, but does not influence BI
a software tool designed to take care of digital contents, like images, music and files (Terzis, Moridis, & Economides, 2012)
Computer Based Assessment Acceptance Model (CBAAM) and big five personality framework
neuroticism has significant negative effect on perceived usefulness and on goal expectancy; agreeableness determines social influence and perceived ease of use, conscientiousness defines perceived ease of use; extroversion and openness explain perceived importance
computer based assessment (Xu, Frey, Fleisch, & Ilic, 2016)
Examines impact of the big five personality traits on mobile applications use
personality traits have significant impact on the adoption of different types of mobile apps
mobile apps
(Tang et al., 2016)
Examines the relationship between the big five personality traits on Facebook use
agreeableness, conscientiousness, and neuroticism were negatively associated with Facebook addiction
(Noë, Whitaker, Chorley, & Pollet, 2016)
Examines relationship between personality and online check-ins in common locations by location-based social networks (LBSNs)
conscientious, open or agreeable people tended to have checked-in locations in common; neurotic individuals did not tend to have locations in common
location-based social networks (LBSNs):Four square
8
3. RESEARCH MODEL AND HYPOTHESES
The research model used in this study combines the UTAUT2 with the big five theory of personality traits. The UTAUT2 model has shown to improve the variation explained in behavioral intention and usage behavior compared to UTAUT (Venkatesh et al., 2012) and is hence chosen for this study. Having in mind that personality may affect individual’s adoption of ICT as shown in Table 1, personality traits are also used in our research model.
Performance expectancy is the degree to which an individual believes that using a technology provides benefits in performing certain activities and is considered to be similar to the perceived usefulness of TAM (Venkatesh et al., 2003). The performance expectancy construct has proved to be the strongest predictor of use intention (Venkatesh et al., 2003, 2012). In the context of the predefined set of ICTs, we believe that individuals will tend to adopt technologies due to perceived performance improvements and benefits. Therefore, we hypothesize that:
H1: The impact of performance expectancy (PE) on behavioral intention (BI) will be positive. Effort expectancy is the degree of ease associated with the use of technologies (Venkatesh et al., 2003) and it has proven to be a significant predictor of intention to use ICTs (Venkatesh et al., 2012). If a system is perceived as an easy to use, there is a higher likelihood that it will be accepted by users (Davis, 1989). Hence, in the context of ICT, we believe this construct will play a key role. As demonstrated by Venkatesh et al. (2003, 2012), effort expectancy is an ICT key driver as it positively convinces individuals to overcome ICT complexity. Therefore, we hypothesize:
H2: The impact of effort expectancy (EE) on behavioral intention (BI) will be positive
Social influence is the extent to which individuals perceive that others, especially friends and family, believe they should use technologies (Venkatesh et al., 2003, 2012). It is considered to be similar to subjective norm of TRA. It has been validated as a significant predictor of intention (Venkatesh et al., 2003, 2012). Technologies have become an indispensable way for individuals to create new ways to communicate, aggregate, and share information. Therefore, information and opinions obtained through social network usage for example, might affect and individual’s intention to adopt a certain technology and we hypothesize the following:
H3: The impact of social influence (SI) on behavioral intention (BI) will be positive.
Facilitating conditions refers to how people believe that technical infrastructures exist to help them to use the system whenever necessary (Venkatesh et al., 2003). ICT usage is related to having digital skills varying from basic ones (low-level individual know-how for elementary uses of ICT) to more complex capabilities (higher-level literacy for creative engagement in digital media and ability for ICT-mediated interaction) (Mendonça, Crespo, & Simões, 2015). A lack of such skills would make individuals perceive a difficulty in ICT use, so the presence of a favorable set of facilitating conditions would positively influence users in their decision to adopt ICTs. Therefore, we hypothesize:
H4a: The impact of facilitating conditions (FC) on behavioral intention (BI) will be positive. H4b: The impact of facilitating conditions (FC) on usage behavior (UB) will be positive.
9 Hedonic motivation is defined as the fun or pleasure derived from using a technology (Venkatesh et al., 2012). It has been demonstrated that hedonic motivation is a relevant predictor of technology adoption (Childers, Carr, Joann, & Carson, 2001; Heijden, 2004). Therefore, we hypothesize:
H5: The impact of hedonic motivation (HM) on behavioral intention (BI) will be positive.
Price value is the consumers’ cognitive trade-off between the perceived benefits of using a technology and the monetary cost of using it (Venkatesh et al., 2012). The concept of price value is defined as ‘‘consumers’ cognitive trade-off between the perceived benefits of the applications and the monetary cost for using them’’ (Dodds, Monroe, & Grewal, 1991). In the context of the following study, the respondents bare the cost of the ICTs in question, like device costs or fees to service provider companies. Therefore, we hypothesize:
H6: The impact of price value (PV) on behavioral intention (BI) will be positive.
Habit reflects the multiple results of previous experiences (Venkatesh et al., 2012). UTAUT2 adopts the concept of habit from (Limayem, Hirt, & Cheung, 2007), who consider habit as a self-reported perception and show that habit has a direct effect on technology use. Once a behavior becomes a habit, it becomes automatic and is practiced without conscious decision (Ouellette & Wood, 1998). Therefore, when habit is stronger individuals would rely more on their habit rather than external information and conscious decisions Therefore,
H7a: The impact of habit (HB) on behavioral intention (BI) will be positive. H7b: The impact of habit (HB) on usage behavior (UB) will be positive.
UTAUT2 is consistent with previous models and maintains that behavioral intention has a substantial influence on technology use (Venkatesh et al., 2003). Therefore, it can be postulated that:
H8: The impact of behavioral intention (BI) on usage behavior (UB) will be positive. As for those constructs originated from personality traits, we have:
Openness is one of the big five personality traits and represents one’s receptivity to new ideas and experiences (Korukonda, 2007). It is a characteristic of individuals who have broad interests, seek novelty, who are creative, original, curious, flexible, adventurous and non-conformists (Li et al., 2006). Furthermore, Korukonda (2007) found out that openness to experience results into lower levels of computer anxiety and McElroy et.al. (2007) showed that open people use Internet more intensively. Therefore, as individuals who score high on openness are non-conformists and experimentalist in nature, we hypothesize:
H9a: Openness to experience (OPE) will positively affect behavioral intention (BI) H9b: Openness to experience (OPE) will positively affect usage behavior (UB)
In general extraverts are adventurous, sociable and talkative, whereas introverts are typically quiet and shy (Costa, & McCrae, 1992). Those high in extraversion naturally care about their image, have larger social networks and like presenting themselves to others. It is more likely that those who score high on extraversion are more active on social networks and similar technologies, therefore
10 having bigger information exposure to new technologies due to bigger social networks. Besides, other characteristics of extraverts are dominance and ambition (Judge, Higgins, Thoresen, & Barrick, 1999), implying that extraverts may consider advantages and gains from technology adoptions as more important than introverts would.
H10a: Extraversion (EXS) will positively affect behavioral intention (BI) H10b: Extraversion (EXS) will positively affect usage behavior (UB)
The personality trait agreeableness refers to the level of empathy, compassion, warmth and generosity of an individual (Costa, & McCrae, 1992). Individuals that score high on agreeableness, exhibit lower level of computer anxiety (Korukonda, 2007). Besides, more agreeable individuals are more likely to relate to technology beliefs when the technology is related to collaboration and cooperation (Devaraj et al., 2008) and tend to build trust in service providers more easily in exchange for the service providers’ trust in them (Walczuch & Lundgren, 2004). Therefore, agreeable people are more likely to build positive beliefs about technology adoption and we hypothesize that:
H11a: Agreeableness (AGR) will positively affect behavioral intention (BI) H11b: Agreeableness (AGR) will positively affect usage behavior (UB)
Conscientious people are better organized and efficient in carrying out tasks, self-discipline is a major characteristic of a conscientious person (Costa, & McCrae, 1992). Individuals that score high on conscientiousness are self-motivated, achievement-oriented, systematic and task-oriented (Barrick, 2001). Thus, it is likely that more conscientious people would use technologies more to achieve goals, cooperate with others, and obtain information. Therefore, we hypothesize:
H12a: Conscientiousness (CON) will positively affect behavioral intention (BI) H12b: Conscientiousness (CON) will positively affect usage behavior (UB)
Individuals who score high on Neuroticism are considered to be more sensitive and nervous with a propensity to worry (Costa, & McCrae, 1992). Neurotic people are less able to control impulses, hardly cope with stress, and respond emotionally to situations that would not influence most people (McCrae & John, 1992). It has also been shown that neurotic individuals show higher levels of computer anxiety (Korukonda, 2007). Therefore, those who score high on neuroticism tend to worry that things go wrong easily and regard technologies as stressful. So, we hypothesize that:
H13a: Neuroticism (NEU) will negatively affect behavioral intention (BI) H13b: Neuroticism (NEU) will negatively affect usage behavior (UB)
In terms of demographic variables, the model includes sex and age. Although some studies have shown that one gender tend to use technologies more than the other, over time research has demonstrated that this gap is closing in a broader context of technology use(Lee et al., 2015). In the context of the numerous ICTs used in this study, we hypothesize that:
H14a: Sex will have no impact on behavioral intention (BI) H14b: Sex will have no impact on usage behavior (UB)
Generation differences have been studied in several technology adoption papers. Age has proven to be a significant predictor in intention and usage in the context of technology use (see e.g.,
11 Lian & Yen, 2014; Magsamen-Conrad et al., 2015; Niehaves & Plattfaut, 2013). Therefore, we hypothesize:
H15a: Age will negatively affect behavioral intention (BI) H15b: Age will negatively affect usage behavior (UB)
The proposed conceptual model applied in this study was built on the above listed hypotheses and is shown in Figure 2.
12
4. DATA COLLECTION RESEARCH METHODOLOGY
4.1. M
EASUREMENT ITEMSAll items used to measure the model constructs were adapted from the literature with slight modifications to fit the context of the ICT in question. PE, EE, SI, FC and BI were adopted from (Venkatesh et al., 2003, 2012), HM, PV and HB from (Venkatesh et al., 2012). As for the personality traits, they were operationalized using a short 20-item version of the 50-item international personality item pool - five-factor model measure - the mini-IPIP developed by Donnellan et al. (2006). This scale showed convergent, discriminant, and criterion-related validity with other big five measures (Cooper, Smillie, & Corr, 2010). The advantages of shortened versions of questionnaires include low cost and the short time that it takes to fill them, which makes it possible to include personality measurement in studies whose time is limited, such as those conducted online (Gosling, Rentfrow, & Swann, 2003). Moreover, four socio-demographic questions related to gender, age, income and professional status were included in the questions.
Most items were measured using seven-point range scales, ranging from totally disagree (1) to totally agree (7). Behavioral intention (BI) was measured by asking respondents about their intentions and plans to use the technology in the future. Personality traits were measured on a seven-point range scale, ranging from very inaccurate (1) to very accurate (7). Usage behavior was measured by asking respondents about their frequency of use of a set of ICTs, ranging from (1) never to (7) many times per day. Age was measured in years. Gender was coded using a 0 or 1 dummy variable where 1 represented women. All constructs were modelled using reflective indicators, except for usage behavior, which was measured by formative indicators. The items for all constructs are included in the Appendix A.
4.2. D
ATA COLLECTIONThe questionnaire drawn upon the literature was initially developed in English. The English questionnaire was then translated to Bulgarian and Portuguese respectively by professional native translators. An online questionnaire survey approach was employed. The online questionnaire was send via email to alumni university group in Bulgaria and Portugal respectively. Participation in the survey was voluntarily.
Initially, a pilot study was conducted to test the measurement instrument. Its purpose was to verify the reliability and validity of the measurement scales and check whether the interpretation and answering of the questions was clear to respondents. The pilot survey was answered by 30 respondents, confirming preliminary validity and reliability of the measurement instrument. All items were kept, few were slightly modified to avoid ambiguity issues and ensure clear interpretation.
Data was collected in Bulgaria and Portugal in June – July 2016. In June 2016 a survey was addressed to 2,362 (976 in Bulgaria and in 1386 Portugal). Although some cultural differences in the two audiences addressed were expected, it was reasonable to assume that the two samples were compatible in terms of background and work experience. The total number of complete answers received was 498 (254 for Bulgaria and 244 for Portugal). Hence, the initial response rates were 26.1
13 % in Bulgaria and 17.6% in Portugal. After removing all incomplete answers, the final number of valid answers was 245 (Bulgaria) and 229 (Portugal) respectively. Therefore, the total sample has 474 valid answers.
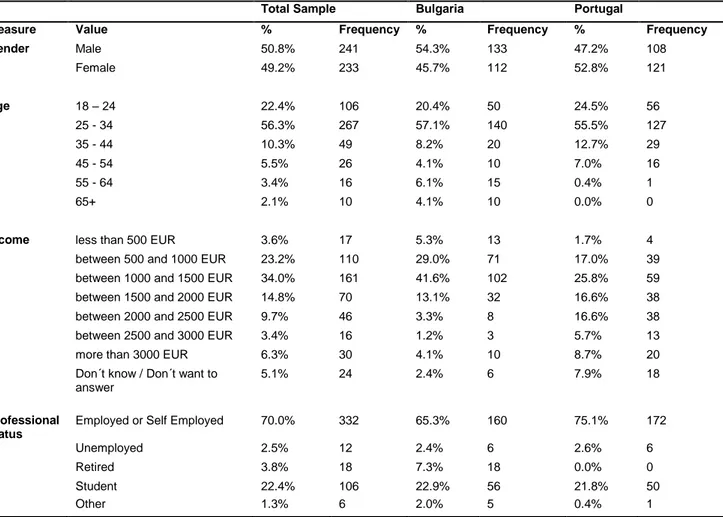
Table 3 shows sample characteristics for the total sample, as well as for the Bulgarian and Portuguese samples. Referring to the total sample, the split between male and female participants is respectively 50.8% vs 49.2%, representing a sample almost equally distributed by gender, with a marginal surplus of men. The largest group of respondents belongs to the 25-34 age group (56.3%), which is also the largest group in the subsamples per country. It can be noted that while in Bulgaria there are representatives from the last two age groups (55-64 and 65+) corresponding to 6.1% and 4.1%, for the Portuguese sample the participation of these age groups amounts to 0.4% and 0%. The majority of respondents have reported to be employed (70.0%).
Table 3 Sample characteristics
Total Sample Bulgaria Portugal
Measure Value % Frequency % Frequency % Frequency
Gender Male 50.8% 241 54.3% 133 47.2% 108 Female 49.2% 233 45.7% 112 52.8% 121 Age 18 – 24 22.4% 106 20.4% 50 24.5% 56 25 - 34 56.3% 267 57.1% 140 55.5% 127 35 - 44 10.3% 49 8.2% 20 12.7% 29 45 - 54 5.5% 26 4.1% 10 7.0% 16 55 - 64 3.4% 16 6.1% 15 0.4% 1 65+ 2.1% 10 4.1% 10 0.0% 0
Income less than 500 EUR 3.6% 17 5.3% 13 1.7% 4
between 500 and 1000 EUR 23.2% 110 29.0% 71 17.0% 39 between 1000 and 1500 EUR 34.0% 161 41.6% 102 25.8% 59 between 1500 and 2000 EUR 14.8% 70 13.1% 32 16.6% 38 between 2000 and 2500 EUR 9.7% 46 3.3% 8 16.6% 38 between 2500 and 3000 EUR 3.4% 16 1.2% 3 5.7% 13
more than 3000 EUR 6.3% 30 4.1% 10 8.7% 20
Don´t know / Don´t want to answer
5.1% 24 2.4% 6 7.9% 18
Professional status
Employed or Self Employed 70.0% 332 65.3% 160 75.1% 172
Unemployed 2.5% 12 2.4% 6 2.6% 6
Retired 3.8% 18 7.3% 18 0.0% 0
Student 22.4% 106 22.9% 56 21.8% 50
14
5. DATA ANALYSIS AND RESULTS
In the current study measurement model validation and structural model testing were conducted using partial least squares (PLS), a variance-based structural equation modelling technique. This technique is chosen over the covariance-based structural equation modelling as it is less demanding on the sample size and distribution and allows the use of formatively measured constructs (Henseler, Ringleand, & Sinkovics, 2009). To assess the measurement and structural model, SmartPLS software was used (Ringle, Wende, & Becker, 2015).
5.1. M
EASUREMENT MODELThe conceptual model has both reflective and formative constructs. First, reflective measures are analyzed for indicator reliability composite reliability, convergent and discriminant validity. Second, formative measures are tested for collinearity issues, significance and relevance of outer weights.
To confirm indicator reliability outer loadings were analyzed. The criteria that all outer loadings should be preferably higher than 0.7 and the ones below 0.4 have to be eliminated has been applied (Churchil, 1979; Henseler et al., 2009). CON2R, NEU1, and NEU3 were dropped due to low outer loadings. All other indicators have outer loadings higher than 0.7, with the exception of EXS4R with an outer loading value of 0.67, which is on the threshold. Besides, all indicators are statistically significant at 0.05 as illustrated in Table 4. Therefore, indicator reliability can be confirmed. To assess the construct’s reliability, we examined the composite reliability (CR) and Cronbach’s alpha (Table 4). The CR and Cronbach’s alpha are higher than the cut-off of 0.7. Therefore, both criteria are met and internal consistency is ensured (Hair & Anderson, 2010). Convergence validity has been validated against the criteria that average variance extracted (AVE) should be higher than 0.5 (Fornell & Larcker, 1981; Henseler et al., 2009). As shown in Table 4, this criterion is met.
15 Table 4. AVE, CR, Cronbach’s alpha and loadings
Construct Item AVE CR Cronbach's
alpha
Loading t-statistics
Performance expectancy (PE) PE1 0.885 0.969 0.957 0.927 87.328
PE2 0.948 126.739
PE3 0.950 121.650
PE4 0.939 95.616
Effort expectancy (EE) EE1 0.890 0.970 0.959 0.944 132.026
EE2 0.948 161.064
EE3 0.954 161.784
EE4 0.928 107.588
Social influence (SI) SI1 0.740 0.919 0.881 0.883 57.239
SI2 0.899 79.907 SI3 0.742 23.065 SI4 0.908 89.059 Facilitating conditions (FC) FC1 0.771 0.931 0.901 0.879 42.520 FC2 0.893 72.156 FC3 0.884 50.980 FC4 0.856 37.691 Hedonic motivation (HM) HM1 0.879 0.956 0.931 0.934 83.420 HM2 0.948 156.223 HM3 0.932 89.837 Price value (PV) PV1 0.887 0.959 0.936 0.934 96.649 PV2 0.951 160.005 PV3 0.941 120.878 Habit (HB) HB1 0.671 0.890 0.835 0.867 58.918 HB2 0.715 24.084 HB3 0.773 27.578 HB4 0.908 101.242
Behavioral intention (BI) BI(I)1 0.852 0.945 0.913 0.912 78.189
BI(I)2 0.899 52.195
BI(I)3 0.957 161.434
Openness (OPE) OPE1 0.720 0.911 0.872 0.874 63.080
OPE2R 0.809 27.843
OPE3R 0.833 37.836
OPE4R 0.875 51.008
Extraversion (EXS) EXS1 0.681 0.893 0.892 0.952 6.850
EXS2R 0.731 3.976
EXS3 0.915 6.268
EXS4R 0.669 3.217
Agreeableness (AGR) AGR1 0.814 0.946 0.924 0.919 93.174
AGR2R 0.910 67.299
AGR3 0.873 47.139
AGR4R 0.906 64.774
Conscientiousness (CON) CON1 0.672 0.860 0.757 0.792 4.436
CON3 0.888 4.881
CON4R 0.775 3.885
Neuroticism (NEU) NEU2R 0.822 0.903 0.786 0.886 47.795
NEU4R 0.927 91.614
To evaluate discriminant validity, we applied two criteria – Fornell-Larcker and cross-loadings. First, according to Fornell-Larcker criteria, discriminant validity is supported if the square root of AVE for each construct is greater than its correlation with any other construct (Fornell & Larcker, 1981). This criterion is met as shown in Table 5. Second, discriminant validity was assessed by examining loadings, all indicators’ outer loadings (in bold) on a construct should be higher than its cross-loadings (Chin,1998). This is illustrated in Appendix B. Hence, it can be concluded that discriminant validity is supported.
16 Table 5. Fornell-Larcker Criterion
Construct PE EE SI FC HM PV HB BI UB OPE EXS AGR CON NEU Age Sex
PE 0.941 EE 0.649 0.944 SI 0.396 0.374 0.860 FC 0.700 0.701 0.399 0.878 HM 0.619 0.622 0.362 0.591 0.938 PV 0.407 0.474 0.396 0.487 0.517 0.942 HB 0.575 0.555 0.503 0.566 0.517 0.420 0.819 BI 0.764 0.585 0.489 0.626 0.607 0.384 0.657 0.923 UB 0.478 0.478 0.378 0.461 0.324 0.293 0.458 0.506 NA OPE 0.426 0.471 0.266 0.432 0.279 0.268 0.342 0.428 0.610 0.848 EXS -0.060 -0.043 -0.074 -0.032 -0.009 -0.006 0.014 -0.046 0.144 0.133 0.826 AGR 0.255 0.262 0.328 0.275 0.234 0.201 0.239 0.308 0.397 0.375 -0.226 0.902 CON 0.172 0.082 -0.088 0.116 0.188 0.085 0.025 0.126 0.046 -0.055 -0.103 0.097 0.820 NEU -0.277 -0.348 -0.280 -0.270 -0.207 -0.266 -0.308 -0.319 -0.287 -0.308 -0.091 -0.064 -0.041 0.907 Age 0.041 -0.157 -0.095 -0.072 0.047 -0.014 -0.109 -0.007 -0.418 -0.309 -0.139 -0.184 0.240 0.055 1.000 Sex -0.107 -0.084 0.004 -0.037 0.047 -0.003 -0.101 -0.087 -0.037 -0.031 -0.122 0.205 0.047 0.221 -0.026 1.000 Notes: Diagonal elements in bold are square root of average variance extracted (AVE); NA – Not Applicable; PE: performance expectancy;
EE: effort expectancy; SI: social influence; FC: facilitating conditions; HM: hedonic motivation; PV: price value; HB: habit; BI: behavioral intention; UB: usage behavior; OPE: openness; EXS: extraversion; AGR: agreeableness: CON: conscientiousness: NEU: neuroticism
Secondly, the construct usage behavior (UB), measured by 12 formative indicators, is analyzed. The evaluation of this construct includes assessing collinearity issues. We apply the variance inflation factor (VIF) measure to check for collinearity. In this case the maximum VIF for all items is way below than the conservative threshold of 5, thus suggesting no issues of collinearity. Second, the significance and relevance of each indicator’s outer weights is checked by means of bootstrapping (5,000 iterations). In Table 6 VIF, outer weights, t-statistics for outer weights and outer loadings are shown. All formative indicators outer weights are significant except for IntSrc, eBank, eCom, eLearn, eGov, eHealth, and eCivic. Referring to these indicators outer loadings, they are all above 0.5 (except eGov, eHealth, and eCivic that were eliminated). Hence, the formative indicators retained are presented in Table 6.
17 Table 6. VIF, outer weights and outer loadings
Item VIF Outer
Weights T-Statistics Outer Loadings Cloud 1.842 0.113 2.044 0.678 Int 1.952 0.460 4.770 0.866 IntSrc 2.208 0.039 0.464 0.621 Mob 1.930 0.208 2.656 0.781 SNS 1.807 0.262 2.970 0.736 eBank 1.385 -0.008 0.149 0.503 eCom 3.111 -0.024 0.264 0.638 eCom_CB 2.313 0.230 2.586 0.603 eLearn 1.688 0.051 0.847 0.514
5.2. S
TRUCTURAL MODEL AND HYPOTHESES TESTINGAs the measurement model results validate a good construct reliability, indicator reliability, convergent and discriminant validity for reflective measures as well as a validation for formative measures, next we proceed with testing the structural model. First, the three models tested are compared – UTAUT, Personality, UTAUT + Personality. The models are assessed and compared by adjusted R2 and path coefficients, all shown in Table 7. To analyze the hypotheses and association between constructs standardized paths coefficients are examined, where path significance levels are analyzed using the bootstrap resampling method (Hair & Anderson, 2010; Henseler et al., 2009) with 5,000 iterations of resampling (Chin, 1998) . Finally, a multi-group analysis is performed to compare the differences at country level.
A comparison of the estimated models reveals that when adding personality to UTAUT2, there is an increase in the adjusted R2 on usage, with it being 0.45 for UTAUT2, 0.49 for Personality and 0.56 for UTAUT + Personality. On the other hand, when analyzing behavioral intention, the adjusted R2 for UTAUT2 and UTAUT2 + Personality remains the same (0.68). Therefore, the proposed conceptual model (UTAUT2+Personality) has the highest R2 on usage behavior as compared to the other two (UTAUT2 and Personality). Next, the analysis focuses on the model combining UTAUT + Personality.
As it can be seen in the last column of Table 7, the conceptual model explains 69% of the variation in behavioral intention. Performance expectancy, social influence, hedonic motivation, price value, habit, and openness are found statistically significant in explaining behavioral intention, whereas effort expectancy, facilitating conditions, hedonic motivation, price value, extraversion, agreeableness, conscientiousness and neuroticism are not found to have a statistically significant effect on behavioral intention. Regarding usage behavior significant predictors are habit, behavioral intention, openness, extraversion, agreeableness, and age. Facilitating conditions, conscientiousness, and neuroticism are not statistically significant predictors. Our model explains 57% of the variation in usage behavior.
18 Table 7. Structural model with path coefficients and R2 for UTAUT2 model, Personality model and UTAUT2 + Personality model
UTAUT2 Personality UTAUT2+Personality
Behavioral intention R2 0.68 0.27 0.69 Adj. R2 0.68 0.26 0.68 Performance expectancy (PE) 0.47*** 0.44*** Effort expectancy (EE) -0.002 -0.04 Social Influence (SI) 0.14*** 0.12*** Facilitating conditions (FC) 0,05 0.04 Hedonic motivation (HM) 0,15*** 0.16*** Price value (PV) -0,06* -0.07** Habit (HB) 0.24*** 0.24*** Openness (OPE) 0.32*** 0.08** Extraversion (EXS) -0.06 -0.01 Agreeableness (AGR) 0.15*** 0.05 Conscientiousness (CON) 0.11** 0.02 Neuroticism (NEU) -0.21*** -0.05 Sex -0.02 -0.02 Age 0.007 0.03 Usage Behavior R2 0.46 0.50 0.57 Adj. R2 0.45 0.49 0.56 Facilitating conditions (FC) 0.15*** 0.07 Habit (HB) 0.13* 0.10** Behavioral intention (BI) 0.33*** 0.29*** 0.20*** Openness (OPE) 0.39*** 0.29*** Extraversion (EXS) 0.12** 0.11** Agreeableness (AGR) 0.19*** 0.15*** Conscientiousness (CON) 0.07** 0.09 Neuroticism (NEU) -0.04 -0.04 Sex 0.02 -0.02 Age -0.39*** -0.29*** Notes: *p<0.10; **p<0.05; ***p<0.01
Next, the analysis proceeds with comparison between Bulgaria and Portugal to detect for country differences. To capture significant differences between the two countries, PLS Multi-group analysis is performed (Henseler et al., 2009). Table 8 summarizes the differences for all relationships in the model between the two countries – Bulgaria and Portugal. As shown in the table, there are several
19 Table 8. PLS Multi-group analysis
Path Coefficients-diff (|Bulgaria - Portugal |) p-Value (Bulgaria vs Portugal) UTAUT2 + Personality (Bulgaria) UTAUT2 + Personality (Portugal) Behavioral intention R2 0.73 0.71 PE -> BI 0.179 0.049 0.554*** 0.375*** EE -> BI 0.046 0.661 -0.093 -0.047 SI -> BI 0.091 0.875 0.071 0.162** FC -> BI 0.139 0.860 -0.032 0.107* HM -> BI 0.258 0.992 0.028 0.285*** PV -> BI 0.023 0.626 -0.067 -0.044 HB -> BI 0.176 0.022 0.332*** 0.156*** OPE -> BI 0.026 0.632 0.058 0.084* EXS -> BI 0.008 0.554 0.019 0.027 AGR -> BI 0.125 0.036 0.092* -0.032 CON -> BI 0.021 0.379 0.037 0.016 NEU -> BI 0.171 0.993 -0.129** 0.042 Sex -> BI 0.068 0.123 0.063 0.022 Age -> BI 0.041 0.244 0.006 -0.062 Usage behavior R2 0.67 0.49 FC -> UB 0.022 0.586 0.068 0.091 HB -> UB 0.161 0.094 0.224*** 0.063 BI -> UB 0.431 0.992 -0.007 0.424*** OPE -> UB 0.164 0.082 0.328*** 0.164* EXS -> UB 0.139 0.090 0.172** 0.033 AGR -> UB 0.061 0.305 0.208*** 0.147 CON -> UB 0.171 0.117 0.100 -0.071 NEU -> UB 0.104 0.169 -0.024 -0.128 Sex -> UB 0.015 0.554 -0.360*** -0.010 Age -> UB 0.350 0.976 0.005 0.021
Notes: *p<0.10; **p<0.05; ***p<0.01;PE: performance expectancy; EE: effort expectancy; SI: social influence; FC: Facilitating
conditions; HM: hedonic motivation; PV: price value; HB: Habit; BI: behavioral intention; UB: Usage behavior; OPE: Openness; EXS: Extraversion; AGR: Agreeableness: CON: Conscientiousness: NEU: Neuroticism; p-values in bold show the significant differences between the two countries
20
6. DISCUSSION
6.1. T
HEORETICAL IMPLICATIONSConsidering the importance of the digital divide phenomenon and the popularity of technology adoption models, one of the contributions of this paper is that it adds a bridge between these two fields by introducing and validating a conceptual model in the context of a broad set of ICTs. By linking personality traits directly to behavioral intention and use, we provide additional support for including individual difference variables in the UTAUT2. The results of the study suggest that by adding personality to UTAUT2, the variation explained in usage behavior increased some 11 p.p. (45% vs 56%). In previous research, personality traits have been incorporated in technology adoption models and their impact on technology adoption has been examined via constructs like usefulness or perceived ease of use (see e.g., Devaraj et al., 2008; Picazo-Vela et al., 2010; Terzis et al., 2012). Therefore, another contribution of the current study is incorporating personality in UTAUT2 and examining direct effects on both behavioral intention (BI) and usage behavior (UB). Moreover, it addresses a call for further research to understand the openness dimension as Devaraj et al. (2008) reveal that openness does not affect intention via other TAM constructs, but find some evidence that certain aspects of personality might have a more direct impact on intention to use technology.
Before discussing the results regarding personality traits, we review UTAUT2 hypotheses, most of which are supported. In line with previous research (Venkatesh et al., 2012), the strongest predictor of intention turns out to be performance expectancy (PE), showing that individuals treat the outcomes of ICT use as important. The impact of behavioral intention (BI) on usage behavior (UB) is also significant, indicating that ICT users are more likely to use technologies if they have the intention to use them. Another significant predictor is social influence (SI), revealing that the decision of technology use is affected by an individual’s social environment, like friends and family’s opinion. Moreover, hedonic motivation (HM) is a significant predictor of behavioral intention (BI), showing individuals use technologies not only to complete tasks but for entertainment purposes as well. This finding is in line with previous research (Morosan & DeFranco, 2016; Venkatesh et al., 2012). As expected, habit (HB) has a significant positive effect on both behavioral intention and use, indication that individual’s automatic behavior positively influences their intention and use of technologies. As for the demographics, in line with other researchers that found that gender differences were no longer relevant in technology use and adoption in modern and technology-literate societies (Workman, 2014), our study confirmed this hypothesis. However, some caution should be taken as the context of this study is, in the two countries, within the European Union. It seems reasonable to hypothesize that in other (mainly developing) countries, gender may have its influence in ICT acceptance. As expected, age affects technology behaviors such that older individuals tend to use technologies less. Hence, to some extent there may exist an age-related digital divided in these two countries.
Contrary to our expectations, effort expectancy (EE) and facilitating conditions (FC) turn out to be non-significant predictors of technology adoption. A possible explanation behind this might be that as the technologies in question are widely spread, users get used to them more quickly and find them easy to use, therefore, putting less importance on the effort expected and the facilitating conditions (like infrastructure and capabilities). Although price value (PV) has a slight significant effect on intention, it is with a negative sign which is contrary to the relationship hypothesized. This
21 finding shows that individuals perceive the financial cost to be higher than the advantages of the technologies in question. A reason behind this might be that individuals in the countries where the model was tested, Bulgaria and Portugal, are more price-sensitive.
Next, the effect of personality traits is discussed. Three out of the five personality traits explored (openness, extraversion, and agreeableness) have a direct effect on either one of the constructs of behavioral intention and usage behavior, or on both. Specifically, openness (OPE) is positively associated with both behavioral intention (BI) and usage behavior (UB), indicating that individuals who are more open are more likely to adopt technologies. Although some papers state openness has no effect on technology use (Behrenbruch et al., 2013; Devaraj et al., 2008), in line with our findings, others have shown that openness positively affects social network usage (Amichai-Hamburger & Vinitzky, 2010; Hughes et al., 2012) and it is positively correlated with the use of social apps (Butt & Phillips, 2008; Correa, 2010). As for extraversion (EXS), consistent with previous research, we confirm that extroverts use technologies more than introverts. It has been demonstrated that extraversion positively affects the use of technologies (see e.g., Correa, 2010; Hunsinger et al., 2008; Zhou & Lu, 2011). Furthermore, the current study reveals that individuals who score high on agreeableness (AGR) tend to build positive beliefs to technology adoption in contrast to more disagreeable people. This finding is in line with previous research indicating that agreeableness is positively associated with technology believes, especially when the outcomes of technology use are related to cooperation, task accomplishment and communication (Butt & Phillips, 2008; Xu et al., 2016). Although extraversion and agreeableness show a positive relationship with usage behavior (UB) as hypothesized, none of them is a significant predictor of behavioral intention (BI). A possible explanation behind this might be that, although extraverted and agreeable people are more likely to become early adopters, the set of technologies in the context of this study are widely spread and intent of early adoption is weakened and non-significant in this context.
Regarding conscientiousness (CON) and neuroticism (NEU), none of the hypotheses is supported. Thus, whether and individual scores high or low in conscientiousness or neuroticism, this would have no effect on their decision to adopt ICTs. Even though conscientious individuals tend to use ICTs when they believe it would help them be more efficient (Devaraj et al., 2008), studies have shown that conscientious people are less likely to adopt socially-based ICTs (Xu et al., 2016). Similarly, previous research has shown that individuals high in neuroticism tend to reduce their use of Internet due to higher levels of anxiety and stress (Devaraj et al., 2008), but at the same time they tend to spend more time on social and shopping apps (Xu et al., 2016). Therefore, a possible explanation behind the insignificance of these predictors might be that the current study encompasses a broader set of ICTs characterized by both efficiency and enjoyment outcomes.
Finally, another contribution of this paper is that it discerns patterns of cross-cultural variability (Eastern versus Western Europe), shows the main drivers for ICT adoption in each of the countries and detects for significant differences (Table 9). The differences appearing among the two countries can be sought behind the way personality traits and culture interact to shape the behavior of individuals, market maturity and the stage of the “online evolution”. For example, neuroticism is a significant predictor only in Bulgaria, which can be related to the idea that Latin people are more relaxed and exert less anxiety as compared to Balkan people. As it has been previously shown, anxiety and stress reduce the use of Internet (Devaraj et al., 2008). Moreover, neurotic people are less likely to feel enjoyment and pleasure of technology use (Xu et al., 2016). Therefore, they will
22 rather tend to use technologies when the outcome is related to performance gains, which might be related to the observation that hedonic motivation is a significant predictor only in Portugal, whereas in Bulgaria performance expectancy is the strongest driver on behavioral intention. Additionally, while in Bulgaria habit is a significant predictor on both behavioral intention (BI) and usage behavior (UB), indicating that past actions are transformed to usage behavior, in Portugal habit positively affect only intention. As suggested by Ouellette & Wood (1998) , in domains where habits are less likely to develop, usage behavior might be controlled by deliberative reasoning processes, and the effects on usage behavior are mediated by intentions. As for the significance difference in agreeableness, it has been demonstrated by Hofstede (2016) that Bulgarians score high on long term orientations as opposed to Portuguese who score low on this dimension. Therefore, Bulgarians show an ability to adapt traditions easily to changed conditions, indicating a more agreeable mindset, whereas Portuguese view societal change with suspicion.
Moreover, there is no significant impact of social influence on behavioral intention to use in Bulgaria, as opposed to Portugal. This means that views of opinion-makers and of those in a social circle do not significantly affect one’s behavioral intention to use. An explanation could be that the utility factor of performance expectancy is the major determinant of behavioral intention in Bulgaria, leaving social influence as a weak explanatory variable. While the relationship between behavioral intention (BI) and usage behavior (UB) is significant in the Portuguese sample, it is not supported in the Bulgarian one. This non-significant relationship can be associated with individuals in Bulgaria poorly estimating their own behavior (Straub, Limayem, & Karahanna-Evaristo, 1995). As for age being significantly different between the two countries, the reasoning should be sought in the sample characteristics, which is addressed as one of the limitations of the current study in section 6.3.
23 Table 9. Significant ICT adoption factors and country differences
Relationship Hypotheis Significance (overall
sample) Significance (Bulgaria) Significance (Portugal) Significant difference H1: PE -> BI positive ✓ ✓ ✓ ✓ H2: EE -> BI positive H3: SI -> BI positive ✓ ✓ H4a: FC -> BI positive ✓ H4b: FC -> UB positive H5: HM -> BI positive ✓ ✓ ✓
H6: PV -> BI positive Supported with (-) sign
H7a: HB -> BI positive ✓ ✓ ✓ ✓
H7b: HB -> UB positive ✓ ✓
H8: BI -> UB positive ✓ ✓ ✓
H9a: OPE -> BI positive ✓ ✓
H9b: OPE -> UB positive ✓ ✓ ✓
H10a: EXS -> BI positive
H10b: EXS -> UB positive ✓ ✓
H11a: AGR -> BI positive ✓ ✓
H11b: AGR -> UB positive ✓ ✓
H12a: CON -> BI positive
H12b: CON -> UB positive
H13a: NEU -> BI negative ✓ ✓
H13b: NEU -> UB negative
H14a: Sex -> BI no impact ✓
H14b: Sex -> UB no impact ✓
H15a: Age -> BI negative
H15b: Age -> UB negative ✓ ✓
Notes:*p<0.10; **p<0.05;***p<0.01; PE: performance expectancy; EE: effort expectancy; SI: social influence; FC: Facilitating
conditions; HM: hedonic motivation; PV: price value; HB: Habit; BI: behavioral intention; UB: Usage behavior; OPE: Openness; EXS: Extraversion; AGR: Agreeableness: CON: Conscientiousness: NEU: Neuroticism
6.2. P
RACTICAL IMPLICATIONSThe current study reveals that different personality characteristics have an effect on individuals’ intention and use of ICTs. A better understanding of individual differences and how they impact adoption intent and usage behavior would have implications for psychologist, marketeers and policy makers in developing, aligning and designing ICT functionalities and creating proper stimuli in regards to personality differences. For example, more open to experience, extraverted and agreeable people are more likely to become adopters of ICTs. Therefore, personality traits should be considered in applying a more personalized marketing on the targeted audience considering this audience’s characteristics instead of mass marketing. In regards to the finding that the PE construct is found to be the strongest one, whereas EE in not significant in influencing the adoption intention, system designers should put emphasis on the applications’ functionality and usability from the customers ‘perspective rather than designing apps that are easy to access and navigate. Besides that, although young users adapt ICT applications easily, developers should still focus on providing technical support to users who are less technologically advanced. Furthermore, marketing practitioners should focus