THE CONSTRUCTION SECTOR SYSTEM APPROACH: AN INTERNATIONAL
FRAMEWORK
Report by CIB W55-W65
Construction Industry Comparative Analysis Project Group
CIB Report: Publication
Editor:
Jean Carassus
Centre Scientifique et Technique du Bâtiment – Paris
Published by:
CIB Rotterdam - 2004
ISBN:
April 2004
Contents
Introduction………..4
Les Ruddock
Chapter 1
From the construction industry to the construction sector system …….…..…5 Jean Carassus
Case studies in the application of the framework analysis
Chapter 2
Meso-economic analysis of the Australian building and construction industry ……….19 Gerard de Valence
Chapter 3
The construction industry cluster in Canada - still blurry and difficult to assess ………..44 André Manseau
Chapter 4
The Danish construction sector at the end of the1990s………..56 Niclas Andersson
Chapter 5
France: A fragmented and flexible construction sector system ……..………..75 Jean Carassus
Chapter 6
The German construction sector a decade after reunification………..92 Niclas Andersson and Jörge Clobes
Chapter 7
Some recommendations for the development of the Lithuanian construction sector ……….114 Arturas Kaklauskas and Edmundas-Kazimieras Zavadskas
Chapter 8
Chapter 9
The Swedish construction sector : Its economic and social role ………154 Niclas Andersson
Chapter 10
The UK construction sector at the threshold of the new century…………...175 Les Ruddock and Alex Wharton
The value of the sector system approach
Chapter 11
Construction sector system approach : An international comparison and action plan………...190
-CHAPTER VIII
THE PORTUGUESE CONSTRUCTION SYSTEM: THE
ADJUSTMENT PROCESS TO A CHANGING MARKET
AFTER THE BOOM YEARS
Jorge Lopes
School of Technology and Management Bragança - Portugal
INTRODUCTION
The study of the construction industry and its role in national economy has been extensively addressed. Traditional analysis of the construction industry has mainly focused on the building firm’s size, the structure of employment, and the division of building, civil engineering, and R & M construction works. Existing assumptions persist that structural changes will emerge in the construction industry of a particular country as the national economy develops over time. Bon (1992) analysing the role of the construction sector in economic development presented a development pattern of the construction industry based on stages in development. The main aspects of the development pattern were as follows: in the early stages of development, the share (percentage) resulting from construction in national output will increase, but ultimately will decrease in absolute and relative terms in more advanced industrial countries. Another important aspect of the development pattern is that while the share allotted to improvement and maintenance in total construction increases, the proportion for new construction decreases in the latest stages of development. Ruddock (1999) using more recent data collected from a large sample of countries representing all stages of economic development corroborated this proposition.
An emerging approach is the “meso-economic analysis” of the construction industry or the “construction sector system”, which takes into account not only construction firms, but also the wide range of participants in the development of the building environment. According to Carassus (1999), production is only one of the dimensions of the analysis, since the use and the adaptation of products are becoming the centre of the system in industrially advanced countries. Further, there is a constant interaction between the system and its participants, and this interaction is determined by the system, rules and conventions. Does this approach also apply to the construction sector of countries in the middle-income range? What is the effect of the increasing globalisation of the economy, particularly that of property investment, on the development pattern of the construction industry in less advanced countries?
experienced a sustained growth in line with the development of the general economy. However, in the last four years, the pattern has shown signs of flagging due to excess supply, particularly in the new residential housing segment, and changing economic environment.
This paper focuses on the application of the ‘construction system’ model to the Portuguese case in terms of construction firm organisations, market development, player configurations and the relationship between the construction sector and the general economy.
BACKGROUND TO THE STUDY
The application of meso-economic analysis to the study of the construction industry is still in its infancy. According to Carassus (1999), several interchangeable concepts are used in the meso-economics literature: sector, production chain, economic meso-system and industry cluster. The concept of the economic meso-system is, according to same author, an appropriate way to capture the complex nature of the built environment because it deals with, on the one hand, the participants producing specific types of goods and services, and, on the other hand, the institutions responsible for regulating the individual and collective behaviour of the participants involved in the production. It is worth noting that the application of this method of analysis is very close to that proposed by the Australian Expert Group on Industry Studies or AEGIS (1999) in its study of the Australian construction industry. The AEGIS classification divides the industry into five product - system segments: on-site services, client services, building and construction project firms, building products and supplies, and tools, machinery and equipment manufacturing. A detailed review of the construction meso-economics literature is provided in a paper by Carassus (2000).
THE MACRO-ECONOMIC ENVIRONMENT
Before proceeding with the characterisation of the Portuguese construction sector system, it is worth presenting here an overview of the recent country’s macro-economic environment. A more complete survey is provided in Lopes (2001). The Portuguese economy has enjoyed an era of remarkable economic performance and a low rate of inflation. Output growth averaged 3.4% per year on a GDP basis during the period 1994-1999, raising the GDP per capita measured in purchasing power parity terms to 69.4% of that of the European Union average of 53.2% in 1985 (OECD, 1999). The construction industry and related sectors have played an important role in the country's economic performance. Construction value added represents 6.5 % of the annual GDP and contributes around 12 % to total employment. According to the figures provided by the National Statistics Institute (INE-b, various years), either 68,522 large or small enterprises were active in the construction industry in 1998, with 353,574 employees. This growth in construction employment (see Table 2) has helped to lower the country's unemployment rate to 4.4%, one of the lowest in the OECD countries.
booming financial sector services (OECD, 1999). These developments coupled with the fierce competition between banks and other financial institutions as regards mortgage credit have had a strong impact on the development of the construction market, particularly on the new residential housing sub-segment.
On the supply side, the surge in equity and bank-lending markets influenced the operating environment of the major national construction enterprises through mergers and acquisitions of companies. The participation of banks and other financial institutions in the capital of or joint-venturing with major construction companies facilitated the market diversification of the latter, namely, in the property market and utilities services. As regards the property market, the changes in the general environment, increasing per capita income and urbanisation (particularly the EXPO 98 developments in Lisbon) spurred on the development of a more modern property sector in the metropolitan areas similar to those prevailing in the 'maturing' markets of other European countries (for a discussion of this concept of 'maturity', see e.g. Magalhães, 1999).
STATISTICAL SOURCES
The intention of this section is to provide a brief explanation of the accounting procedures of the main bodies concerned with the provision of data and other statistical information pertaining to the construction industry and related sectors in Portugal. The statistical sources used stem from the various publications of the National Institute of Statistics (INE) and the Construction Annual Report published by the Association of Building Construction and Public Works Enterprises (AECOPS). The INE Quarterly National Accounts is the official publication that provides the most important statistical data concerning the nation. As with other Western European nations, the Quarterly
National Accounts is fully consistent with the European System of National and
THE PORTUGUESE CONSTRUCTION ACTIVITY IN THE
PERIOD 1990-2002
Since the entrance of the country in the European Union in 1986, the Portuguese economy has entered an era of sustained economic growth. As stated earlier, the run-up in the economic process and monetary integration started in the early 1990s, coupled with the transfer of EU structural funds, have impacted heavily on the construction industry activity and economically related sectors. New residential building and civil engineering works have been the driving forces bolstering this remarkable growth throughout the last decade.
The Clout of the On–Site Construction Activity
Table 1 presents construction value added (CVA) and gross fixed capital formation in construction (GFCFC) for the period 1990-2002. It is easy to see that the indicators of the construction activity experienced a remarkable growth in the period despite a drop-off in CVA in 1992/1993, which was accompanied by a plunge in national output after the world-wide economic recession in 1991/1992. Table 1 also indicates that two development patterns can be observed: i) the period 1990-1997, in which the indicators of construction activity increased not only absolutely but also relatively, peaking in 1997, which coincided with the completion of most of the major infrastructures and developments of the World EXPO' 98 hosted in Lisbon. The share of CVA in GDP increased from 5.5% in 1990 to 6.7 in 1997. ii) the period 1998-2002, in which an absolute increasing growth in both CVA and GFCFC was accompanied by a relative decreasing growth in the same indicators. The share of CVA in GDP fell to 6.4% in 2002, the year that even experiences an absolute decrease in the construction industry activity. Thus, a trend of relative decline is clearly apparent in the last four years.
Table 1 - Construction Value Added (CVA), Gross Fixed Capital Formation in Construction (GFCFC) and the Share of CVA in GDP (1990-2002)
Year CVA ( constant 1995 million EUR)
GFCFC
(constant 1995 million EUR)
Share of CVA in GDP (%)
1990 4045.6 8348.5 5.5
1991 4181.3 8814.3 5.6
1992 4341.9 9152.9 5.7
1993 4311.2 9088.1 5.5
1994 4385.7 9245.2 5.6
1995 4853.3 9824.8 6.0
1996* 5090.2 10361.0 6.2
1997 5432.6 11784.4 6.7
1998 5727.4 12592.0 6.6
1999 5893.7 13053.6 6.6
2000 6155.0 13645.3 6.6
2001 6308.3 14017.8 6.5
2002 6060.2 13547.6 6.4
Construction Employment
The growth in construction activity is also visible in employment. Table 2 shows data on construction employment, total employment and the contribution of construction to total employment. Although the data for the whole period are not strictly comparable due to changes in statistical procedures and coverage (until 1998, data referred only to the Portugal mainland and after 1998 to all of Portugal), an absolute and relative growth was generally observed, particularly from 1995 and subsequently. The share of construction employment in total employment reached 12.2% in 2002, one of the highest levels in the European Economic Area.
Table 2 - Employment by Construction Industry and Total National Employment and Share of Construction Employment in National Employment: 1990-2002
Year National Employment
(000’)
Construction Employment
(000’)
Share of Construction in National Employment (%)
1990 4466.3 3
352.6 7.9 1991 4631.0 362.8 7.8
1992 * 4340.7 346.2 7.9
1993 4255.2 340.2 8.0 1994 4251.1 330.8 7.8 1995 4225.1 340.3
340 3
8.1 1996 4250.5 343.1
343 1
8.1 1997 4331.8 388.4
343 1
9.0
1998 * 4863.3 518.8 10.9
1999 4928.7 538.7 11.2 2000 5028.9 596.4 12.1 2001 5098.4 586.1 11.5 2002 5106.5 622.3 12.2
Source: INE-b (Employment Statistics) Note: * - New series
Changes in the Composition of Construction Output in Portugal
Table 3- Composition of Construction Output (1990-2002)
Year
Residential Building
Non Residential Building
Civil Engineering GFCFC (all works)
Share (%)
% change of preceding
year
Share (%)
% change of preceding
year
Share (%)
% change of preceding
year
(EUR million
-current prices)
% change of preceding
year
1990 52.7 1.5 22.8 7.4 24.5 17.3 6180.3 6.4
1991 49.9 -1.5 22.8 4.3 27.3 19.1 6935.8 4.8
1992 48.7 1.7 22.6 2.3 28.7 8.5 7634.6 3.7
1993 48.0 -1.2 22.1 -2.0 30.0 4.9 7937.4 0.4
1994 46.8 -0.8 22.4 3.2 30.8 4.6 8485.5 1.7
1995 45.4 2.6 22.1 4.6 32.5 11.6 9470.7 5.9
1996 * 50.7 - 22.0 - 27.3 - 10643.8 5.5
1997 50.5 11.6 21.6 10.4 27.9 14.5 12604.4 13.9
1998 51.8 9.0 20.5 0.3 27.7 5.0 13792.5 6.9
1999 54.0 6.0 19.6 0.6 26.4 0.0 14578.9 3.7
2000 55.0 3.0 19.1 1.3 25.9 2.7 16187.0 4.5
2001 53.7 -1.5 19.5 3.0 26.8 5.0 17159.8 2.7
2002 52.4 -4.0 20.4 2.0 27.2 0.0 17228.8 -3.4
Sources: INE-a (various issues) for all works in 1990-2002 and disaggregated data in 1990-1995; Estimates by AECPOS (various years) f or disaggregated data in 1996-2002.
Note: GFCFC comprises the output of new works, major repairs, alterations, site preparation by construction firms and construction works done by other entities. It does not comprise repair and maintenance works.
*- New series for disaggregated data
There is no official data on R & M construction works in Portugal. According to AECOPS (2003 edition), which used data from the Euroconstruct Report, the share of this market sub-segment averaged 7.6% of the total market output for the period 1998-2002, the lowest value among the Euroconstruct countries. Although the figures from Portugal, as noted earlier, might be under-reported, they do reflect somewhat the structural imbalance of the construction market, let alone issues concerning data availability and reliability. However, data on awarded public work tenders (AECOPS, 2001 edition) suggest that there has been a marked increase in R & M construction work. The share of R & M public works in total public works increased from 13% in 1993 to 26.4% in 2000. The repair and maintenance of the road network accounted for most of this increase.
Table 4–New Construction and R & M in Portugal and in Euroconstruct Countries (%): 1998-2002
Residential Building
Non Residential Building
Civil Engineering
Repair & Maintenance
Total
Portugal 48.8 17.2 26.4 7.6 100
Euroconstruct (average for 15
countries)
24.0 19.5 20.5 36.0 100
Source: AEC0PS (various years)
Size Distribution of the Construction Firms
The construction industry in Portugal is very fragmented. Table 5 below shows the distribution of firms according to company size for the period 1993-1998. Although there is a discontinuity in the series in 1995-1996 due to change in statistical procedures and improvement in statistical coverage, it can be observed that small firms (up to 9 employees) represented 93% of the total number of firms in 1996-1998, a pattern similar to those of other countries in the European Union. The number of large and medium-sized firms remained fairly stable during the period 1993-1998. The share of large firms (firms employing 100 or more) varied between 0.7 and 0.8% in 1993-1995, and between 0.3 and 0.4% in 1996-1998.
Table 5- Construction Firms by Size of Company (1993-1998)
1993 1994 1995 1996 * 1997 1998
Size Nº of
Firms %
Nº of
firms %
Nº of
firms %
Nº of
firms %
Nº of
firms %
Nº of
firms %
Up to 9
Employees 23780 83.7 26457 84.2 25591 84.2 63972 93.1 59669 92.8 63759 93.1
10 – 19
Employees 2548 9.0 2732 8.7 2665 8.8 2724 4.0 2738 4.3 2831 4.1
20 – 100
Employees 1844 6.5 1971 6.3 1923 6.3 1786 2.6 1683 2.6 1692 2.5
100 +
Employees 237 0.8 246 0.8 225 0.7 236 0.3 218 0.3 240 0.4
Total 28409 100 31406 100 30404 100 68718 100 64308 100 68582 100
The distribution of employment according to company size for the period 1993-1998 is presented in Table 6. It can be seen that there was no significant change in employment and in its distribution across the size category during the period 1993-1995. In line with the increase in total employment for the period 1995-1998, the contribution of the small firms to total employment increased both absolutely and relatively, and the share of the large firms decreased relatively during the same period.
Table 6– Employment in Construction Firms by Size of Company (1993-1998)
1993 1994 1995 1996 * 1997 1998
Size Nº of
Emplo- yees % Nº of Emplo- yees % Nº of Emplo- yees % Nº of Emplo- yees % Nº of Emplo- yees % Nº of Emplo- yees %
Up to 9
Employees 69823 30.0 75657 30.9 74314 32.0 144593 47.2 159186 49.2 185893 52.6
10 – 19
Employees 31423 13.5 35585 14.5 33282 14.3 31224 10.2 34375 10.6 40142 11.3
20 – 100
Employees 63964 27.5 71313 29.1 64242 27.6 65198 21.3 64763 20.0 65269 18.5
100 +
Employees 67539 29.0 62225 25.4 60636 26.1 65392 21.3 65237 20.2 62270 17.6
Total 232809 100 244780 100 232474 100 306407 100 323561 100 353574 100
Source: INE-c, various years (Business Surveys) *- New series
Table 7– Turnover in Construction Firms by Size of Company: 1993-1998 (EUR million)
1993 1994 1995 1996 * 1997 1998
Size
Value % Value % Value % Value % Value % Value %
Up to 9
Employees 2477 24.8 2932 27.0 2951 25.
0
7879 42.1 11098 46.5 15965 53.6
10 – 19
Employees 1281 12.8 1239 11.4 1553 13.
1
1703 9.1 2071 8.8 2477 8.4
20 – 100
Employees 2525 25.3 2757 25.4 3042 25.
8
3443 18.4 3682 15.6 4343 14.6
100 +
Employees 3729 37.1 3926 36.2 4265 36.
1
5689 30.4 6688 29.0 6948 23.4
Total 9988 100 10853 100 11811 100 18714 100 23539 100 29733 100
Source: INE-c, various years (Business Surveys) *- New series
Table 7 above shows the evolution of turnover by construction firms and its distribution across the size category for the period 1993-1998. It can be observed that the pattern is similar to that of employment during the same period. However, the largest firms played an important role, particularly in civil engineering and non-residential building sub-segments, added to the increasing trend in the concession regime. According to the
construction companies totalled EUR 4.1 billion, about 17% of the total turnover of the industry in 1998. The value of construction works completed abroad by companies with 20 or more employees increased from EUR 205 million in 1992 to EUR 435 million in 1998.
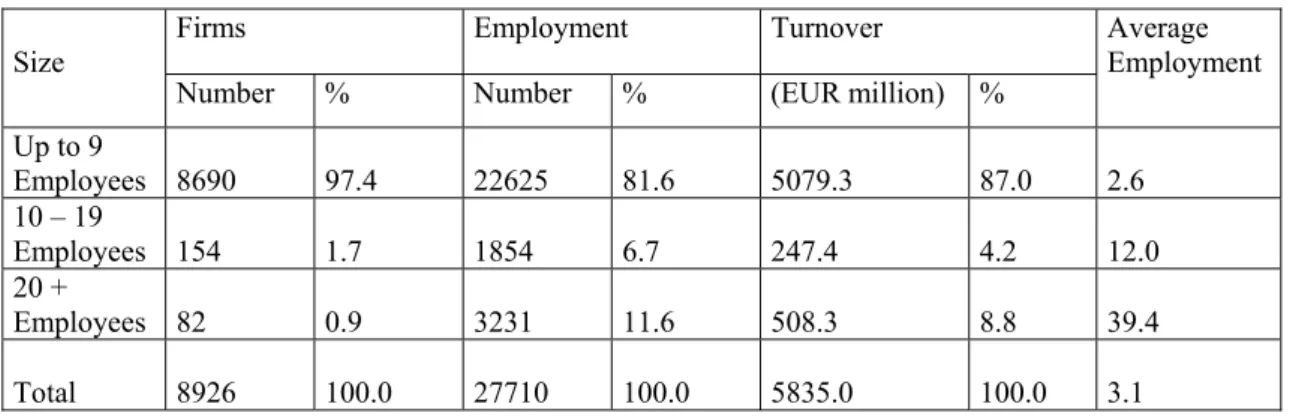
Design and Consultancy Services and Property Activities
Table 8 presents the distribution of firms, employment and turnover across the size category in 1998 for property activities. It clearly shows the dominance of small firms in this activity. Firms with up to 9 employees accounted for 97.4% of the total number of firms and contributed to 81.6 % and 87%, respectively, in employment and turnover. Firms with 20 or more employees accounted for just over 8.8% of the total turnover of the industry, which reveals the prevalence of a 'local' market in the Portuguese property sector. The average number of people employed in property activities is 3.1.
Table 8 - Firms, Employment and Turnover in Property Activities: 1998
Firms Employment Turnover
Size
Number % Number % (EUR million) %
Average Employment
Up to 9
Employees 8690 97.4 22625 81.6 5079.3 87.0 2.6
10 – 19
Employees 154 1.7 1854 6.7 247.4 4.2 12.0
20 +
Employees 82 0.9 3231 11.6 508.3 8.8 39.4
Total 8926 100.0 27710 100.0 5835.0 100.0 3.1
Source: INE-c (Business Surveys: 1998)
Note: Include property developers, house-renting companies, estate agencies, and building administrators. It does not include property development by construction companies.
Table 9- Firms, Employment and Turnover in Consultant and Design Services: 1998
Firms Employment Turnover
Size
Number % Number % (EUR million) %
Average Employment
Up to 9
Employees 3139 92.3 12623 65.5 1205.1 71.6 4.0
10 – 19
Employees 162 4.8 1854 9.6 135.2 8.0 12.9
20 +
Employees 93 2.9 4561 24.9 341.7 20.4 49.7
Total 3394 100.0 19280 100.0 1682 100.0 5.7
Source: INE-c (Business Surveys:1998)
Note: Include architects, engineers, project managers, technical designers, land surveyors and other technicians. It excludes non-registered individual designers and other technicians, and construction and construction–related government departments.
Building Materials Industry
The indigenous building materials industry impacts heavily on the fate of a country’s construction industry, even in a globalised market of construction products and services. As pointed out by E & T (2000), innovation in this sector will be a key factor in the competitiveness of the Portuguese construction industry.
The building materials sector is more concentrated than the construction sector, although the heterogeneity of the former is also evident. One distinct category is the very concentrated, high-technology and capital-intensive activities of cement and lime production, sanitary equipment and special steel products. At the bottom end of the sector are the dispersed low-technology manufacturing activities involved with the production of bricks for walls, cement products and stonework. Unfortunately, it is difficult to get a really accurate measurement of the output of the building materials industry and the products directly used by the construction industry. Although input/output tables do provide an important contribution to the data collected for this purpose, they are outdated, however, in the case of Portugal. Indeed, many segments of the building industry provide products that are not exclusively targeted for the construction sector. Thus, the data provided here concern the activities of non-metallic mineral products and basic metallurgical manufacturing, which are to a great extent directed toward the construction industry activity.
Tables 10 and 11 show the distribution of firms, employment and turnover across the size category in 1998 for, respectively, non-metallic mineral products, and metallurgical manufacturing. It can be seen that firms with 20 or more employees play an important role in these activities. In the former industry, they contributed to 70.4% in employment and 81.9 % in turnover. In the latter industry, their share amounted to, respectively, 85.2% and 94.2% in employment and turnover.
Table 10 - Firms, Employment and Turnover in Non-Metallic Mineral Manufacturing: 1998
Firms Employment Turnover
Size
Number % Number % (EUR million) %
Average Employment
Up to 9
Employees 3383 74.4 14650 20.0 490.7 11.4 4.3
10 – 19
Employees 513 11.3 7032 9.6 292.7 6.7 13.7
20 +
Employees 647 14.3 51629 70.4 3523.1 81.9 79.8
Total 4543 100 73311 100 4306.5 100 16.1
Source: INE-c (Company Surveys:1998)
Table 11 - Firms, Employment and Turnover in Basic Metallurgical Manufacturing: 1998
Firms Employment Turnover
Size
Number % Number % (EUR million) %
Average Employment
Up to 9
Employees 368 70.6 1313 9.8 50.2 3.9 3.6
10 – 19
Employees 51 9.9 665 5.0 24.1 1.9 13.0
20 +
Employees 102 19.5 11352 85.2 1213.4 94.2 111.3
Total 521 100 13330 100 1287.6 100 25.6
Source: INE-c (Business Surveys:1998)
VALUE OF THE BUILT ENVIRONMENT STOCK
No statistics are available on the value of the built environment stock. Since the late 1950s, when the National Institute of Statistics (INE) started publishing the country’s
National Accounts in its modern version, data have been compiled and are available on the gross fixed capital formation (GFCF) and the GFCF in construction (GFCFC) as a component of GDP in terms of expenditures. Ever since then, there has been a remarkable uniformity in the value of the GFCF and the GFCFC, the latter being roughly half that of the former. The GFCF varied between 15% and 20% during the period from the late 1950s to the 1980s and between 20% and 25% from the mid-1980s up until now.
The Census of Population and Housing and the System of Price Indicators in Construction and Housing, both published by the National Institute of Statistics (INE-d, 2001: INE-e, various issues ), are the only comprehensive sources to allow an accurate estimate of the country’s residential stock value. According to the 2001 Census of Population and Housing, the Portugal mainland had a total of 9,833,408 inhabitants, 3,015,786 residential buildings and 4,849,274 housing units. Table 14 shows a sharp rise in residential housing during the period 1970-2001, an increase just under 2.3 million housing units. The total number of housing units in Portugal (including the Atlantic islands of Azores and Madeira) is 5,036,149 and a total population of 10,318,084 inhabitants. The Metropolitan area of Lisbon (Lisboa e Vale do Tejo) accounts for about 35% of the housing stock.
In 1995, the Portugal mainland housing units had an average inhabitable area of 80 square metres. According to INE-e (2001, third quarter issue), the average housing price was EUR 1,059 the square metre (Table 13). After depreciation, the residential housing stock value may therefore be estimated at EUR 255,530 million, and the non-residential housing and civil engineering stock value at EUR 137,593 million. The ″construction stock to GDP″ ratio is 3.5.
Table 12 – Evolution of Housing Units in the Portugal Mainland (1970-2001)
Year Habitual space of
residence
Vacant/second residence
Total % change of
preceding census
1970 2135360 423380 2558740 -
1981 2653100 586900 3240000 26.6
1991 2928500 1061770 3990270 23.2 2001 3585472 1263802 4849274 21.5
Source: INE-d, 2001(2001 Census of Population and Housing)
Table 13– Bank Valuation (mean average) of Housing in the Portugal mainland (EUR/m2): third quarter 2001
Total Apartments Detached houses
Portugal mainland 1,059 1,147 886
North 922 996 797
Centre 895 1,002 797
Lisboa e Vale do Tejo 1,272 1,302 1,149
Alentejo 898 996 839
Algarve 1,158 1,199 1,043
Fig.1 Construction Sector System in Portugal
New construction (potential service to the
users)
Management of the service provided by the structures to the users
Demolition
Life-cycle of built environment
Brief Desig n
Works Purchase
Sale
Management Operation Maintenance
Major
repairs Brief
Brief
Design Works Works
Continuous asset, property and facilities management and transaction activities Short-lived briefing, project management and on-site production activities
Land developers/ Property developers, Firms and public bodies construction departments, Property firms, cooperatives and public institutions, BOT firms
Architects, Technical consultants, Safety consultants, Construction firms engineering, Firms engineering, Central and Local Government engineering
Building and Civil Engineering contractors,
Installation companies Finishing companies Site preparation services Construction management firms
Manufacturing and distribution activities Materials, components, equipment manufacturing Material distributors Machinery Importers Machinery hiring firms Institutional actors and regulations European Community Material Competition and procurement systems Financing R & D support State Structures Development Plans Safety Labour, Rents Competition and procurement systems Prices Financing, taxation R & D support Education and training Local Authorities Town planning Permits Financing Taxation Clients, professional, industrial organisations Material Firm standards Wages, working conditions Prices of products and services Education and training
Trade Unions
Wages, working conditions Consumers and Landlords organisations Prices of products and services (rents) Estate agencies, Firms and government departments,
Property firms, cooperatives and public institutions, BOT firms, Facilities management firms, Operators,
INSTITUTIONAL ACTORS AND MAIN REGULATIONS
Institutional Actors
The Portuguese construction sector system is characterised by the important roles played by the Central and Local Governments and the major construction companies. Table 13 below presents schematically the statutory domains of the main institutional actors in the built environment. The principal promoters in the construction market are the central government and local private housing investors, but international investors and financial companies have been increasingly playing an important role, namely, in the commercial property market and construction works in the concession regime.
The recent development of capital markets influenced the operating environment of major national construction enterprises through mergers and acquisitions. Another recent feature is the increasing market diversification of these companies, namely, in the property activities and utilities services. It is also worth noting that according to Decree Law 59/99, the concession consortiums must include at least one construction company. There are today three major holdings each with an annual turnover above EUR 500 million. They are Mota-Engil, Somague-Sacyr and Teixeira Duarte-Soares da Costa. The main representative organisations of Portuguese contractors are: AECOPS (Association of Building Construction and Public Work Contractors); ANEOP (National Association of Public Work Contractors); AICCOPN (Northern Industrial Association of Building Construction and Public Works); and AICE (Industrial Association of Builders). Their main functions are to represent the interests of their member associations to the Government and other public bodies related to the institutional environment of the construction industry, and to provide information and services concerning relevant aspects of the industry to their members.
Consultants (APPC).
Although the enforcement of the rules regarding the construction industry and related sectors pertains to the central and local governments, there has been an increasing concern on the part of industrial and professional associations for the safety, quality and environmental aspects of the built environment. The role of the European Community has also become more important lately.
Table 13 - Main Regulations and Institutional Actors
Construction permits Building regulations Rules concerning materials and quality systems Firm standards and professiona l rules Safety, human resources managemen t Agreement s on price and quality of products and Competition and procurement systems Finance Taxation RD Support Education European
Commission X X X X X
Government X X X X X X X X
Local Authorities
X X
Clients, Professional, Industrial Associations
X X X X X X
Trade Unions X
User Associations
X
Contracts, Competition and Procurement Systems
liability is excluded pursuant to those legal provisions. For instance, the impossibility to perform the work at the present state of the art, or if the defects resulting in the work appear in work of its nature, or if the defect could not be avoided on account of the degree of accuracy demandable from the contractor (Martinez, 1990).
Construction characteristics influence the construction market’s competition. Construction in Portugal is mainly a local market. Any company that wants to compete outside its own local market is charged with transport costs for labour, material and equipment. This is the case for small companies, which normally carry out their activity in the house building segment of the construction market (low capital intensity and lower works complexity). Generally, there are no real entry barriers, except for some segments of the industry, namely, in the civil engineering works, office and retail markets, which are the domain of major national companies. According to INOFOR (1999), the market quotation of construction enterprises in the stock exchange can only be enhanced if entry barriers are sufficiently effective, in conjunction with structural changes that differentiate trademarks and enterprises with high profitability (implying necessarily stability and recurrent profit making). The construction enterprises are according to the Decrees Laws 60/99 and 61/99 (Regime of Entry and Permanence in the Construction Activity) classified as either public work contractors or private work contractors. These two categories are further sub-divided into classes: class 1 to class 9. Thus, a class 1 company may only undertake works having a value up to EUR 125,000 (in 2001), while a class 9 company has no value limit imposed on its activity. Besides financial and economic capacity, the enterprises are differentiated by technical capability.
The traditional approach on procurement practices is by far the most commonly used in construction projects, especially in public construction projects. This approach may be the result derived from cultural reasons as well as the latent conflicting objectives of the different parties in the construction process. Owing to the changing industry structure, new contracting practices such as design-build and build-own-operate-transfer are being adopted. In 1999, the investment through the involvement of private sector accounted for 32% of the country’s total investment in the road networks (ANEOP, 2000). Instead of the traditional reliance on tight prescriptive specifications and low-price selection criteria, those practices allow, according to some advocates, ensuring the best value for one’s money. Several authors have already referred to the resistance to their use among some clients, many of whom are concerned about the quality of the finished project, inaccuracies in the client’s briefing, conflict between the briefing and the contractors proposal, and the dubious quality of the work done by some firms (for a more detailed account on this subject see e.g. de Valence, 2001). As regards Portugal, an account in the media making reference to the concession of road projects points to the risks associated with this kind of procurement practice, particularly the excessive weight given to the price factor to the detriment of safety.
most ‘economically advantageous’ tender, i.e. implying the weighting of different factors, namely, the ‘price, time, the cost of utilisation, the profitability and the technical value of the proposal.’ This appears to be somewhat contradictory to that stipulated in article 67º of the same Decree Law, which states that ‘the certificate of public work contractors constitutes a presumption for the capacity to trade, technical capacity and economic and financial capacity’ As regards the price factor, it is interesting to note that the Ministerial Order 15/72 (as amended in 1986) of the Ministry of Public Works provides instructions for the establishment of the fee level for project designs in public works (it is debatable whether the ministerial order applies to all public projects or only to those promoted by this ministry). What is unquestionable is that the price factor is one of the criteria for the selection of designers in public work projects (Decree Law 197/99) and the fee level rarely is higher than 5% of the price of the project contracts (Lopes and Ribeiro, 2001). The value stipulated in the Ministerial Order varies from 7 to 8%.
Building Regulations and Building Standards
The General Regime of Building and Urban Development enacted in 2001 (as an amendment of the formerly separate General Regime of Building and General Regime of Urban Development, both enacted in 1991) and the General Regulation of Urban Buildings enacted in 1951 (successively amended to take into account technical developments) constitute the core regulations for the Portuguese urban built environment. The former regulation deals with building and urbanisation work permits and covers the administrative procedures for building control and approval. The latter stipulates the mandatory minimum requirements concerning the safety, health and welfare of people in buildings and other urban facilities.
Mandatory detailed requirements are laid down (by means of Decree-Laws) in separate Regulations pertaining to structural safety, traditional materials, fire safety, acoustic and thermal comfort, water supply and waste water systems, electrical appliances, building installations, toxic and hazardous substances, and facilities for disabled people.
CONCLUSION
This paper constitutes an attempt to analyse the construction industry in Portugal using the construction sector system approach. This study implicates that such an analysis sheds more light on the roles the industries pertaining to the development of the built environment play in the global economy. Indeed, the data presented here have shown that if the activities of the construction industry, the construction professions, the property related professions and the building materials industry are collectively considered, their combined share in the GDP and the national total employment are, respectively, 1.72 and 1.46 compared to those pertaining to the construction industry. If the activities of the construction equipment manufacturing and distribution sectors, and the construction and construction-related government departments are added to this total, the construction sector system’s contribution to the national output is about 13%, and its share in the nation’s total employment is about 20%. Thus, this approach seems to be a promising methodology for dealing with international comparisons. However, compared to other important sectors of the economy, the research designated for the study of the construction sector encounters up front data limitations and measurement problems. It is not surprising that these problems tend to get worse when a more extensive scope is taken for the analysis. Further efforts are needed to investigate the usefulness of this analysis in the study of the construction sector in Portugal.
REFERENCES
- AECOPS (various years), Relatorio Anual da Construção, AECOPS, Lisbon.
- ANEOP (2000), Construção e Obras Públicas, Relatório Trimestral, ANEOP, O’Porto
- AEGIS (1999), Mapping the Building and Construction Product System in Australia, Department of Industry, Science and Resources, Canberra
- Bon, R. (1992) "The Future of International Construction: Secular Patterns of Growth and Decline", Habitat International, Vol. 16 (3) pp 119-128
- Carassus, J. (1999), "Construction System: From a Flow Analysis to a Stock Approach", Proceedings of the CIB TG31 International Workshop, Cape Town. CIB Publication Nº 240
- Carassus, J. (2000), “A Mesoeconomic Analysis of the Construction Sector Applied to the French construction Industry”, Proceedings of the Joint Meeting of CIB
Working Commissions W55 and W65 and Task Groups TG 23, TG 31 and TG 35,
The University of Reading, UK, September 13-15.
- INE-a (various issues), Contas Nacionais Trimestrais, Instituto Nacional de Estatística - INE, Lisbon
- INE-b (various issues), Estatísticas do Emprego, INE, Lisbon. - INE-c (various issues), Estatística das Empresas, INE, Lisbon.
- INE-d (2001), Census 2001-Recenseameno Geral da População, INE, Lisbon
- INE-e (various issues), Sistemas de Indicadores de Preços na Construção e Habitação, INE, Lisbon
- INOFOR (2000), Sector de Construçâo e Obras Públicas, Lisbon
- Martinez, P (1990) ‘Legal Aspects in Building Liability during and post Construction’ 2ª Encontro Nacional de Construção, LNEC, Lisbon
- Lopes, J. (2001), “The Impact of the Economic and Monetary Union on the Housing Market”, Property Management, Vol.5 (1), pp 25-32
Annual Conference, University of Salford, UK, 5-7 September 2001
- Magalhães, C. (1999) "The Expansion of British Property Consultants and the Transformation of Local Property Markets", RICS Research Conference- Cutting Edge 1999, UK.
- Organisation of Economic Cooperation and Development- OECD (1999), Report on Portugal, OECD