Autor Correspondente | Corresponding Author Recebido | Received: 22/08/2013 Aprovado | Approved: 11/03/2014 Publicado | Published: mar./2014
Summary
Pomegranate (Punica granatum L.) is a fruit with a long medicinal history, especially due to its phenolic compounds content, such as the anthocyanins, which are reported as one ofthe most important natural antioxidants. The analysis of the anthocyanins by high performance liquid chromatography (HPLC) can be considered as an important tool to evaluate the quality of pomegranate juice. For research laboratories the major challenge in using HPLC for quantitative analyses is the acquisition of high purity analytical standards, since these are expensive and in some cases not even commercially available. The aim of this study was to obtain analytical standards for the qualitative and quantitative analysis of the anthocyanins from pomegranate. Five vegetable matrices (pomegranate flower, jambolan, jabuticaba, blackberry and strawberry fruits) were used to isolate each of the six anthocyanins present in pomegranate fruit, using an analytical HPLC scale with non-destructive detection, it being possible to subsequently use them as analytical standards. Furthermore, their identities were confirmed by high resolution mass spectrometry. The proposed procedure showed that it is possible to obtain analytical standards of anthocyanins with a high purity grade (98.0 to 99.9%) from natural sources, which was proved to be an economic strategy for the production of standards by laboratories according to their research requirements. Key words:Liquidchromatography; Cyanidin; Delphinidin; Pelargonidin; Punica granatum L.
Resumo
Romã (Punica granatum L.) é um fruto com um longo histórico medicinal, especialmente devido aos compostos fenólicos presentes em sua composição, como as antocianinas, as quais são relatadas como um dos mais importantes antioxidantes naturais. A análise de antocianinas por Cromatografia Líquida de Alta Eficiência (CLAE) pode ser considerada uma ferramenta importante para avaliar a qualidade do suco de romã. Para os laboratórios de pesquisa, o maior desafio para a análise quantitativa pela técnica de CLAE é a aquisição de padrões analíticos de alta pureza, uma vez que eles são caros e, em alguns casos, não se encontram disponíveis comercialmente. O objetivo deste estudo foi obter padrões analíticos para a análise qualitativa e quantitativa de antocianinas da romã. Cinco matrizes vegetais (flor de romã e frutos de jambolão, jabuticaba, amora e morango) foram usadas para isolar cada uma das seis antocianinas presentes no fruto da romã, usando a escala analítica com detecção não destrutiva, sendo possível usá-las posteriormente como padrões analíticos. Além disso, as suas identidades foram confirmadas pela técnica de espectrometria de massa de alta resolução. O procedimento proposto mostrou que é possível obter padrões analíticos de antocianinas com elevado grau de pureza (98,0%-99,9%) a partir de fontes naturais e provou ser uma estratégia econômica para os laboratórios que necessitam adquirir padrões, de acordo com as necessidades de suas pesquisas. Palavras-chave:Cromatografia líquida; Cianidina; Delfinidina; Pelargonidina; Punica granatum L.
Autores | Authors
Manuela Cristina Pessanha de Araújo SANTIAGO Embrapa Agroindústria de Alimentos Laboratório de Cromatografia Líquida Avenida das Américas, 29501, Guaratiba CEP: 23020-470 Rio de Janeiro/RJ - Brasil e-mail: [email protected]
Ana Cristina Miranda Senna GOUVÊA Universidade Federal Rural do Rio de
Janeiro (UFRRJ) Programa em Pós-Graduação em Ciência e Tecnologia de Alimentos Seropédica/RJ - Brasil e-mail: [email protected]
Ronoel Luiz de Oliveira GODOY Renata Galhardo BORGUINI Sidney PACHECO Embrapa Agroindústria de Alimentos Laboratório de Cromatografia Líquida Rio de Janeiro/RJ – Brasil e-mail: [email protected] [email protected] [email protected]
Regina Isabel NOGUEIRA Embrapa Agroindústria de Alimentos Planta Piloto de Operações Unitárias I Rio de Janeiro/RJ - Brasil e-mail: [email protected]
Luzimar da Silva de Mattos do NASCIMENTO Embrapa Agroindústria de Alimentos Laboratório de Cromatografia Líquida Rio de Janeiro/RJ - Brasil e-mail: [email protected]
Suely Pereira FREITAS Universidade Federal do Rio de Janeiro (UFRJ), Departamento de Engenharia Química, Rio de Janeiro/RJ - Brasil e-mail: [email protected]
of pomegranate anthocyanins by HPLC
there are no commercial standards available for many of the anthocyanins found in nature.
The production of analytical standards of anthocyanins by isolation is considered to be a challenge, mainly due to the difficulties of obtaining crystalline anthocyanins, free from impurities, in sufficient amounts to allow for reliable weighing (GIUSTI et al., 1999). Thus the aim of this study was to isolate analytical anthocyanin standards from different matrices, using a practical and reliable method known as the analytical HPLC scale with non-destructive detection, for the qualitative and quantitative analysis of pomegranate fruit anthocyanins.
2 Materials and methods
2.1 Chemicals
HPLC grade acetonitrile, 96% formic acid and methanol were purchased from Tedia (USA). Ultrapure water was obtained from the Milli-QTM Gradient 10A System
(Merck Millipore, USA). Delphinidin-3,5-diglucoside chloride was purchased from Chromadex (USA).
2.2 Samples
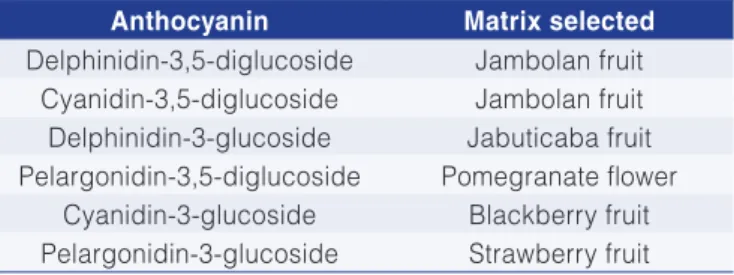
Samples with the potential for use as sources of the anthocyanins of interest, based on their high content of these compounds, were selected for this study as follows: pomegranate flower, jambolan (peel), jabuticaba (peel), blackberry (whole fruit) and strawberry (whole fruit) (Table 1). Pomegranate flowers were collected in the western region of Rio de Janeiro city. Pomegranate fruits (from the Brazilian semiarid region), strawberry (Fragaria spp.), jabuticaba (Plinia spp.) and jambolan (Syzygium cumini) fruits were purchased in the Rio de Janeiro market. Pomegranate juice was obtained by extraction from the arils. For the blackberry and strawberry juices, the whole fruits were processed in a blender. The jambolan and jabuticaba peels, blackberry and strawberry juices and the pomegranate flowers were freeze-dried in a LiotopTM
L101 (Liobras, Brazil) at –40ºC for 24 hours, and stored at -18 °C until extraction.
1 Introduction
The pomegranate (Punica granatum L.) fruit, native from Iran and endemic in the Middle East, grows in semiarid climates. In recent years there has been renewed interest in the global nutraceutical and functional benefits of this fruit, both fresh and processed (SUMNER et al., 2005).
The pomegranate fruit has some phenolic compounds such as anthocyanins (delphinidin, cyanidin and pelargonidin) in its composition, and also quercetin, phenolic acids and tannins (punicalagin). The fruit is consumed fresh or processed as juice and can be used in the food industry for the manufacture of juice beverages, soft drinks, confectionary products and also colorants (QU et al., 2011).
Due to the increased demand for healthy products, anthocyanin-rich fruits have great potential as raw materials in food formulations, acting as one of the most important natural antioxidants and being responsible for the intense red colour of pomegranate juice based products. The colour is one of the quality parameters that most promotes sensory acceptability by consumers (GIL et al., 2000; ALIGHOURCHI and BARZEGAR, 2009; BOROCHOV-NEORI et al., 2009; PATRAS et al., 2010). Thus, the analysis of anthocyanins by a reliable technique, such as HPLC, can be considered as an important tool to evaluate pomegranate juice quality. Besides the sensory-organoleptic characteristics, knowledge of the anthocyanin profile of pomegranate materials becomes important, since it allows for the identification of adulteration in these products(ZHANG et al., 2009). Thus the analysis of the anthocyanins by a reliable technique can also be considered as an important tool to evaluate pomegranate juice authenticity.
Studies on the characterization and quantification of the phytochemical and antioxidant properties of fruits have become essential and increase awareness about the different cultivars, whether natural or enhanced. Knowledge of the quality and chemical characteristics of some species provides subsidies to distinguish them from each other, and can also provide information to enable an improvement in their genetics, since the concentration and variety of types of the anthocyanins is what will determine the intensity of colouring of the various fruit cultivars (POMAR et al., 2005; ÖZGEN et al., 2009).
The major challenge in the quantitative analysis of compounds by HPLC, especially of anthocyanins, is the obtaining of analytical standards. Standardization is certainly the largest source of analytical errors, because it directly impacts the final result(KIMURA and RODRIGUEZ-AMAYA, 2002). In some countries the acquisition of high purity analytical standards usually depends on highly expensive importations, and in addition
Table 1. Vegetable matrices selected for the isolation of the anthocyanins.
Anthocyanin Matrix selected
Delphinidin-3,5-diglucoside Jambolan fruit Cyanidin-3,5-diglucoside Jambolan fruit Delphinidin-3-glucoside Jabuticaba fruit Pelargonidin-3,5-diglucoside Pomegranate flower
SymmetryTM C
18 column (150 mm × 4.6; 3.5 µm; Waters;
USA) was used with an injection volume of 50µL, mobile phase consisting of 5% aqueous formic acid (solvent A) and acetonitrile (solvent B), in the gradient elution mode (Table 3) with a flow rate of 1.0 mL min1. The column
temperature was 40 °C.
2.6 Anthocyanin isolation method
The anthocyanins were isolated by liquid chromatography coupled to a Rheodyne six-channel selection valve (GOUVÊA et al., 2012). The valve was adapted to select output channels rather than possible columns, replacing the traditional fraction collector. Substances of interest were collected on elution, according to the retention time of each anthocyanin, using a selector valve commanded by EmpowerTM software
(Waters, USA).
2.7 Concentration of the standards
For the concentration step, a Waters (USA) Sep-PakTM C
18 cartridge previously packed with methanol
was saturated with the aqueous extract of the isolated anthocyanins. The cartridge was then washed with an aqueous solution of 0.01% HCl to remove the more polar compounds present, such as sugars and phenolic acids, and the anthocyanin pigments retained were eluted with methanol. The eluted anthocyanin pigments were dried under a filtered compressed air flow, and diluted with a 5% formic acid solution in water: methanol (90:10, v/v) in a 5 mL amber volumetric flask. Aliquots of each isolated anthocyanin were injected under the same chromatographic conditions described above, and the peak areas used to check the purity.
2.8 MS/MS condition
A high resolution Waters mass spectrometer (USA) SynaptTM ESI-QTOF, with direct injection, was used to
confirm the identity of the anthocyanins isolated. The MS source used was positive electrospray ionization (ESI+)
with the following conditions: source temperature at 120 °C, desolvation gas (N2) delivered at 12.5 L min–1 at 500
°C, capillary exit set at 3.0 kV, sampling cone energy set at 25.0 V and extraction cone energy set at 4.0V.
2.9 Calculation of the concentrations of the standards
200 µL aliquots of the solutions obtained after concentration were collected, dried under a filtered compressed air flow and diluted with 2.0 mL of the appropriate solution for each anthocyanin, according to the molar absorptivity used (Table 4). The corresponding anthocyanin concentration of these solutions was calculated using the Beer-Lambert law from the 2.3 Sample extraction
Two grams of each freeze-dried sample were weighed into four centrifuge tubes with lids for extraction with methanol: formic acid (10:90, v/v) under sonication, following by centrifugation(BRITO et al., 2007). All the materials obtained in the supernatants after extraction were concentrated using a Büchi RE rotatory evaporator (Switzerland) at 38 °C for 4 hours. The dried extract was diluted with 4 mL of a 5% formic acid solution in water: methanol (90:10, v/v) and filtered through a hydrophilic type MillexTM membrane (0.45 µm; Merck Millipore; USA)
directly into an automatic chromatograph injector vial.
2.4 HPLC-PDA evaluation of the anthocyanins
Chromatographic analysis was carried out following the methodology described by Brito et al. (2007), using a Waters (USA) AllianceTM 2695 system equipped with a
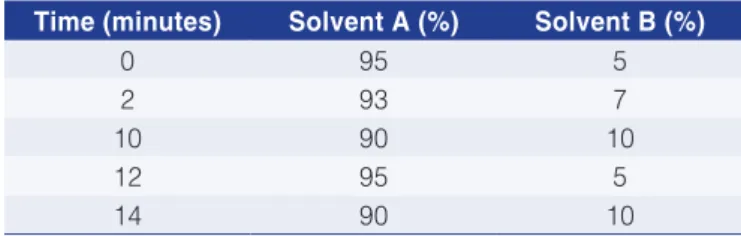
Waters2996 photodiode array detector (at 520 nm). A Thermo Scientific C18 BDS (100 mm × 4.6 mm; 2.4 µm; USA) column was used with an injection volume of 20µL, mobile phase consisting of 5% aqueous formic acid (solvent A) and acetonitrile (solvent B) in the gradient elution mode (Table 2) with a flow rate of 1.0 mL min1. The
column temperature was 40 °C.
2.5 Conditions for the isolation of the anthocyanins by HPLC-PDA
The anthocyanins were isolated following the methodology described by Brito et al. (2007) using a Waters (USA) AllianceTM 2695 system equipped with a
Waters2996 photodiode array detector (at 520 nm). A
Table 2. Gradient elution mode for the evaluation of the anthocyanins.
Time (minutes) Solvent A (%) Solvent B (%)
0 95 5
2 93 7
10 90 10
12 95 5
14 90 10
Solvent A: 5% aqueous formic acid. Solvent B: acetonitrile
Table 3. Gradient elution mode for isolation of the anthocyanins.
Time (minutes) Solvent A (%) Solvent B (%)
0 95 5
2 95 5
10 90 10
15 87 13
16.5 80 20
18 95 5
20 95 5
detected and quantified using the proposed analytical method.
The purity of the isolated anthocyanins was calculated by evaluating the peak area of each one in relation to the total area of the chromatogram. Verification of the purity of the compounds at different wavelengths ensured an accurate calculation of their concentration. The purity of the isolated anthocyanins was also checked at 280 and 360nm, since at those wavelengths occurs the absorption by other compounds that could cause interference, such as other phenolic compounds (GIUSTI et al., 1999). Values above 90% of purity were obtained for all the six compounds evaluated at these two wavelengths.
T h e h i g h v a l u e s f o r p u r i t y o b t a i n e d ensured there were no inter fering substances that could cause bathochromic or hypsochromic effects of the ultraviolet/visible absorption spectra. The compounds isolated in the 5% formic acid: methanol (90:10, v/v) solution showed values for concentration that were in an appropriate range to permit the construction absorbance reading obtained using a Shimadzu UV-1800
spectrophotometer (Japan).
2.10 Product evaluation
The anthocyanin profile of the different pomegranate products such as the juice and microcapsules, obtained in the laboratory using a spray drying process, were evaluated to verify the application of the method.
3 Results and discussion
T h e c h r o m a t o g r a m o b t a i n e d f r o m t h e pomegranate juice presented six anthocyanins (delphinidin-3,5-diglucoside; cyanidin-3,5-diglucoside; delphinidin-3-glucoside; pelargonidin-3,5-diglucoside; cyanidin-3-glucoside; pelargonidin-3-glucoside) (Figure 1). The same anthocyanins profile was reported by Gil et al.(2000) for pomegranate juice.
The six fruits chosen as anthocyanin sources made it possible to isolate these compounds by the HPLC technique with a great grade of purity at 520nm (Figure 2), which is the same wavelength that the anthocyanins are
Table 4. Maximum absorption (λ), specific solution used and molar absorptivity of each pomegranate anthocyanin.
Anthocyanins λ (nm) Specific solution Molar Absorptivity
Delphinidin-3,5-diglucoside 520 1% HCl in MeOH 40368*
Cyanidin-3,5-diglucoside 508.5 1% HCl in MeOH 35000**
Delphinidin-3-glucoside 543 1% HCl in MeOH 29000**
Pelargonidin-3,5-Diglucoside diglucoside 510 1% HCl in MeOH 32360**
Cyanidin-3-glucoside 530 1% HCl in MeOH 34300**
Pelargonidin-3-glucoside 496 1% HCl in H2O 31620**
*Molar absorptivity calculated by spectrophotometry using a commercial analytical standard of the anthocyanin, purchased from Chromadex-(USA). **Source: Giusti et al. (1999).
Figure 2. Chromatogram and UV/Vis spectra at 520nm of the isolated anthocyanins: a) delphinidin-3,5-diglucoside; b) cyanidin-3,5-diglucoside; c) delphinidin-3-glucoside; d) pelargonidin-cyanidin-3,5-diglucoside; e) cyanidin-3-glucoside; f) pelargonidin-3-glucoside.
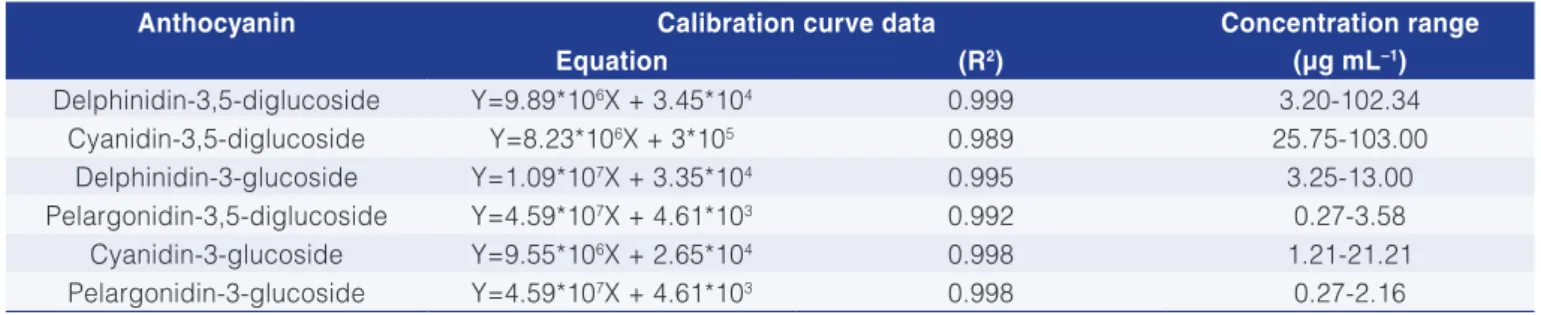
of highly linear calibration curves (Table 5), allowing for the quantification of the matrix evaluated.
All the six anthocyanins isolated could be used as analytical standards, since besides the high grade of purity, the identity of each was confirmed by a reliable technique, such as high resolution mass spectrometry (Table 6).
to be a feasible alternative for laboratories to produce standards according to their research requirements.
Furthermore, these standards could be used in the analysis of other matrices where the same anthocyanins are present.
Acknowledgments
To CNPQ and FAPERJ for their financial support.
References
ALIGHOURCHI, H.; BARZEGAR, M. Some physicochemical characteristics and degradation kinetic of anthocyanin of reconstituted pomegranate juice during storage. Journal of Food Engineering, Oxford, v. 90, n. 2, p. 179-185, 2009. http:// dx.doi.org/10.1016/j.jfoodeng.2008.06.019
BOROCHOV-NEORI, H.; JUDEINSTEIN, S.; TRIPLER, E.; HARARI, M.; GREENBERG, A.; SHOMER, I.; HOLLAND, D. Seasonal and cultivar variations in antioxidant and sensory quality of pomegranate (Punica granatum L.) fruit. Journal
in the quantification step than by using cyanindin-3-glucoside equivalents.
The proposed method is an important tool for the quality control of pomegranate drinks and other pomegranate products. The possibility of this evaluation is important not only for consumers but also for industry, since it can be used to understand and optimize some of the operational parameters that could influence the stability of the bioactive compounds, in this case, more specifically, of the anthocyanins.
Using the isolated anthocyanins and the calibration curves prepared, it was possible to evaluate the contents of these compounds in different pomegranate products such as juice and the microcapsules obtained by spray drying, as shown in Table 7.
4 Conclusion
The proposed procedure showed that it was possible to obtain analytical anthocyanin standards with a high grade of purity from natural sources, and proved
Table 5. Data for the external standard calibration curves.
Anthocyanin Calibration curve data Concentration range
(µg mL–1)
Equation (R2)
Delphinidin-3,5-diglucoside Y=9.89*106X + 3.45*104 0.999 3.20-102.34
Cyanidin-3,5-diglucoside Y=8.23*106X + 3*105 0.989 25.75-103.00
Delphinidin-3-glucoside Y=1.09*107X + 3.35*104 0.995 3.25-13.00
Pelargonidin-3,5-diglucoside Y=4.59*107X + 4.61*103 0.992 0.27-3.58
Cyanidin-3-glucoside Y=9.55*106X + 2.65*104 0.998 1.21-21.21
Pelargonidin-3-glucoside Y=4.59*107X + 4.61*103 0.998 0.27-2.16
Table 6. Identification of the anthocyanins isolated by high resolution mass spectrometry.
Peak tR (min) [M]+ (m/z) MS/MS (m/z) Anthocyanin
1 1.8 627.1781 465.1274/303.0672 Delphinidin-3,5-diglucoside
2 2.6 611.1812 449.1287/287.0653 Cyanidin-3,5-diglucoside
3 2.9 465.1115 303.0608 Delphinidin-3-glucoside
4 3.6 595.2229 433.1647/271.1086 Pelargonidin-3,5-diglucoside
5 4.0 449.1287 287.0716 Cyanidin-3-glucoside
6 5.4 433.1424 271.0739 Pelargonidin-3-glucoside
Table 7. Anthocyanin concentrations in raw pomegranate juice and microcapsules obtained by spray drying.
Anthocyanin Concentration (mg 100g–1)*
Raw juice Microcapsules
Delphinidin-3,5-diglucoside 8.32 ± 0.45 27.00 ± 0.74
Cyanidin-3,5-diglucoside 10.78 ± 0.40 57.42 ± 1.17
Delphinidin-3-glucoside 0.53 ± 0.01 3.23 ± 0.03
Pelargonidin-3,5-diglucoside 0.49 ± 0.02 1.93 ± 0.18
Cyanidin-3-glucoside 5.50 ± 0.18 20.43 ± 0.56
Pelargonidin-3-glucoside 0.46 ± 0.01 1.49 ± 0.12
and corresponding juices. Journal of Food Science, Chicago, v. 77, n. 4, p. 340-345, 2012. PMid:22394068. http://dx.doi. org/10.1111/j.1750-3841.2011.02605.x
ÖZGEN, M.; SERÇE, S.; KAYA, C. Phytochemical and antioxidant properties of anthocyanin-rich morus nigra and morus rubra fruits. Scientia Horticulturae, Kent, v. 119, n. 3, p. 275-279, 2009. http://dx.doi.org/10.1016/j.scienta.2008.08.007
PATRAS, A.; BRUNTON, N. P.; O’DONNELL, C.; TIWARI, B. K. Effect of thermal processing on anthocyanin stability in foods: mechanisms and kinetics of degradation. Trends in Food Science and Technology, Cambridge, v. 21, n. 1, p. 3-11, 2010. http://dx.doi.org/10.1016/j.tifs.2009.07.004
POMAR, F.; NOVO, M.; MASA, A. Varietal differences among the anthocyanin profile of 50 red table grape cultivars studied by high performance liquid chromatography. Journal of Chromatography A, Amsterdam, v. 1094, n. 1-2, p.34-41, 2005.
QU, W.; BREKSA III, A. P.; PAN, Z.; MA, H. Quantitative determination of major polyphenol constituents in pomegranate products. Food Chemistry, New York, v. 132, n. 3, p. 1585-1591, 2011. http://dx.doi.org/10.1016/j.foodchem.2011.11.106
SUMNER, M. D.; ELLIOTT-ELLER, M.; WEIDNER, G.; DAUBENMIER, J. J.; CHEW, M. H.; MARLIN, R. Effects of pomegranate juice consumption on myocardial perfusion in patients with coronary heart disease. Journal of Cardiology, Japan, v. 96, n. 6, p. 810-814, 2005. PMid:16169367. http:// dx.doi.org/10.1016/j.amjcard.2005.05.026
ZHANG, Y.; WANG, D.; LEE, R. P.; HENNING, S. M.; HEBER, D. California hass avocado: profiling of carotenoids, tocopherol, fatty acid, and fat content during maturation and from different growing areas. Journal of Agricultural and Food Chemistry, Washington, v. 57, n. 21, p. 7395-7400, 2009. PMid:20349921. http://dx.doi.org/10.1021/jf9010017
of Food Composition and Analysis, San Diego, v. 22, n. 3, p. 189-195, 2009. http://dx.doi.org/10.1016/j.jfca.2008.10.011
BRITO, E. S.; ARAUJO, M. C. P.; ALVES, R. E.; CARKEET, C.; CLEVIDENCE, B. A.; NOVOTY, J. A. Anthocyanins present in selecred tropical fruits: acerola, jambolão, jussara and guajiru.
Journal of Agriculture and Food Chemistry, Washington, v. 55, n. 23, p. 9389-9394, 2007. PMid:17929888. http://dx.doi. org/10.1021/jf0715020
GIL, M.; TOMAS-BARBERAN, F. A.; HESS-PIERCE, B.; HOLCROFT, D. M.; KADER, A. A. Antioxidant activity of pomegranate juice and its relationship with phenolic composition and processing. Journal of Agricultural and Food Chemistry, Washington, v. 48, n. 10, p. 4581-4589, 2000. http://dx.doi. org/10.1021/jf000404a
GIUSTI, M. M.; RODRÍGUEZ-SAONA, L. E.; WROLSTAD, R. E. Molar absorptivity and color characteristics of acylated and non-acylated pelargonidin-based anthocyanins. Journal of Agricultural and Food Chemistry, Washington, v. 47, n. 11, p. 4631-4637, 1999. http://dx.doi.org/10.1021/jf981271k
GOUVÊA, A. C. M. S.; SANTIAGO, M. C. P. A.; PACHECO, S.; GODOY, R. L. O.; CABRAL, L. M. C. Anthocyanins standards (cyanidin-3-O-glucoside and cyanidin-3-O-rutenosideo) isolation from freeze-dried açaí (Euterpe oleraceae Mart.) by HPLC. Ciência e Tecnologia de Alimentos, Campinas, v. 32, n. 1, p. 43-46, 2012. http://dx.doi.org/10.1590/S0101-20612012005000001
KIMURA, M.; RODRIGUEZ-AMAYA, D. B. A Scheme for obtaining standards and hplc quantification of leafy vegetable carotenoids.
Food Chemistry, New York, v. 78, n. 3, p. 389-398, 2002. http:// dx.doi.org/10.1016/S0308-8146(02)00203-0