ACTAS
Proceedings
ISBN 978-989-96353-2-6
GESTÃO DE BENS COMUNS
E DESENVOLVIMENTO REGIONAL SUSTENTÁVEL
BRAGANÇA – ZAMORA29 JUNHO A 02 JULHO 2011
17.º CONGRESSO DA APDR
5.º Congresso de Gestão e Conservação da Natureza
APDR
Universidade dos Açores Rua Capitão João D’Ávila 9700-042 Angra do Heroísmo
www.apdr.pt
AECR
C/ Viladomat, 321 entresuelo 08029 Barcelona
www.aecr.org
COMISSÃO ORGANIZADORA
Ana Pardo Fanjul (AECR/ Universidad de León) Angel Prieto Guijarro (AECR/ CSIC Salamanca) Ángeles Marín Rivero (AECR/Univ. de León) António Fernandes (Inst.Politéc.de Bragança) Antonio Maya Frades (AECR/ Univ.de León) Elisabete Martins (APDR)
João Azevedo (Inst. Politéc.de Bragança)
Jose Jorge Nogales García (AECR/ Univ. de Valladolid)
José Manuel Díez Modino (AECR/ Univ. de León) Juan Carlos Gamazo Chillón (AECR/ Junta de Castilla y León)
Natividad Gonzaler (Fundación Rei Afonso Henriques - Zamora)
Orlando Rodrigues (Inst. Politéc. de Bragança) Sílvia Nobre (Instituto Politéc. de Bragança)
Tomaz Ponce Dentinho (APDR/Universidade dos Açores)
COMISSÃO CIENTÍFICA
A. Idrissa Embalo (Univ. Amilcar Cabral); Adolfo Rodero Franganillo (AECR/ ETEA Córdoba); Adriano Pimpão (Univ. do Algarve); Alfredo Marvão Pereira (College of William and Mary in Williamsburg); Ana Lúcio Sargento (Inst. Polit. de Leiria); Ángel Prieto Guijarro (AECR/ CSIC Salamanca); Ángeles Marín Rivero (AECR/ Univ. de León); António Almeida (Univ. da Madeira); Cássio Rolim (Univ. Federal do Paraná); Conceição Rego (Univ. de Évora); Eduardo Castro (Univ. de Aveiro); Eduardo Haddad (ABER/ Univ. de S. Paulo); Emilia Pepeka (Inst. Sup. de Ciências da Educ. do Huambo); Francisco Carballo-Cruz (Univ. do Minho); João Azevedo (Inst. Polit. de Bragança); Jorge Sousa Brito (Univ. Jean Piaget de Cabo Verde); José Pedro Pontes (Univ. Técnica de Lisboa); José Silva Costa (Univ. do Porto); Juan Cuadrado Roura (AECR/ Univ. de Alcala);Livia Madureira (APDEA/ Univ. de Trás-os-Montes e Alto Douro); Luis Fonseca (Univ. do Algarve); Luis Moreno (SPER/ Univ. de Lisboa); Luis Quinta Nova (Inst. Polit. de Castelo Branco); Mário Fortuna (Univ. dos Açores); Miguel Marquez (AECR/Univ. da Extremadura); Miranda Miguel (Inst. Sup. De Ciências da Educ. do Huambo); Nuno Martins (Univ. Católica Portuguesa); Orlando Rodrigues (Inst. Polit. de Bragança); Paulo A. L. D. Nunes (Cà Foscari Univ. of Venice); Paulo Carvalho Tomás (SPER/ Univ. de Coimbra); Paulo Guimarães (Univ. of South Carolina); Pedro Ramos (Univ. de Coimbra); Rita Anastácio (Inst. Polit. de Tomar); Rosalina Gabriel (Univ. dos Açores); Rui Baptista (Inst. Sup. Técnico); Teresa Vaz de Noronha (Univ. do Algarve); Tomaz Ponce dentinho (Univ. dos Açores); Xavier Vence (AECR/ Univ. de Santiago de Compostela).
INSTITUTO POLITÉCNICO DE BRAGANÇA
Escola Superior Agrária de Bragança Campus de Santa Apolónia - Apartado 1172 5301-855 Bragança
http://esa.ipb.pt/
FUNDACIÓN REI AFONSO HENRIQUES
Avda. Nazareno de San Frontis, s/n 49027 Zamora (Espanha)
INDÍCE
SESSÃO 1 - GESTÃO DE BENS COMUNS E DESENVOLVIMENTO REGIONAL
SUSTENTÁVEL ... 10
Proteção Aos Bens Comuns: Ensaio Comparado Acerca Da Legislação Portuguesa E Brasileira ... 11
O Princípio Do Desenvolvimento Econômico E Social Ecologicamente Sustentável A Partir Das Ações Compensatórias De Empresas Mineradoras De Carvão:O Caso Da Empresa Copelmi 22 Aprendizagem Coletiva E Regulação Na Gestão De Espaços E Recursos: O Caso Da Comunidade Rural Lagoa Dos Cavalos (Ceará, Brasil)... 34
Consumo De Materiais E Responsabilidade Social E Corporativa: Um Estudo Na Universidade Estadual Do Sudoeste Da Bahia, Brasil ... 51
Management Of Community Territories: Interorganizaitonal Communication ... 65
SESSÃO 2 - GLOBALIZAÇÃO E DESENVOLVIMENTO REGIONAL ... 73
Mobilidade Laboral Na Região Centro 2004-2008 ... 74
Economia Da Zona Da Mata De Pernambuco: Algo De Novo? Mais Do Mesmo? ... 95
Concentração E Evolução Da Indústria De Livros No Brasil: Um Enfoque Regional No Período 2000 A 2007 ... 117
O Posicionamento Da Marca Vinho Do Porto No Panorama Nacional ... 133
SESSÃO 3 - INOVAÇÃO E TERRITÓRIO ... 145
Reestruturação Produtiva E Inovação No Setor Sisaleiro Do Estado Da Paraíba, Brazil 146 A Efetividade Da Lei Brasileira De Resíduos Sólidos No Aterro De Arcoverde/Pernambuco/Brasil E O Desenvolvimento Regional ... 157
Políticas De Desenvolvimento Rural No Norte Brasileiro: A Implantação Do Programa Território Da Cidadania No Estado De Rondônia ... 166
Pernambuco: Mudanças Recentes E Seus Impactos Econômicos Na Indústria Sucroalcooleira ... 180
Empreendedorismo, Inovação E Desenvolvimento Local: As Micro E Pequenas Empresas Do Interior Norte De Portugal ... 193
SESSÃO 4 - ECONOMIA DOS RECURSOS NATURAIS E AMBIENTAIS & GESTÃO E CONSERVAÇÃO DA NATUREZA ... 208
Compatibilização De Informação Geográfica: Carta De Valores Faunísticos Do Parque Natural Das Serras De Aire E Candeeiros... 209
A Reserva Da Faia Brava: Um Exemplo De Conservação E Gestão Sustentável Da Natureza ... 222
Infra-Estruturas De Dados Espaciais E Gestão Ambiental Transfronteiriça: Caso De Estudo Do Parque Natural Do Douro Internacional E Do Parque Natural Arribes Del Duero ... 236
Metodologia Para Elaboração Da Carta De Valores Da Vegetação Do Parque Natural Das Serras De Aire E Candeeiros ... 262
SESSÃO 5 - SISTEMAS DE APOIO À DECISÃO PARA O DESENVOLVIMENTO REGIONAL ... 275 Iguais Mas Diferentes: A Importância Em Regionalizar Os Modelos De Projecção Da População Portuguesa ... 276
Modelo Demográfico No Projecto De Investigação Demospin ... 290
As Relações Entre Pmes, Empreededorismo E Sustentabilidade Local: Uma Análise À Industria E Construção No Vale Do Sousa ... 306
Segregación Laboral De La Mujer En Galicia ... 328
Estimação De Uma Superfície Hedónica De Preços Para O Mercado Habitacional Em Portugal ... 333
SESSÃO 6 - GLOBALIZAÇÃO E DESENVOLVIMENTO REGIONAL ... 354
Assimetrias Regionais Na Região Norte De Portugal: Uma Análise De Clusters ... 355
O Desenvolvimento Regional, Um Olhar Neo-Schumpeteriano - Apl Da Fruticultura Do Rio Grande Do Norte – Brasil ... 366
Crisis Económica, Mercado De Trabajo Y Población Inmigrante En Andalucía: Sus Potencialidades Para El Desarrollo Regional Sostenible ... 376
As Caixas De Aforros E A Incidencia No Seu Entorno: Unha Aproximación A Partir Das Participacións Empresariais Das Caixas De Aforros Galegas No Período 2005-2010 ... 398
SESSÃO 7 - DESENVOLVIMENTO LOCAL E RURAL ... 412
Aldeias Vinhateiras, Turismo E Desenvolvimento Local: Os Casos De Salzedas E Ucanha .. 413
Método De Identificação Do Grau De Gestão (Migg) Em Atividades Agrícolas ... 423
O Modelo “Triple Helix” E O Desenvolvimento Das Regiões: A Perspectiva Das Empresas Dos Distritos De Castelo Branco, Guarda E Viseu ... 432
O Sistema Integrado De Avaliação Do Desempenho No Instituto De Segurança Social, I.P. . 451
Desenvolvimento Do Território E Conservação Da Natureza, Duas Faces Da Mesma Moeda: O Caso Do Sítio Serra De Montemuro ... 474
SESSÃO 8 - VÁRIOS EN ... 494
The Contribution Of Endemic Plant Species With Economical Value To The Sustainable Development Of Azores Region: The Case Of Azorean Blueberry. ... 495
Evolutionary History Of The Iberian Honey Bee (Apis Mellifera Iberiensis): A Genome-Wide Approach ... 501
Guimarães Residents’ Perceptions Towards Tourism Impacts: A Cluster Analysis ... 510
The Common Property Problem Revisited: The Legacy Of Jens Warming ... 520
Solving The “Commons Tragedies” With Rights Based Management. The Reform Of The Common Fisheries Policy ... 527
Desenvolvimento Regional E Sustentabilidade: Uma Análise Crítica A Partir Do Impacto Das Políticas Públicas Na Evolução Dos Factores De Coesão Na Região Do Alto Trás-Os-Montes
... 545
Informação Geográfica E Igt. A Realidade Municipal No Algarve ... 567
Cenários E Modelos Amazônicos: Turismo Na Região Metropolitana De Manaus ... 580
Alteração Do Leito Da Ribeira Da Agualva: Uma Abordagem Interdisciplinar Para Uma Intervenção Após Um Desastre Natural ... 591
SESSÃO 10 - TURISMO E DESENVOLVIMENTO SUSTENTÁVEL ... 611
O Santuário De Nossa Senhora Dos Remédios: Devoção Ou Turismo? ... 612
Turismo Sustentável: Dimensões Sociais E Ambientais ... 626
Metodologia De Inventariação De Recursos Turísticos Para O Território Do Alentejo ... 635
Papel Do Cluster De Turismo De Porto De Galinhas No Desenvolvimento Local. ... 643
Turismo Em Espaço Rural: Tendências E Oportunidades ... 666
SESSÃO 11 - VÁRIOS EN ... 684
Macro-Region Resoe (North Of Portugal, Galicia And Castile And Leon), A New Type Of Division Inside European Union. ... 685
Methodological Issues For Estimating The Total Value Of The Rehabilitation Of Mining Fields: The Case Of S. Domingos ... 693
Fdi In Portugal And Embraer Investments: The Effects On Portuguese Regional Development ... 716
SESSÃO 12 - ECONOMIA DOS RECURSOS NATURAIS E AMBIENTAIS & GESTÃO E CONSERVAÇÃO DA NATUREZA ... 728
Economia Do Meio Ambiente: Olhar Linguístico-Psicológico ... 729
A Biodiversidade Dos Sistemas Florestais – A Percepção Dos Proprietários Florestais ... 742
Marca Del Territorio Como Instrumento De Identidad, Conservacion De Recursos Ambientales Y Comercio Justo Para La Localidad Del Paramo Sumapaz ... 748
Valoração De Serviços Ambientais De Aprovisionamento Gerados Em Territórios Agro Silvo-Pastorís ... 766
Gestão Ambiental E Ordenamento Do Território Em Espaços Insulares. A Rede Regional De Áreas Protegidas Da Região Autónoma Dos Açores... 776
SESSÃO 13 - INSTRUMENTOS DE ORDENAMENTO DO TERRITÓRIO & REGIONALIZAÇÃO E FINANÇAS REGIONAIS E LOCAIS ... 788
Cartas De Zonas Inundáveis Para O Planeamento Urbano ... 789
¿Condiciona La Incertidumbre Las Decisiones De Consumo De Las Familias? Un Análisis Con Datos Regionales Españoles ... 798
A Probabilidade De Reeleição Do Autarca Em Funções Enquanto Doseadora De Comportamentos Eleitoralistas ... 814
A Contratualização Em Subvenção Global: Territorialização De Políticas Públicas E Governação Com Base Nas Comunidades Intermunicipais ... 830
SESSÃO 14 - GESTÃO DE BENS COMUNS E DESENVOLVIMENTO REGIONAL
SUSTENTÁVEL ... 859
Gestão De Estacionamento No Pólo I Da Uc – Um Caso De “Tragédia Dos Comuns”? ... 860
Centros De Gestión Veredal Cgv En Comunidades Campesinas Del Páramo De Sumapaz, Ruralidad De Bogotá, Colombia ... 871
A Importância Do Marketing Territorial No (Re)Posicionamento De Uma Estância Termal. O Caso De S. Pedro Do Sul. ... 888
Das Políticas Públicas De Desenvolvimento Local Rural Aos Territórios Da Cidadania No Brasil ... 905
SESSÃO 15 - POLÍTICA AGRÍCOLA E BENS PÚBLICOS ... 915
Evolução Da Agricultura Portuguesa No Período 1989/2010. Análise De Indicadores Relevantes. ... 916
Produtos Dop/Igp Em Portugal: Da Qualificação Ao Mercado ... 923
Contribuições Da Cafeicultura Orgânica Para O Desenvolvimento Rural Sustentável ... 950
A Ocupação Florestal Das Serras Da Cordilheira Central – Lógicas De Ocupação E Desafios Para O Seu Ordenamento ... 963
SESSÃO 16 - ECONOMIA DOS RECURSOS NATURAIS E AMBIENTAIS & GESTÃO E
CONSERVAÇÃO DA NATUREZA ... 975
Microeconomia Neoclássica Do Meio Ambiente ... 976
As Tramas Da Questão Hídrica Global: Uma Análise A Partir Da Transformação Da Água Num Bem Público Dotado De Valor Econômico E Dos Comitês De Bacias Hidrográfica No Brasil . 988
Energia Cara Ou A Falta Dela? (In)Certezas Num Tempo Incerto ... 1000
Avaliação Do Potencial De Produção E Utilização Sustentável De Biomassa Para Energia No Distrito De Bragança ... 1008
SESSÃO 17 - FRONTEIRAS E DESENVOLVIMENTO ... 1022
Analysis Of The Causal Relation Between Construction Activity And The Gross Domestic Product Of Two Neighbouring Economies: Portugal And Spain ... 1023
O Cluster Do Têxtil/Vestuário Na Euroregião Galiza – Norte De Portugal: Um Ambicioso Desafio De Cooperação Económica Transfronteiriça ... 1034
“Especialização Produtiva E Comercial De Trás-Os-Montes E Alto Douro – Um Sério Entrave Ao Seu Desenvolvimento” ... 1055
Recursos Humanos Y Mercado De Trabajo En La Eurorregion Galicia Norte De Portugal ... 1072
The Economic Performance Of Portuguese And Spanish Regions: A Network Dynamics Approach ... 1084
SESSÃO 18 - SUSTENTABILIDADE URBANA ... 1098
Juventude E Cidade: Refletindo Sobre A Sustentabilidade No Espaço Urbano ... 1099
Implantação De Redes-Serviços De Água E Esgoto Em Favelas Do Rio De Janeiro E Salvador E A Questão Da Sustentabilidade Urbana ... 1106
“Campo Térmico Da Baixa Atmosfera Urbana Em Condições De Acentuado Arrefecimento Nocturno - O Caso Da Figueira Da Foz (Portugal) ” ... 1127
SESSÃO 19 - ENSINO E INVESTIGAÇÃO EM CIÊNCIA REGIONAL & INOVAÇÃO E
TERRITÓRIO ... 1137
Reflexões Sobre Os Rumos Da Administração Política ... 1138
O Índice De Desenvolvimento Familiar - Idf Como Ferramenta Para Análise E Gestão De Políticas Sociais Em Unidades Intra-Urbanas1 ... 1151 Scoreboard Europeu Da Inovação ... 1165
Abordagens Participadas E Colectivas Da Formação No Contexto Do Poder Local E Na Perspectiva Do Conhecimento Como Bem Comum ... 1176
Ensaio Sobre Voluntariado Nos Açores. Inquérito Nas Instituições De Solidariedade Social Aos Valores E Atitudes Do Voluntariado ... 1187
SESSÃO 20 - ECONOMIA DOS RECURSOS NATURAIS E AMBIENTAIS & GESTÃO E
CONSERVAÇÃO DA NATUREZA ... 1201
Fontes De Financiamento Para Mecanismo De Desenvolvimento Limpo Na Região Nordeste Do Brasil ... 1202
Índice De Potencial Natural Para O Médio Tejo ... 1213
Conservação E Desenvolvimento: Modelos De Governação Em Áreas Protegidas ... 1225
As Salinas Tradicionais De Castro Marim: A Importância Da Gestão Para O Desenvolvimento Local E A Manutenção Da Biodiversidade ... 1240
SESSÃO 21 - METROPOLIZAÇÃO, PLANEAMENTO ESTRATÉGICO E
SUSTENTABILIDADE ... 1264
Territorial Strategic Planning As A Support Instrument For Regional And Local Development: A Comparative Analysis Between Lisbon And Barcelona Metropolitan Areas ... 1265
Um Esboço Sobre A Competitividade Urbana Na Área De Lisboa ... 1273
Baixa De Lisboa E Vila De Oeiras: De Um Legado Partilhado À Potencialidade De Um Símbolo – Um Projecto De Turismo E Competitividade Urbana ... 1294
Construir Territórios Resilientes: Os Sistemas De Informação Geográfica No Apoio À Decisão - Proposta De Metodologia Para A Area Metropolitana De Lisboa ... 1304
O Cluster Do Mar Português: Análise E Planeamento ... 1312
SESSÃO 22 - SUSTENTABILIDADE URBANA & MODELOS OPERACIONAIS DE
ECONOMIA REGIONAL ... 1335
Uma Cidade Sustentável, Um Território Coeso: O Exemplo Da Figueira Da Foz. Filosofia De Um Projecto Integrado De Planeamento E Ordenamento Do Território. ... 1336
“Monitorização Ambiental Do Município Da Figueira Da Foz (Portugal) ” ... 1346
A Importância Do Espaço Na Análise Do Mercado Da Habitação ... 1353
Avances En El Ajuste De Matrices Input-Output: Su Relevancia Para El Análisis Del Impacto Económico Del Turismo ... 1369
SESSÃO 23 - REDES DE TRANSPORTES E TERRITÓRIO REDES DE TRANSPORTES E
TERRITÓRIO ... 1398
Caminhos Que Unem E Caminhos Que Separam: A Polêmica Br-440 Em Juiz De Fora, Brasil ... 1399
La Experiencia De Las Agroredes Como Instrumento Para El Ordenamiento De Las Cadenas De Abastecimiento De Alimentos. Caso Localidad De Sumapaz -Bogotá ... 1412
Transporte E Território: Acessibilidade Em Área De Baixa Renda No Rio De Janeiro No Caso Das Favelas ... 1435
Dificuldades De Exportação Dos Vinhos De Altitude Do Município Catarinense De São Joaquim ... 1443
Distâncias E Acessibilidade No Interior Do Continente Português ... 1452
SESSÃO 24 - DESENVOLVIMENTO LOCAL E RURAL ... 1463
Inovação E Desempenho Empresarial: Diferenciações Territoriais E Sectoriais ... 1464
Impactos De Cultivares Resistentes A Doenças E Pragas No Desenvolvimento Sustentável De Regiões Cafeeiras ... 1477
Educação E Coesão Social – Que Diferença Faz O Ensino Superior? ... 1486
Cidades Sustentáveis E Educação: O Papel Da Escola Na Promoção Da Cultura De Paz E Justiça Social ... 1504
Que Desenvolvimento Adoptar Para A Sustentabilidade Da Região Demarcada Do Douro? 1511 SESSÃO BARTOLOMEU ... 1525
Estudo Da Adaptabilidade Da Quercus Suber L. No Nordeste Transmontano ... 1526
Space On Sports – How European Regional Competitiveness Influences Sports Performance ... 1549
A Cooperação Transfronteiriça Institucional Na Região Norte De Portugal – Sobreposição Ou Complementaridade? ... 1575
SESSÃO A - POLÍTICAS DE DESENVOLVIMENTO REGIONAL ... 1591
LA METODOLOGÍA INPUT OUTPUT COMO INSTRUMENTO DE ANÁLISIS DE LA POLÍTICA REGIONAL ... 1592
A Articulação De Cuidados De Saúde Primários E Hospitais E O Seu Impacto A Nível Regional. ... 1607
O Impacto Dos Incentivos Fiscais Regionais Na Taxa De Criação De Empresas: Estudo Aplicado Às Regiões Portuguesas Do Interior ... 1620
Europa Y El Marco De Desarrollo Regional De Las Rups ... 1635
SESSÃO B - POLÍTICAS DE DESENVOLVIMENTO REGIONAL ... 1650
¿Políticas Para El Desarrollo Regional? La Provincia De Salamanca En El Siglo Xxi ... 1651
La Promoción De La Atracción De Nuevos Pobladores A Través De Las Políticas De Desarrollo Rural: El Caso De Tierra De Campos Y Torozos ... 1664
Políticas De Promoción De Clusters Regionales De Biomedicina: El Caso De Medicon Valley ... 1680
O Contexto Socioeconómico E As Políticas Públicas De Desenvolvimento De Recursos Endógenos: O Caso Da Floresta Na Península Ibérica ... 1720
SESSÃO C - POLÍTICAS DE DESENVOLVIMENTO REGIONAL ... 1738
Aspectos Técnicos E Opções Políticas Do Processo De Participação Popular: Lições De Experiências No Sul Do Brasil ... 1739
A Contribuição Do Cooperativismo Na Implementação De Políticas Públicas. O Caso Do Programa Luz Para Todos – Médio Alto Uruguai No Rio Grande Do Sul - Brasil. ... 1752
Os Conselhos Regionais De Desenvolvimento Do Rio Grande Do Sul E O Processo De Participação Popular: A Trajetória De Uma Conquista ... 1767
SESSÃO D - POLÍTICAS DE DESENVOLVIMENTO REGIONAL ... 1776
Complexo Das Usinas Hidrelétricas Do Rio Madeira No Município De Porto Velho E O Novo Cenário Regional ... 1777
Políticas De Desenvolvimento Regional No Brasil ... 1792
ANALYSIS OF THE CAUSAL RELATION BETWEEN
CONSTRUCTION ACTIVITY AND THE GROSS DOMESTIC
PRODUCT OF TWO NEIGHBOURING ECONOMIES: PORTUGAL
AND SPAIN
Alcina Nunes1, Jorge Lopes1, Carlos Balsa1
1
Polytechnic Institute of Bragança, Bragança, Portugal
ABSTRACT
It has long been recognised that the role of the construction industry in a country’s national economy goes beyond its share in national output. Using time–series data drawn from the United Nations national accounts databases, this study applies the econometric Granger causality methodology to investigate the relationship between construction activity, measured by the construction value added, and the Gross Domestic Product (GDP) of two neighbouring economies – Portugal and Spain. In a comparison basis, the paper intends to identify the existence of a causal relation between the construction sector and each one of the aggregate economies. In particular, it tries to verify if the construction activity contributes to economic growth and/or economic growth contributes to the dynamics of the construction industry activity in these two countries. For both countries is find evidence that GDP growth leads the growth in the construction sector, in the short and medium-run. The opposite is not observed.
Keywords: Portugal, Spain, Construction sector, GDP, Unit root tests, Granger causality
1. INTRODUCTION
Research requires a systematic approach by the researcher, irrespective of what is investigated and the methods adopted. This is particularly true when the research is applied to a special subject as the one addressed in this research work [1]. Indeed, if “pure” research is undertaken to develop knowledge as a way to contribute to the body of existing theory, the applied research seeks to address issues of applications that help solve real everyday problems. Generally, in applied research, the different approaches focus on collection and analysis of data rather than assessment of theory and literature [2] even if the related literature drives the development of the methodology used in empirical applications.
0 2 4 6 8 10 12 14 16 C ons tr uc ti on/ G D P ( % ) Portugal Spain
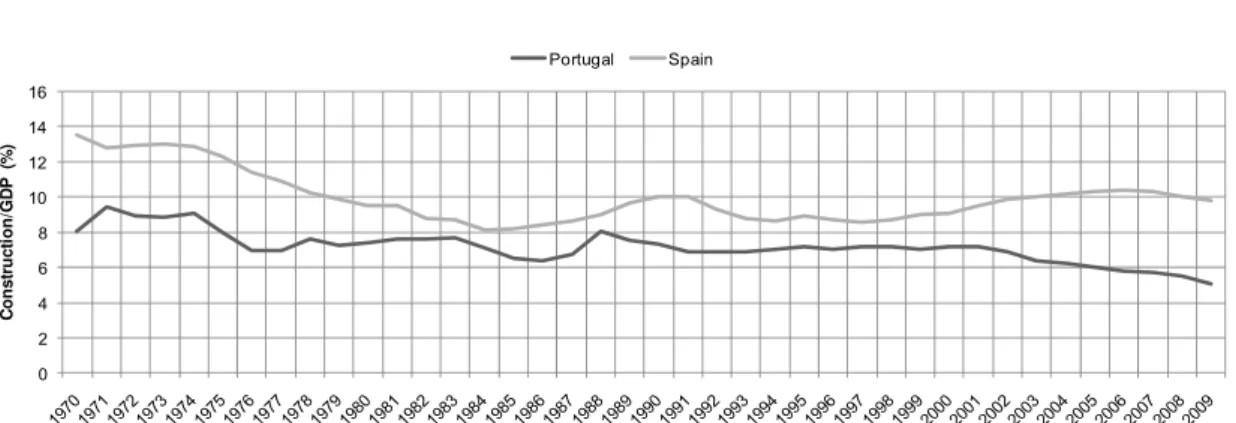
Figure 1: Share of Construction flows in the Portuguese and Spanish GDP (1970-2009)
0 2000 4000 6000 8000 10000 12000 14000 16000 0 50000 100000 150000 200000 250000 19 70 19 71 19 72 19 73 19 74 19 75 19 76 19 77 19 78 19 79 19 80 19 81 19 82 19 83 19 84 19 85 19 86 19 87 19 88 19 89 19 90 19 91 19 92 19 93 19 94 19 95 19 96 19 97 19 98 19 99 20 00 20 01 20 02 20 03 20 04 20 05 20 06 20 07 20 08 20 09 C o n s tr u c tio n ( m illio n U S D ) G D P ( m illio n U S D )
Portugal / GDP Portugal / Construction
0 20000 40000 60000 80000 100000 120000 140000 0 200000 400000 600000 800000 1000000 1200000 1400000
1970 1971 1972 1973 1974 1975 1976 1977 1978 1979 1980 1981 1982 1983 1984 1985 1986 1987 1988 1989 1990 1991 1992 1993 1994 1995 1996 1997 1998 1999 2000 2001 2002 2003 2004 2005 2006 2007 2008 2009
C o n s tr u c tio n ( m illio n U S D ) G D P ( m illio n U S D )
Spain / GDP Spain / Construction
Figure 2: Evolution of GDP and Construction flows in Portugal and Spain (1970-2009)
Figure 1 depicts the share of construction value added (CVA) in the Portuguese and Spanish GDP using internationally comparable data collected from the United Nations National Accounts- Main Aggregates Database from 1970 to 2009, covering a period of 40 years (values are presented in constant prices with 2005 as the base year). Figure 2 presents the evolution of construction value added (CVA) and GDP of Portugal and Spain for the same period, both measured at constant 2005 US dollars. It can be seen that these countries have distinct patterns as regards the relative clout of the construction industry, as measured as the share of CVA in GDP. The most distinguishing feature is that this indicator of this economic activity in Spain is higher than that of Portugal throughout the period analysed. Since the entry of these countries in the then European Community, in the mid-1980, the share of CVA in GDP in Spain presented an upward trend until 2006, of course with inter-temporal fluctuations, and reached a peak of 10.3%. From then on, the decline is evident in relative terms. In Portugal, the construction industry activity increased relatively in the period from 1986 to 1988 (about 8% of GDP), declined until the early 1990s and presented a slightly upward trend until 2001. In terms of construction volume, an upward trend is apparent for both countries until the early years of the last decade. From 2001 to 2009, the construction industry in Portugal decreased not only relatively but also absolutely. In Spain, the construction volume decreased in the last two years of the period.
in cost estimating and, consequently, budgeting. So, the development of more robust prediction models, using time series analysis, can help reduce uncertainty about future costs in an economic activity that is essential and a dominant part of economic development. Moreover, if it is a fact that is very difficult to estimate the degree of price variations in construction labour and material costs, due to the uniqueness of tasks and materials in each construction project, it is also a fact that these difficulties are stressed by the overall environmental changes and dynamic variations at a macroeconomic level [5].
At a more general level, public policy makers rely on a variety of techniques to estimate the possible costs and benefits of a public policy. If this is observed for the generality of public policies, it is particularly true for the ones that affect an important relative sector as the construction industry. The analysis of historical data to find trends is the base for forecasting future outcomes of a policy measure. Time series analysis is a popular technique for assessing trends and forecasting. This statistical quantitative method becomes also essential to compute causal relations between micro and macroeconomic economic variables as the causal relation between construction value added and the growth of national economy. The present paper is concerned essentially with the macroeconomic scenario faced by the construction industry in an economy where it seems that the construction sector is losing its relative economic importance but not its social and financial weight in the national business framework.
The paper is presented as follows. Next section shows how the research methodology applied to analyse the relationship between GDP and construction flows has evolved in the research literature. Then, the methodology of the Granger causality is presented. The results of the study are elaborated and discussed in the fourth section. Some concluding remarks finalise the analysis.
2. EVOLUTION OF THE RESEARCH METHODOLOGY APPLIED TO ANALYSE THE RELATIONSHIP BETWEEN GDP AND CONSTRUCTION FLOWS
The relationship between construction flows and the development of a country, measured throughout Gross Domestic Product (GDP) per capita, has received great attention in the specialized literature.
In particular, it is possible to mention several studies that analysed the above relationship in samples of countries covering all stages of economic development [6-12]. Lopes [13] provided an extensive review of the literature concerning the study the construction industry at the macroeconomic level, for both developed and developing economies. A brief summary of the research approach adopted to analyse the underlying relationship is provided in this section. Earlier studies on the role of the construction sector in the process of economic growth and development [6, 8], based mainly on cross sectional data, found a positive association between national income and several measures of the construction industry activity.An important feature of Wells’ 1986 work was the establishment of a mathematical model (through the ordinary least squares technique) relating different measures of construction activity- construction value added, gross construction output, and employment in construction- to the level of GDP per capita. Wells [8] main findings can be stated as follows: i) the construction output as a percentage of GDP is related to GDP per capita in an increasing form of income level; ii) and if the relationship between countries at different income levels at a fixed point in time also occurs within any country over time, then construction output increases relatively with increasing per capita GDP in any country over time. The changes of this ratio would be faster for countries in the middle- income range [8]. Further development on the analysis of the relationship between the measures of construction output and GDP made use of correlation techniques, using time-series data pertaining to developing countries [14-15].
Anaman and Osei-Amponsah [21] analysed the relationship between the construction industry and the macroeconomy in Ghana, based on time series data from 1968 to 2004, and found that the construction industry leads the economic growth in Ghana. Chen and Zhu [22] analysed provincial data on housing investment in three main regions of China, and found that there was a bi-directional Granger causality between GDP and housing investment for the whole country, while the impact of housing investment on GDP behaves differently in the three regions.
3. GRANGER CAUSALITY METHODOLOGY
The methodology chosen in this research work is justified by the nature of the object of study and intends to demonstrate how the development of quantitative applied research analysis is crucial to implement an effective research design in a short- and medium-run.
To analyse the causal relation between two variables, Granger [23] developed a test to check it. Granger causality examines to what extent a change from past values of a variable affects the subsequent changes of the other variable testing the direction of causality between two variables. Granger implemented the causality test by testing the null hypothesis that α2i =0 or
2i 0
β = in the following bi-variable (X and Y) regressions:
0 1 2
1 1
n n
t i t i i t i t
i i
Y α α Y− α X− ν
= =
= +
∑
+∑
+ (1)0 1 2
1 1
n n
t i t i i t i t
i i
X β β X− β Y− μ
= =
= +
∑
+∑
+ (2)Where μt and νt are uncorrelated and white noise residuals term series. Causality may be determined by testing the null hypothesis, H0:α21=α22 =K=α2n =0 and
0: 21 22 2n 0
H β =β =K=β = against the alternative hypothesis that not all the coefficients α2i and 2i
β are equal to zero in equations (1) and (2), respectively. The range of lagged variables will be chosen according to the specific empirical application. A synthesis of several selection criteria could be used to compute de optimal lag length for the Granger causality equations. These methods comprise the akaike information criteria (AIC), the Schwartz Bayesian information criteria (SBIC), the Hannan-Quinn information criteria (HQIC), the final prediction error (FPE) and a sequence of likelihood ratio tests (LR). The optimal lag length is selected based on the lowest values of AIC, SBIC, HQIC criteria and rejection of the null hypothesis of lag K is equal to zero in LR test. The optimal lag length selection should also consider the Lϋtkepohl’s [24] demonstration that choosing the lag K to minimize the SBIC or the HQIC provides consistent estimates of the true lag order, K. In contrast, minimizing the AIC or the FPE criteria will overestimate the true lag order.
It is worth noting that the term Granger-causality, as Wong et al. [20] put it, is not a true causality concept but a statistical tool which in principle concerns only the predictability between time-series variables.
The implementation of the Granger causality test demands a previous empirical step, however. The presence of a trend in a time series could lead to false conclusions relating the relationship between two variables. In a stochastic process, stationarity means that the statistical characteristics of the process do not change in time. As Granger and Newbold [25] point out, Granger causality on non-stationarity time data might lead to spurious causal relation. The identification of a real causal relation implies the use of stationary time series data. In practice, formal tests for unit root are applied to test the stationarity of the series. The most commonly used unit root test is the Augmented Dickey-Fuller test (ADF) a more complete version of the Dickey-Fuller test [26]. The test is based on the following mathematical formulation:
0 1 2 1 1 n
t t i t i t
i
Y α αT α Y− γ Y− μ =
Δ = + + +
∑
Δ +Where ΔYt =Yt −Yt−1, α0 is a drift term and T is the time trend with the null hypothesis, 0: 2 0
H α = and its alternative hypothesis H1:α2 ≠0, n is the number of lags demanded to obtain white noise and μt is the error term.
Other test normally applied to examine the existence of unit roots in a data series is the Philips-Perron test [27] that is similar to the Dickey–Fuller statistics. The difference consists in the way the residuals’ covariance matrix is estimated. Phillips-Perron test uses the Newey–West [28] heteroskedasticity and autocorrelation consistent covariance matrix estimator.
4. EMPIRICAL APPLICATION AND RESULTS
In this research paper the Granger methodology, presented in the previous section, will be applied to Portugal. This empirical application tries to assess the existence of an economic relationship between the construction flows in Portugal’s and Spain’s GDP for the short and medium-run using a 40 years (from 1970 until 2009) data set. The longitudinal analysis proposed relies on annual time series data collected in the main national statistics database gathered by the United Nations. The values for each variable are measured in US dollars at constant 2005 prices guarantying its international comparability. Both GDP and construction flows are measured in real values eliminating the bias produced by changes in prices.
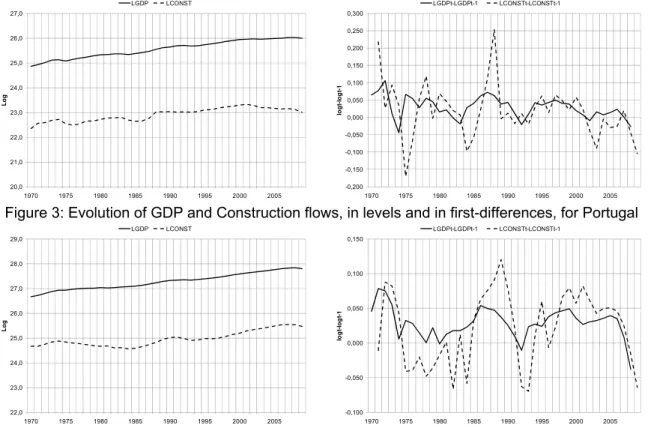
The indicators of economic activity which are analyzed in this chapter are: GDP and construction value added (CVA). Unfortunately, data on gross fixed capital formation in construction (GFCFC) are not provided in the UN publication. For this reason, CVA is used as a proxy for analyzing the pattern of evolution of construction investment. It is compared with GDP as both are measures of value added. For a simpler reading of the time series, its values are expressed in natural logarithms. The natural logarithm allows the direct consideration of the elasticity of the relevant variables. Figures 3 and 4 present the annual evolution of the two variables considering their values in logarithms.
20,0 21,0 22,0 23,0 24,0 25,0 26,0 27,0
1970 1975 1980 1985 1990 1995 2000 2005
Log LGDP LCONST -0,200 -0,150 -0,100 -0,050 0,000 0,050 0,100 0,150 0,200 0,250 0,300
1970 1975 1980 1985 1990 1995 2000 2005
lo g t-lo g t-1 LGDPt-LGDPt-1 LCONSTt-LCONSTt-1
Figure 3: Evolution of GDP and Construction flows, in levels and in first-differences, for Portugal
22,0 23,0 24,0 25,0 26,0 27,0 28,0 29,0
1970 1975 1980 1985 1990 1995 2000 2005
Log LGDP LCONST -0,100 -0,050 0,000 0,050 0,100 0,150
1970 1975 1980 1985 1990 1995 2000 2005
lo g t-lo g t-1 LGDPt-LGDPt-1 LCONSTt-LCONSTt-1
Figure 4: Evolution of GDP and Construction flows, in levels and in first-differences, for Spain
LCONST=LCONSTt-LCONSTt-1) which, in this context, can be interpreted as the variables’ growth rates. Figure 4 represents the same variables for Spain.
When observing the GDP and the Construction flows in levels it seems clear that a trend exists in both time series, for both countries. It also appears that the evolution of the series is highly correlated. This can also be observed when analyzing the summary statistics for both variables during the 1970-2009 period (Table 1). As the variables are measured in constant prices, the correlation matrix clearly demonstrates that the construction sector and GDP are strongly correlated in these countries during the period 1970-2008.
Table 1: Summary statistics for the variables in levels
LGDP LCONST ∆LGDP ∆LCONST LGDP LCONST ∆LGDP ∆LCONST
Number of Observations 40 40 39 39 40 40 39 39
Mean 25,557 22,911 0,029 0,017 27,283 24,967 0,029 0,021
Median 25,626 23,010 0,028 0,019 27,298 24,637 0,034 0,025
Standard Deviation 0,350 0,268 0,031 0,079 0,332 0,305 0,022 0,053
Maximum 26,015 23,325 0,106 0,254 27,836 25,553 0,078 0,120
Minimum 24,862 22,347 -0,044 -0,171 26,671 24,560 -0,038 -0,070
Skewness -0,260 -0,227 -0,052 0,621 0,103 0,622 -0,401 -0,210
Kurtosis 1,823 1,801 2,989 4,824 1,925 2,158 4,292 1,886
Summary Statistics Portgal Spain
Table 2: Correlation matrix for the variables in levels and in first-differences
Countries
Variables in levels LGDP LCONST LGDP LCONST
LGDP 1 0.944** 1 0.909**
LCONST 0.944** 1 0.909** 1
Variables in first-differences ∆LGDP ∆LCONST ∆LGDP ∆LCONST
∆LGDP 1 0.6632** 1 0.763**
∆LCONST 0.6632** 1 0.763** 1
Note: ** Denote 5% level of significance for Pearson correlation
Portugal Spain
The same conclusion cannot be withdrawn so easily when observing the evolution of the first differences of the variables. The growth rates of both variables are not so strongly correlated. From Table 2 it is possible to observe that the coefficient of correlation decreased from 95%, for the variables in levels, to almost 64%, for the variables presented in first differences. In Spain, we observed the same evolution. However the decrease is less pronounced.
As mentioned above, the presence of a trend in a time series could lead to false conclusions relating the relationship between two variables, that is, to a spurious relation [25]. For example, the previous results could lead us to conclude that there is a statistically significant relationship between a country’s GDP and construction flows when, in fact, only a contemporaneous correlation between the variables exists. Declaring a meaningful causal relation is to jump at conclusions. For observing a real causal relation and to avoid a problem of spurious regression it is necessary to use stationary time series data. In practice, the formal unit root Augmented Dickey-Fuller and Phillips-Perron test is applied to test the stationarity of the here present data series. Table 3 and 4 present the results of the ADF and PP unit root tests for each time series, for Portugal and Spain.
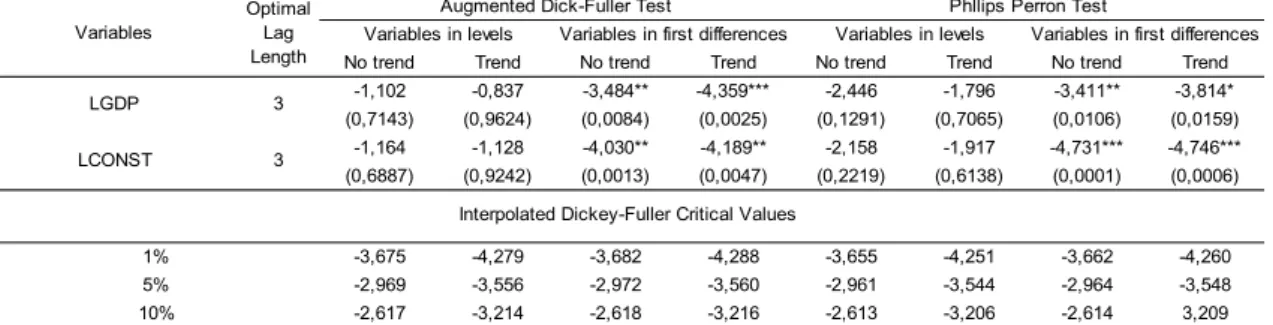
Table 3: Augmented Dickey-Fuller (ADF) and Phillips-Perron (PP) unit root tests for Portugal
No trend Trend No trend Trend No trend Trend No trend Trend
-1,102 -0,837 -3,484** -4,359*** -2,446 -1,796 -3,411** -3,814* (0,7143) (0,9624) (0,0084) (0,0025) (0,1291) (0,7065) (0,0106) (0,0159) -1,164 -1,128 -4,030** -4,189** -2,158 -1,917 -4,731*** -4,746*** (0,6887) (0,9242) (0,0013) (0,0047) (0,2219) (0,6138) (0,0001) (0,0006)
-3,675 -4,279 -3,682 -4,288 -3,655 -4,251 -3,662 -4,260
-2,969 -3,556 -2,972 -3,560 -2,961 -3,544 -2,964 -3,548
-2,617 -3,214 -2,618 -3,216 -2,613 -3,206 -2,614 3,209
5% 10%
Note: *, ** and *** denote the rejection of the unit root at 10%, 5% and 1% significance level, respectively. Between brackets is presented the McKinnon approximate p-value for the test statistic.
LGDP 3
LCONST 3
Interpolated Dickey-Fuller Critical Values 1%
Variables
Optimal Lag Length
Augmented Dick-Fuller Test Phllips Perron Test
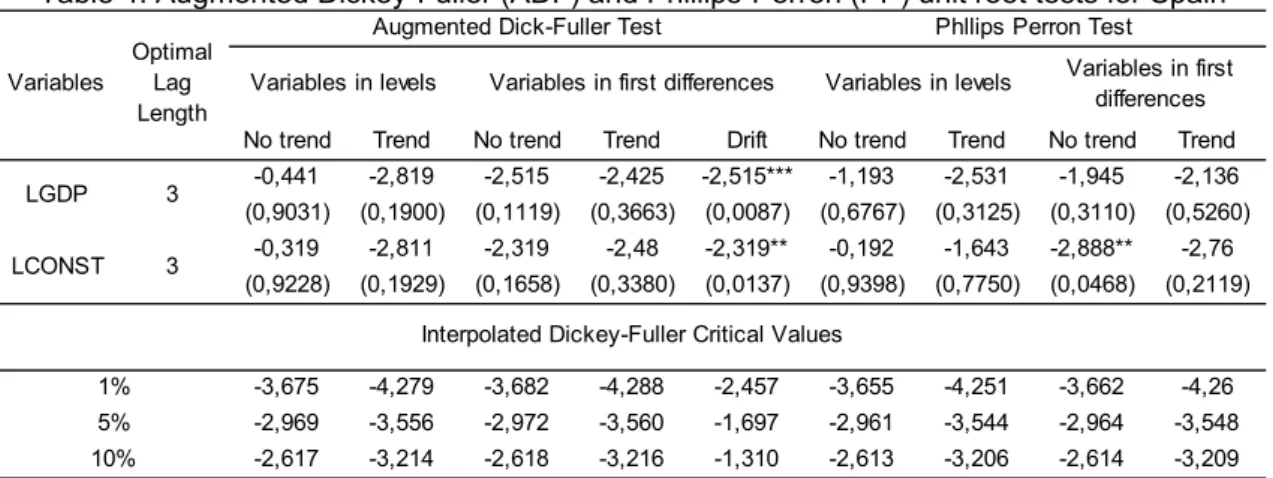
Table 4: Augmented Dickey-Fuller (ADF) and Phillips-Perron (PP) unit root tests for Spain
No trend Trend No trend Trend Drift No trend Trend No trend Trend -0,441 -2,819 -2,515 -2,425 -2,515*** -1,193 -2,531 -1,945 -2,136 (0,9031) (0,1900) (0,1119) (0,3663) (0,0087) (0,6767) (0,3125) (0,3110) (0,5260)
-0,319 -2,811 -2,319 -2,48 -2,319** -0,192 -1,643 -2,888** -2,76 (0,9228) (0,1929) (0,1658) (0,3380) (0,0137) (0,9398) (0,7750) (0,0468) (0,2119)
-3,675 -4,279 -3,682 -4,288 -2,457 -3,655 -4,251 -3,662 -4,26
-2,969 -3,556 -2,972 -3,560 -1,697 -2,961 -3,544 -2,964 -3,548
-2,617 -3,214 -2,618 -3,216 -1,310 -2,613 -3,206 -2,614 -3,209
1% 5% 10%
Note: ** and *** denote the rejection of the unit root at 5% and 1% significance level, respectively. Between brackets is presented the McKinnon approximate p-value for the test statistic.
Variables in first differences
LGDP 3
LCONST 3
Interpolated Dickey-Fuller Critical Values Variables
Optimal Lag Length
Augmented Dick-Fuller Test Phllips Perron Test
Variables in levels Variables in levels Variables in first
differences
The results, in both countries, are presented for the variables in levels and in first differences considering an optimal lag length of 3. Both definitions of variables are computed considering two different assumptions – data series with the presence of a trend, since Figure 3 and 4 point to the existence of a trend, and without the trend. For Spain, it was tested the assumption of the existence of a trend with drift.
Remember that the null hypothesis is the presence of unit root. Thus, when the augmented Dickey-Fuller and Phillips-Perron statistic lies inside the acceptance region at 1%, 5%, and 10% (considering Dickey-Fuller critical values and McKinnon [29] approximate p-value), one cannot reject the presence of unit root at the respective significance level. In this particular case, the ADF test indicates that both series are not stationary in their level form (with and without trend) since the null hypothesis cannot be rejected at none of the critical values. In opposition, the ADF test indicates that both GDP and Construction series are stationary in first differences (with and without trend), since the unit root test was rejected at, at least, the 5% critical value. The PP statistical test confirms the ADF conclusions. Both series are integrated of order one – I(1). This means that it is now possible to study the dynamic relationship between GDP and construction flows in those countries using first differences data series. Or, in other words, it is possible to analyse the dynamic relationship between the variables’ growth rates. Since we have the first differences of logarithm values, the first differences of the variables can be interpreted as the growth rates of the variables.
To test if any feedback effects exist between the two variables’ growth rates, the Granger causality test is applied. In practice, the basic assumption of the Granger causality tests is that future values cannot predict past or present values. In fact, the opposite holds. If past values of the construction sector growth rate do contribute significantly to the explanation of GDP growth rate, then the construction sector is said to Granger-cause GDP. This also means that the construction sector is Granger-causing GDP when past values of construction sector have predictive power concerning the current value of GDP even if the past values of GDP are taken into consideration. Conversely, if GDP is Granger-causing construction sector, it would be expected that GDP change would take place before a change in the construction sector.
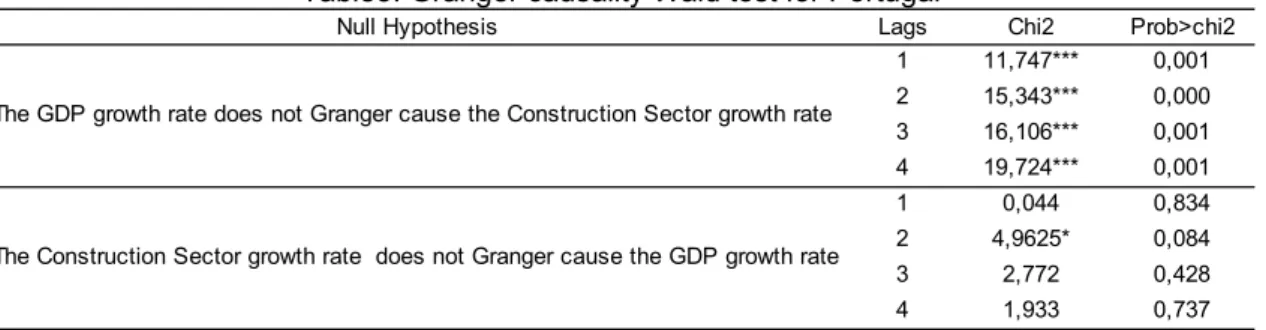
Table5: Granger causality Wald test for Portugal
Null Hypothesis Lags Chi2 Prob>chi2
1 11,747*** 0,001
2 15,343*** 0,000
3 16,106*** 0,001
4 19,724*** 0,001
1 0,044 0,834
2 4,9625* 0,084
3 2,772 0,428
4 1,933 0,737
The GDP growth rate does not Granger cause the Construction Sector growth rate
The Construction Sector growth rate does not Granger cause the GDP growth rate
Note: * and *** denote the rejection of the null hypothesis at 10% and 1% significance level, respectively
The results of causality relating the construction sector and GDP growth rates in Spain are presented in Table 6. The Granger causality test shows that GDP growth leads the growth in the construction sector with a 1-year to 4-year lag. However, the results seem to be less robust than those found for Portugal. Regarding the inverse relationship, it is possible to conclude that the growth rate of the construction sector does not affect the growth rate of the Spanish income.
Table 6: Granger causality Wald test for Spain
Null Hypothesis Lags Chi2 Prob>chi2
1 3,0867* 0,079
2 11,118*** 0,004
3 10,964** 0,012
4 21,112*** 0,000
1 0,151 0,697
2 3,286 0,193
3 4,219 0,239
4 4,7984 0,309
The GDP growth rate does not Granger cause the Construction Sector growth rate
The Construction Sector growth rate does not Granger cause the GDP growth rate
Note: *, ** and *** denote the rejection of the null hypothesis at 10%, 5% and 1% significance level, respectively
In sum, it can be concluded that there is, in the short and medium-run, a uni-directional relationship between the GDP growth rate and the construction sector growth rate in both economies. On the other hand, the results do not show any significant effect of the construction growth on the GDP growth, at least in the short and medium- run. The same conclusion has also been found for other economies [18-19]. However, other writers concluded that the direction of the causality is from the construction sector to GDP [8, 21].
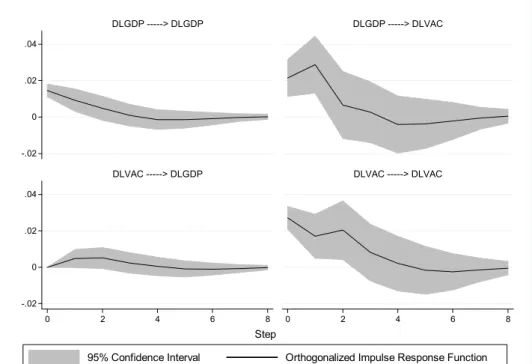
-.04 -.02 0 .04 .06
.02
-.04 -.02 0 .02 .04 .06
0 2 4 6 8 0 2 4 6 8
DLGDP ---> DLGDP DLGDP ---> DLVAC
DLVAC ---> DLGDP DLVAC ---> DLVAC
95% Confidence Interval Orthogonalized Impulse Response Function
Step
Figure 5: Orthogonalized impulse response functions between Construction and GDP growth rates and themselves, for Portugal
-.02 0 .02 .04
-.02 0 .02 .04
0 2 4 6 8 0 2 4 6 8
DLGDP ---> DLGDP DLGDP ---> DLVAC
DLVAC ---> DLGDP DLVAC ---> DLVAC
95% Confidence Interval Orthogonalized Impulse Response Function
Step
Figure 6: Orthogonalized impulse response functions between Construction and GDP growth rates and themselves, for Spain.
The impulse response function (IRF) analysis, sometimes called multiplier analysis, measures the effect of a shock on a variable on itself or on another variable [24, 30], thus strengthening the Granger causality analysis. If there is a reaction of one variable to an impulse in another variable, it is possible to consider the latter as causal of the former.
Figure 6 shows that one unit increase in Spain’s GDP growth rate influences the growth rate in the construction output up to a four year period. It also shows that a one percent positive shock in GDP causes an immediate increase of 2% in construction flows. Likewise in the case of Portugal, the opposite does not happen too.
5. FINAL REMARKS
This paper has carried out an empirical investigation on the relationship between the construction output and the national economy in two neighbouring countries: Portugal and Spain. Following previous works, this study has applied an econometric analysis within Granger’s 1969 framework to test the causality link between construction output and GDP. The results have shown that, for both Portugal and Spain, there is, in the short and medium-run, a uni-directional relationship between GDP and construction output. This direction of casualty is more pronounced in the former than in the latter country. On the other hand, the results do not show any significant effect of the construction growth on GDP growth, at least in the short and medium run. The analyses have also suggested that the construction industry in those countries has reached the maturity stage. The case of Spain is particularly striking for it has one of the largest construction industries in the European Union, and most recent data point to a significant decrease in all measures of the construction industry activity. Indeed, the relative decrease of the construction sector, in a long-term perspective, is the development pattern that characterizes the most developed countries of the world. Much of the recent literature emphasises the fact that, in the advanced industrial countries, there is a shift away from the new-built segment to the repair and management of the building stock. This aspect has certainly an effect on the organizational structure of the construction enterprises. The main results of this paper might have implications for public policy since they show that this kind of research methodology can be useful not only in a macroeconomic context but also in a microeconomic level. With anticipated knowledge of macroeconomic trends, firms can adjust their market strategy according to the macroeconomic forecasting.
BIBLIOGRAPHY
1. Nunes, A., Lopes, J. and Balsa, C., Is there a causal relation between construction activity and the Portuguese economy? An econometric empirical application, Book of Proceedings of the 10th European Conference on Research Methodologies for Business and Management Studies, Caen: France (2011).
2. Fellows, R. and Liu, A., Research Methods for Construction, Wiley-Blackwell, (2008).
3. Stawińska, A., The EU-27 construction sector: from boom to gloom, Eurostat: Statistics in Focus, 7/2010, (2010).
4. Ashuri, B. and Lu, J., It is Possible to Forecast the Construction Cost Index in the USA”, Findings in Built and Rural Environments. Fibre Series, RICS, (2010).
5. Wang, C. H. and Mei, Y. H., Model for Forecasting Construction Cost Indices in Taiwan. Construction Management and Economics, Volume 16, nº 2, 147-157, (1998).
6. Turin, D.A., The Construction Industry: Its Economic Significance and its role in Development, UCERG, London, (1973).
7. World Bank, The Construction Industry: Issues and Strategies in Developing Countries, The World Bank, Washington D.C., (1984).
8. Wells, J., The Construction Industry in Developing Countries: Alternative Strategies for Development, Croom Helm, London, (1986).
9. Bon, R., The World Building Market 1970-85, Proceedings of the CIB W65 Symposium: Building Economics and Construction Management, Sydney, (1990).
10. Bon, R., The Future of International Construction: Secular Patterns of Growth and Decline. Habitat International. Volume 16, nº 3, 119–128, (1992).
11. Ruddock L. and Lopes J., The Construction Sector And Economic Development: The ‘Bon Curve’. Construction Management and Economics, nº 24, 717–723, (2006).
12. Lopes, J., Nunes, A. and Balsa, C., The Long-Run Relationship between the Construction Sector and the National Economy in Cape Verde. International Journal of Strategic Property Management, Volume 15, nº 1, 48-59, (2011).
14. Han, S.S. and Ofori, G., Construction Industry in China’s Regional Economy, 1990-1998. Construction Management and Economics, Volume 19, 189-205, (2001).
15. Lopes, J., Ruddock, L. and Ribeiro, L., Investment in Construction and Economic Growth in Developing Countries. Building Research & Information, Volume 30, nº 3, 152–159, (2002). 16. Green, R. K., Follow the Leader: How Changes in Residential and Non-Residential Investment Predict Changes in GDP. Real Estate Economics, Volume 25, nº 2, 253-270, (1997).
17. Lean, S. C., Empirical Tests to Discern Linkages Between Construction and Other Economic Sectores in Singapore. Construction Management and Economics, Volume 13, 253-262, (2001).
18. Tse, R. Y. C. and Ganesan, S., Causal Relationship between Construction Flows and GDP: Evidence from Hong Kong. Construction Management and Economics, Volume 15, 371-376, (1997).
19. Yiu, C. Y., Lu, X. H., Leung, M. Y. and Jin, W. X., A Longitudinal Analysis on the Relationship between Construction output and GDP in Hong Kong. Construction Management and Economics, Volume 22, nº 4, 339-345, (2004).
20. Wong, J., Chiang, Y. and NG, S. T., Construction and Economic Development: the Case of Hong Kong. Construction Management and Economics, Volume 26, 815-826, (2008).
21. Anaman, K. and Osei-Amponsah, C., Analysis of the Causality Links between the Growth of the Construction Industry and the Growth of the Macro-economy in Ghana. Construction Management and Economics, Volume. 25, nº 9, 951-961, (2007).
22. Chen, J. and Zhu, A., The Relationship between Housing Investment and Economic Growth in China: A Panel Analysis Using Quarterly Provincial Data, Working Paper 2008:17, Department of Economics, Uppsala University, (2008).
23. Granger, C. W. J., Investigating Causal Relations by Econometric Methods and Cross-Spectral Methods. Econometrica, Volume 34, 541-551, (1969).
24. Lϋtkepohl, H., New Introduction to Multiple Time Series Analysis, Springer, (2005).
25. Granger, C. W. J and Newbold, P., Spurious Regressions in Econometrics. Journal of Econometrics, Volume 2, 111-120, (1974).
26. Dickey, D. A. and Fuller, W. A., Distribution of the Estimators for Autoregressive Time Series With a Unit Root. Journal of the American Statistical Association, Volume 74, 427-431, (1979). 27. Phillips, P. C. B., and P. Perron, Testing for a unit root in time series regression, Biometrika, Volume 75, 335–346, (1988).
28. Newey, W. K. and West. K. D., A Simple, Positive semi-definite, Heteroskedasticity and Autocorrelation Consistent Covariance Matrix. Econometrica, Volume 55, 703–708, (1987). 29. MacKinnon, J., Critical Values for Cointegration Tests, Long-run Economic Relationships: Readings in Cointegration, Engle, R.F. and Granger, C.W.J. (Eds.), Oxford University Press: New York, 267-276, (1991)