On: 01 Oct ober 2014, At : 05: 29 Publisher : Taylor & Francis
I nfor m a Lt d Regist er ed in England and Wales Regist er ed Num ber : 1072954 Regist er ed office: Mor t im er House, 37- 41 Mor t im er St r eet , London W1T 3JH, UK
Hydrological Sciences Journal
Publ icat ion det ail s, incl uding inst ruct ions f or aut hors and subscript ion inf ormat ion: ht t p: / / www. t andf onl ine. com/ l oi/ t hsj 20
Sediment redistribution due to a dense reservoir
network in a large semi-arid Brazilian basin
Iran Eduardo Lima Net o a , Mário Cesar Wiegand a & José Carl os de Araúj o a a
Depart ment of Agricul t ural Engineering. , Federal Universit y of Ceará , Campus do Pici, Bl oco 804, CEP 60. 470-971, Fort al eza, Ceará, Brazil
Publ ished onl ine: 28 Mar 2011.
To cite this article: Iran Eduardo Lima Net o , Mário Cesar Wiegand & José Carl os de Araúj o (2011) Sediment redist ribut ion due t o a dense reservoir net work in a l arge semi-arid Brazil ian basin, Hydrol ogical Sciences Journal , 56: 2, 319-333, DOI: 10. 1080/ 02626667. 2011. 553616
To link to this article: ht t p: / / dx. doi. org/ 10. 1080/ 02626667. 2011. 553616
PLEASE SCROLL DOWN FOR ARTI CLE
Taylor & Francis m akes ever y effor t t o ensur e t he accuracy of all t he infor m at ion ( t he “ Cont ent ” ) cont ained in t he publicat ions on our plat for m . How ever, Taylor & Francis, our agent s, and our licensor s m ake no
r epr esent at ions or war rant ies w hat soever as t o t he accuracy, com plet eness, or suit abilit y for any pur pose of t he Cont ent . Any opinions and view s expr essed in t his publicat ion ar e t he opinions and view s of t he aut hor s, and ar e not t he view s of or endor sed by Taylor & Francis. The accuracy of t he Cont ent should not be r elied upon and should be independent ly ver ified w it h pr im ar y sour ces of infor m at ion. Taylor and Francis shall not be liable for any losses, act ions, claim s, pr oceedings, dem ands, cost s, expenses, dam ages, and ot her liabilit ies w hat soever or how soever caused ar ising dir ect ly or indir ect ly in connect ion w it h, in r elat ion t o or ar ising out of t he use of t he Cont ent .
This ar t icle m ay be used for r esear ch, t eaching, and pr ivat e st udy pur poses. Any subst ant ial or syst em at ic r epr oduct ion, r edist r ibut ion, r eselling, loan, sub- licensing, syst em at ic supply, or dist r ibut ion in any
Sediment redistribution due to a dense reservoir network in a large
semi-arid Brazilian basin
Iran Eduardo Lima Neto, Mário Cesar Wiegand & José Carlos de Araújo
Department of Agricultural Engineering. Federal University of Ceará, Campus do Pici, Bloco 804, CEP 60.470-971, Fortaleza, Ceará, Brazil
Received 8 April 2010; accepted 15 November 2010; open for discussion until 1 September 2011
CitationLima Neto, I. E., Wiegand, M. C. & de Araújo, J. C. (2011) Sediment redistribution due to a dense reservoir network in a
large semi-arid Brazilian basin.Hydrol. Sci. J.56(2), 319–333.
Abstract This paper investigates for a 25-year period the sediment distribution in a semi-arid Brazilian basin (2×10⁴km2) with a network containing more than 4000 surface reservoirs. The methodology is based on rating
curves and fitted parameters derived from field data. The results showed that suspended load corresponded to 70% of the total sediment yield (148 t km-2year-1). The relatively low contribution of the suspended load (compared
with other semi-arid regions) was attributed to the impact of the numerous upstream reservoirs, which retained 235 t km-2 year-1. The micro (<1 hm3), small (1–10 hm3), medium-sized (10–50 hm3), and large or strategic
(>50 hm3) reservoirs responded to, respectively, 5, 17, 30 and 48% of the total sediment retention by the reservoir
network. This indicates that retention in the non-strategic reservoirs has a positive impact on water availability, since siltation of the strategic reservoirs would be expected to more than double if only such reservoirs existed.
Key wordsreservoir network; siltation; sediment yield; semi-arid watershed; Brazil
Redistribution des sédiments due à un réseau dense de réservoirs dans un grand bassin versant semi-aride du Brésil
RésuméCet article étudie sur une période de 25 ans la distribution des sédiments dans un bassin versant semi-aride du Brésil (2 104km2) qui est équipé d’un réseau de plus de 4000 réservoirs de surface. La méthodologie est basée
sur les courbes de tarage et les paramètres ajustés provenant des données du terrain. Les résultats montrent que la charge en suspension correspond à 70% de la production totale de sédiments (148 t km-2an-1). La contribution
relativement faible de la charge en suspension (par rapport aux autres régions semi-arides) est attribuée à l’impact des nombreux réservoirs en amont, qui retiennent 235 t km-2 an-1. Les réservoirs très petits (<1 hm3), petits
(1−10 hm3), moyens (10
−50 hm3), et grands ou stratégiques (>50 hm3) représentent, respectivement, 5, 17,
30 et 48% de la rétention totale de sédiments par le réseau de réservoirs. Cela indique que la rétention dans les réservoirs non-stratégiques a un impact positif sur la disponibilité de l’eau, puisque la sedimentation dans ces réservoirs stratégiques pourrait plus que doubler si eux seuls existaient.
Mots clefsréseau de réservoirs; sédimentation; production de sédiments; bassin versant semi-aride; Brésil
INTRODUCTION
The global trend of water demand has contributed to a massive increase in the number of small and medium-sized surface reservoirs in dryland areas since the last century (Pisaniello et al., 2006; Callow & Smettem, 2009; Malveira et al., 2011). These reservoirs now face siltation, which results in sediment redistribu-tion in river basins and strongly influences water availability. Such problems are already taking place,
for example, in the highly populated Brazilian semi-arid region, where thousands of on-river reservoirs have been constructed in order to store water in the rainy periods to compensate the deficits during the dry season, and minimize conflicts among water uses and users (de Araújo et al., 2006). This policy pro-duced a High-density Reservoir Network (HdRN) in the region, a complex system to be managed. As an example, Fig. 1 shows the spatial distribution of more than 4000 dams in the Upper Jaguaribe Basin—UJB
ISSN 0262-6667 print/ISSN 2150-3435 online © 2011 IAHS Press
doi: 10.1080/02626667.2011.553616 http://www.informaworld.com
Fig. 1 Upper Jaguaribe Basin—UJB (24 600 km2) in the State of Ceará, Brazil, indicating the spatial distribution of almost
4100 reservoirs of different capacities; the Jaguaribe River; the control section; and the largest reservoirs of the basin (Orós and Trussu). The catchment area of the control section (20 700 km2) is shown within the UJB and contains approximately
3200 reservoirs.
(24 600 km2), in the Federal State of Ceará, Brazil. Since water uses and water conflicts are expected to increase globally, the problem of a HdRN may also occur in current non-drylands in the next decades. Therefore, it is of utmost importance to be able to assess reservoir siltation rates in HdRN basins, and their impact on the total sediment yield at the basin scale. This knowledge will help both to estimate the lifetime of reservoirs and to take proper measures against reservoir sedimentation and water scarcity. The investigated problem is also relevant in terms of geomorphology, considering that the existence of numerous reservoirs should change the natural pat-terns of sediment deposition.
The sediment yield at the basin scale has been defined as the amount of sediment transported beyond, or delivered to, a specific point in the catch-ment area per unit time (Morriset al., 2008). Several investigations have presented empirical approaches relating sediment yield to catchment area, combined, or not, with other factors, such as basin shape, topography, runoff, lithology and vegetation cover (Walling, 1983; Church & Slaymaker, 1989; Verstraetenet al., 2003; de Venteet al., 2005; Minear & Kondolf, 2009). Others have presented distributed or semi-distributed hydro-sedimentological models such as WEPP (Flanaganet al., 1995; Ramsankaram
et al., 2009), EUROSEM (Morgan et al., 1998;
Mati et al., 2006), SWAT (Chen & Mackay, 2004; Rostamian et al., 2008), HIDROSED (de Araújo & Knight, 2005; de Araújo, 2007), WATEM/SEDEM (Verstraeten et al., 2007; de Vente et al., 2008) and SEDNET (Prosser et al., 2001; Wilkinson et al., 2009), for the assessment of soil erosion and sed-iment yield at the basin scale. However, none of the above-mentioned empirical approaches and hydro-sedimentological models deals with the HdRN problem, as in the case of large basins of the Brazilian semi-arid region. In order to overcome this issue, Güntner & Bronstert (2004) developed the WASA—Model of Water Availability in Semi-arid Environments, one of the few hydrological models which is able to simulate such HdRN systems by dealing statistically with micro-, small and medium-sized dams. This model has been extended recently to a version called WASA-SED (Mamede, 2008; Franckeet al., 2008a) in order to include soil erosion and sediment dynamics modules. The WASA-SED has been applied to estimate the sediment distribution in two preserved, nested, semi-arid basins in Brazil with catchment areas of 12 and 933 km2 (Medeiros
et al., 2010), respectively. However, the simulation and validation of that model for larger basins with a HdRN is a challenge that still needs to be tackled.
In this study, we present an alternative approach, based mainly on field data, to estimate the sediment yield and reservoir retention in relatively large basins with a HdRN. The case study is a watershed within the Upper Jaguaribe basin, a semi-arid catchment area of 20 700 km2 (see Fig. 1). The temporal delimita-tion of the research is the 25-year period from 1984 to 2008. The reason for selecting this period is that, since the early 1980s, no major land-use change has been observed in the basin. The specific aims of this study are: (1) to generate a runoff time series using field data and hydrological modelling; (2) to generate a suspended sediment load time series using a rat-ing curve obtained from field data; (3) to generate a bed load time series using a simple hydraulic model calibrated with field data; (4) to estimate the time vari-ation of sediment deposition for different reservoir classes using field data and a relationship based on rainfall erosivity; and (5) to assess the total sediment production (reservoir retention plus sediment yield) at the basin scale. This study provides new data and a novel methodology that can be applied to predict the impact of numerous reservoirs on the sediment distribution in large basins.
STUDY AREA
General information
This study was conducted in a focus area of 20 700 km2, corresponding to 84% of the total area of the UJB (see Fig. 1), located in the Federal State of Ceará, Brazil. The UJB population is approximately 500 000 inhabitants, living in 24 municipalities, whose economy is mainly cattle breeding and agricul-ture. One of the main constraints for the economic and social development of the area is the low water yield reliability, mainly due to recurrent droughts (whose probability of occurrence is close to 10%), a problem traditionally dealt with by the construction of local dams. The predominant vegetation type isCaatinga, a deciduous forest composed of a mixture of cacti, shrubs and trees not higher than 10 m. Frequently, the natural vegetation has been replaced by tradi-tional agriculture (with predominance of maize and beans) and livestock farming. Intensive agricultural practices in the area have caused soil losses, as well as negative impacts on water quality (Aguiar et al., 2006; Aquinoet al., 2008), which leads to less avail-able water. Further information on the region can be found elsewhere (Aragão Araújo, 1990; Gaiseret al., 2003).
Hydrology
The study area shown in Fig. 1 is within the drought polygon (Aragão Araújo, 1990), a tropical semi-arid region characterized by a strongly negative atmo-spheric water balance, comprised of: precipitation 700 mm year-1and potential evaporation above 2300 mm year-1, with interception losses three times higher than runoff (Medeiros et al., 2009); limited ground-water resources (fissured aquifers prevail); shallow soils on top of the crystalline basement; and recurrent droughts, leading to a highly vulnerable natural water resources system. According to Gaiser et al. (2003), rainfall in the study area is basically limited to a 4-month period (February–May), and about 70% of the total annual rainfall occurs within the rainy season.
River regime
The Jaguaribe River is the largest in the State of Ceará. Its catchment area is 74 000 km2,
correspond-ing to 50% of the State area. The peak flows in the river usually occur between March and April. At the UJB (Fig. 1), the river is intermittent, running dry for at least six months every year. Within the study area, the length of this river is about 300 km and its aver-age slope is 0.60 m km-1. At the control section, the total channel width between the outer banks is 180 m, while the regular water level rises up to 12 m. The highest flood stage at this section in the studied period (1984–2008) corresponded to a discharge of about 8000 m3 s-1. Bed material in the main channel is pri-marily fine to coarse sand. The reason for choosing the control section shown in Fig. 1 was the availability of consistently measured water discharge since 1912. Despite the long-term monitoring of water discharge, sediment fluxes had only been assessed from iso-lated measurement campaigns conducted during the past decade, which shows the lack of information on sediment transport (and reservoir silting) in the UJB.
Surface reservoirs
Conflicts for water use in the Brazilian semi-arid region have occurred for centuries (Aragão Araújo, 1990), and governmental intervention has strongly relied on the construction of a reservoir network. Malveira et al. (2011) investigated the UJB and showed that, whereas in 1970 there were about 2200 dams in the basin, in 2002 there were almost 4100. The Orós Reservoir (with a storage capacity of
2000 hm3, constructed in 1961) is the largest of the
UJB, and the Trussu Reservoir (300 hm3, constructed in 1996) is the second largest. In the catchment area of the control section inserted in the UJB (Fig. 1), we estimated a total of 3200 dams in 2002. This means that presently the density of micro (storage capacity below 1 hm3, hereafter referred to as CI),
small (capacity between 1 and 10 hm3, referred to
as CII) and medium-sized (capacity between 10 and
50 hm3, referred to as CIII) reservoirs is so high
that the average direct catchment area is of the order of 6 km2 (this is about 50 times smaller than the area–reservoir ratio reported by Minear & Kondolf, 2009, for the region of California, USA, for exam-ple). Among the 3200 dams, only five are considered strategic (capacity larger than 50 hm3, referred to as CIV), i.e. those which can supply water
through-out long-term (2–4 years) droughts. This includes the following reservoirs: Várzea do Boi (52 hm3, con-structed in 1954), Poço da Pedra (52 hm3, 1958),
Canoas (69 hm3, 1999), Muquém (50 hm3, 2000), and Arneiroz II (197 hm3, 2004).
METHODOLOGY
The methodology proposed here is based on rating curves and fitted parameters derived from field data to predict the impact of the HdRN on the sediment dis-tribution (sediment retention at each reservoir class, and suspended sediment load and bed load at the con-trol section) in the study area (see Fig. 1). In the following sub-sections: Rainfall and water discharge, Suspended sediment load, Bed load, and Reservoir sedimentation, we describe, respectively, how the time series of runoff, suspended sediment load, bed load, and sediment deposition for different reservoir classes were obtained. The subsequent sub-section Sediment balance describes how the total sediment production (reservoir retention plus sediment yield) is integrated for the catchment area of the control section, and also extrapolated for the whole UJB. Limitations and uncertainties of the methodology are also discussed in the last item of this section.
Rainfall and water discharge
Daily precipitation data for the period of 25 years (1984–2008) were obtained from 16 raingauges distributed in different municipalities within the study area. Consistency analysis was carried out based on the data of three continuous-measurement climate
stations. Water level,H(m), and discharge,Q(m3s-1;
estimated from the rating curveQ=1.31H3.99;r2=
0.97) at the study control section were also obtained for the same period. Water level measurements were also taken on a daily basis, but during extreme events, hourly data were collected. The Geological Survey of Brazil (CPRM) verified the rating curve at least once per year for high discharges since 1999. These data were colleted from the Hidroweb Database (Brazilian National Water Agency, ANA). In order to fill the missing discharge data (13% of the period, related to the total non-null data) in the 25-year series, we adopted two procedures: (a) for part of the rainy sea-son of 2004 (year of extreme events, 1.5% of the non-null data), we subdivided the study area into four isochrones and used the modified Clark method (Kull & Feldman, 1998) to estimate the daily discharges; and (b) for the other periods (mostly dry season with very low discharges, 11.5% of the non-null data) we filled the series with the average discharge of the respective day based on the monitored years. This allowed us to generate a water discharge time series for the period of 25 years. The precipitation data were also used to estimate the rainfall erosivity cor-responding to each raingauge, which was later used to calculate reservoir sedimentation.
Suspended sediment load
Eight field surveys were conducted during the rainy season of 2008 to measure water discharge and sus-pended sediment load at the Jaguaribe River control section (see Fig. 1). Water velocity was measured across this section (20–22 verticals) using a pro-peller current meter equipped with a pulse meter, which was used to calculate the total water discharge. Suspended sediment samples were colleted using a US DH-48 sampler (10–12 verticals). The samples were then taken to the laboratory for estimation of the suspended sediment concentration. The method used was that described by Diplaset al. (2008). Using the above-mentioned data combined with water discharge and suspended sediment concentration measurements from 1999 to 2009 provided by CPRM, we obtained total water discharges ranging from 1 to 500 m3 s-1
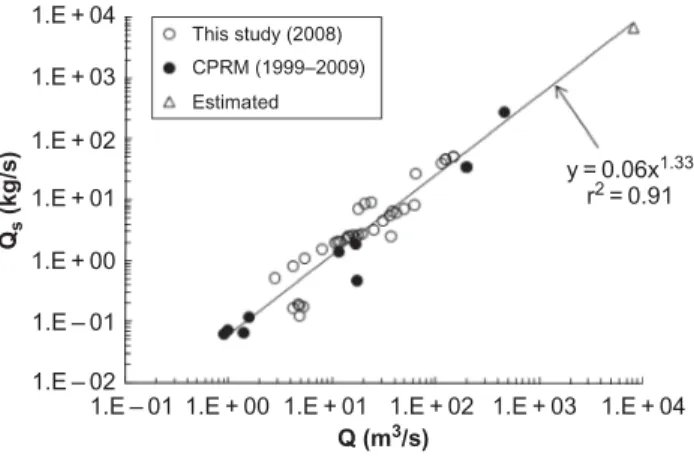
and suspended sediment concentrations ranging from 30 to 600 mg L-1, leading to loads ranging from 0.05 to 300 kg s-1. Thus, considering all data points (our data plus the CPRM data), the following power-law rating curve was obtained:
Qs=aQb (1)
whereQsis the suspended sediment load (kg s-1), and
a andb are parameters obtained by fitting the equa-tion to the field data. Although hysteretic behaviours have been observed for water discharge–suspended sediment load relationships during floods (Vericat & Batalla, 2006; Megnounif et al., 2007; Francke
et al., 2008b), they were neglected here. This is sup-ported by previous studies in semi-arid regions, where approximately 90% of the flood events analysed did not present any hysteresis (Achite & Ouillon, 2007). A recent study conducted by Cherif et al. (2009) in a semi-arid basin in Algeria also showed that coefficients of determination higher than about 0.8 can be obtained by fitting equation (1) to field data. Therefore, we assumed that this equation type was sufficient to represent the variations in the suspended sediment load as a function of the water discharge. We also used additional data available in the litera-ture to confirm the ability of equation (1) to predict the suspended sediment load for higher flow condi-tions (similar to the peak flows in the Jaguaribe River control section). This gave credence to equation (1) and allowed us to generate a daily suspended sediment load time series for the 25-year period.
Bed load
Four field surveys were conducted during the rainy season of 2009 in order to measure the bed load at the control section (Fig. 1). In the occasion, the water discharge was relatively low (1–5 m3 s-1). The bed material was colleted using a US BLH-84 sampler for 10–12 verticals. The sediment samples were then taken to the laboratory for grain-size analysis (diam-eters ranging from about 3 × 10⁻⁴ to 3
× 10-2 m)
and estimation of the bed load transport rate (rang-ing from about 0.05 to 0.20 kg s-1), according to the method described by Diplas et al. (2008). We cali-brated the energy line slope at the control section by introducing the above-mentioned data into a recently modified version of the Meyer-Peter and Müller bed load equation (Wong & Parker, 2006; García, 2008):
q∗=3.97(τ∗−0.0495)3/2 (2)
whereq∗ is the dimensionless bed load transport rate given byq∗=qb
D√gDλ;τ∗is the dimensionless shear stress, given byτ∗ =HS
(Dλ);qbis the volu-metric bed load transport rate per unit width (m2s-1);
Sis the energy line slope of the channel;Dis a charac-teristic sediment diameter (m) (usually taken asD50,
the grain size for which 50% of the bed material is finer);λis the submerged specific gravity of the sedi-ment given byλ=(ρs/ρ) – 1;ρsis the density of the
sediment; andρis the density of the water. This equa-tion is expected to be applicable to the present study since the range of sediment diameters for which it was developed (3.4×10⁻⁴to 3.0×10⁻²m) is the same as that obtained from our field surveys. Here, D50 was
equal to 8.5 ×10⁻⁴m and this value was used in the simulations. We also used additional data available in the literature to confirm the ability of equation (2) to predict the bed load for higher flow conditions. This gave credence to equation (2) and allowed us to gen-erate a daily bed load time series for the period of 25 years.
Reservoir sedimentation
Imagery of 1970 and 2002 was analysed, leading to the identification in the study area of about 1700 and 3200 reservoirs, respectively. These images, which were selected due to their high quality and tempo-ral distance, were taken in the first months of the dry season (July–August), when the reservoirs were full (as verified with field measurements) and land sur-face visible. In order to assess the reservoir volume,
Vo, the Molle (1991) empirical relationship, based on
measurements of more than 400 small dams in the Brazilian semi-arid region, was used:
Vo=
Ah
α (3)
where A is the inundated area (m2) and h is
the reference water height (m), which are related using the parameters α and β by the expression
h= α−1A
(α·β). Average values of α = 2.7 and β = 1500 were used in the present study (Molle, 1991). Thus, we could estimate the temporal evolu-tion of reservoirs (and their volumes) per class from 1970 to 2008 as follows:
(a) for the thousands of reservoirs of classes CI, CII
and CIII, annual increment rates were assumed
equal to those of the reservoirs monitored by the Federal and State water authorities in Ceará (Malveiraet al., 2011). We also assumed that the percentage of reservoirs for each of these three classes was constant throughout the period. This extrapolation fitted well the reservoirs observed in the satellite image of 2002. Such a procedure was conducted since most of these reservoirs
remain unregistered because of the unofficial and/or unplanned aspect of their construction; (b) for the reservoirs of class CIV, which had been
registered by water authorities, simple counting was done. These larger reservoirs could also be easily visualized in the satellite images.
In order to assess the reservoir sedimentation rate, we proposed the (temporal mean) rate of sediment reten-tion,ξm(t m-3MJ-1mm-1ha h) as a key parameter:
ξm=
V Vo
ρ
R (4)
whereV is the reservoir capacity reduction (hm3), ρ is the dry-bulk density of sediment (t m-3), and
Ris the cumulative rainfall erosivity factor (MJ mm ha-1 h-1). Note that the rainfall erosivity is one of the factors included in the universal soil loss equa-tion (USLE), given by Wischmeier & Smith (1978). In this study, due to the lack of detailed data for the computation of 30-min rainfall intensity representa-tive for the whole catchment, erosivity was obtained using equation (5a,b). This was proposed by Bertoni & Lombardi Neto (1990) for the southern region of Brazil, but verified as valid for the Brazilian semi-arid region too (de Araújoet al., 2003):
Rm=67.355
P2m P
0.85
(5a)
R= 12
m=1Rm (5b)
where Rm and R are, respectively, the monthly and annual erosivity factors (MJ mm ha-1h-1), andP
mand
Pare, respectively, the monthly total rainfall and the annual average rainfall (mm).
Measurements ofVoandV obtained from
sur-veys conducted in seven reservoirs ranging from class CI to CIV (de Araújo et al., 2003) allowed us to
calculate the rate of sediment retentionξm by using equation (4). The surveys were carried out at the end of the dry season so that the reservoir level was the lowest possible. Topographic surveys were conducted in the dry area, with density varying from 8 to 25 points per hectare. Bathymetric surveys were con-ducted in the wet area, with density varying from 5 to 60 points per hectare. In both cases, the smaller the reservoir, the higher the density of measurement points. Therefore, using an average value of the rate
of sediment retention (ξm), we could estimate the sed-imentation rate: (i) for classes CI, CIIand CIII, whose
reservoirs are randomly distributed in the study area, a spatial average value of the yearly erosivity factor (R) was obtained, and equation (6) could be applied to estimate the total sediment retention per reservoir class per year; and (ii) for class CIV, an annual
ero-sivity factor obtained for the catchment area of thejth reservoir (Rj) was used; hence, we could apply
equa-tion (7) to estimate the total sediment retenequa-tion per reservoir for every simulation year:
Mc =ncVo,cξmR (6)
Mj =Vo,jξmRj (7)
where Mc is the total mass of sediment retention
in the reservoir class (Mt),nc is the number of
reser-voirs for class c, and Vo,c is the class average initial
volume of the reservoirs (hm). Note that: the number of reservoirsnc increased in time with a yearly step; Vo,c was fixed for each class; ξm is unique; and the erosivity factor R varied on a yearly basis. In equa-tion (7)Mjis the total mass of sediment retention in thejth reservoir (Mt). Thus, the total sediment reten-tion for class CIV was the sum of Mj for the five reservoirs located in the study area (Várzea do Boi, Poço da Pedra, Canoas, Muquém and Arneiroz II). Note that these reservoirs were constructed in dif-ferent years. Volume Vo,j was known for the jth reservoir, and erosivity factor Rj varied on a yearly basis. This procedure allowed us to generate a yearly sediment retention time series for each reservoir class for the period of 25 years. It should be noted that we also compared our average value ofξm to the values obtained from Medeiros (2009), Lima (2010), and the Water Resources Management Company of Ceará— COGERH (2010) (including 12 reservoirs distributed in the UJB and other basins within the State of Ceará) in order to validate the method described above.
Sediment balance
The sediment balance for 1984–2008 in the study area was obtained from the integration of the time series of total sediment load (suspended load plus bed load) at the control section, as well as reservoir sedimenta-tion for each class (CIto CIV). The same methodology
was also extrapolated to the whole UJB, including the effects of sediment retention in the reservoirs located
outside the study area, which correspond to approx-imately a quarter of the reservoirs of the UJB (see Fig. 1). Thus, the retention in the reservoirs of classes CI, CII and CIII was calculated using equation (6),
while that in the class CIV reservoirs (Trussu and
Orós) was calculated using equation (7). The reten-tion in the Orós Reservoir (the largest of the UJB) was also compared to the retention estimated from measurements, using the following equation:
MOrós=(MSL+MBL) δTE (8)
where MSL and MBL are, respectively, the
sus-pended load and bed load inflow at the control section upstream the Orós Reservoir (Mt),δ is the UJB area divided by the study area (to account for the additional sediment production in the whole basin), andTEis the reservoir trap efficiency obtained from Brune’s rela-tionship (see Brune, 1953; García, 2008). It should be noted that the retention in the Orós, using equa-tion (8), is based on the assumpequa-tion that erosion and deposition processes in the reach of the Jaguaribe River between the control section and the reservoir entrance are in balance. This assumption is supported by the fact that no significant meandering pattern has been observed from aerial images in this river reach. The comparison above was important to validate our methodology based on equation (4) to assess reservoir sedimentation.
Limitations and uncertainties
Many parameters affect sediment distribution in large semi-arid basins with a HdRN, including: rainfall, water discharge, sediment characteristics, number of reservoirs, and catchment area/reservoir size and shape, which vary both spatially and temporally. The major limitations of our approach are: existence of a relatively small number of raingauges in the UJB; short-term monitoring of sediment fluxes; lack of data for extreme flood events in the control sec-tion; and availability of sedimentation data only for a few reservoirs. To complete the lacking data, we also used modelling and curve fitting, which involved calibration processes and uncertainties. Moreover, the methodology proposed here assumes that simi-lar erosion, transport and deposition processes occur within the basin and throughout the study period. Therefore, our methodology is expected to predict regional trends of sediment distribution in the basin, but not accurate estimates of deposition within indi-vidual reservoirs. Caution should also be taken when
applying the methodology to other basins, since it is based on the assumptions of randomly distributed reservoirs (classes CI–CIII) and no significant
land-use change over the study period.
RESULTS AND DISCUSSION
Rainfall, water discharge and river sediment transport
Figure 2 shows the time series of average precipi-tation in the study area, as well as water discharge, suspended sediment load and bed load at the con-trol section, obtained as described in the methodology above. In Fig. 2(a) and (b), it can be seen that the precipitation events, and their response as water dis-charge, occurred consistently during the rainy season (first six months of the year). However, rainfall was unusually high in 2004. The average daily precipita-tion in that period (5.6 mm) was about 50% higher than the 25-year average daily value for the same months (3.8 mm). This resulted in a peak water dis-charge of 8000 m3 s-1 (about 7.0
× 108 m3 d-1),
occurring in the middle of March 2004. It is inter-esting to note that the cumulative water discharge for January–June 2004 corresponded to about two thirds of the total cumulative value for the 25-year period.
Figure 2(c) shows the time series of suspended sediment load at the control section, obtained by using the rating curve shown in Fig. 3. This rating curve was generated by fitting equation (1) to the field data measured in 2008 and by the Geological Survey of Brazil (CPRM) from 1999 to 2009 (r2 =0.91,n =46). It is interesting to observe that the data from both sources collapse well into the fitted curve, suggesting that no significant changes in the water discharge–suspended sediment relation-ship occurred during the study period (1984–2008). This probably occurred because the direct catchment area remained constant during low-flow conditions, whereas in high level of flooding events the small reservoirs played secondary roles, allowing a large amount of the sediment inflow to reach the reser-voir spillway in such periods of high connectivity. Since our data and the CPRM data follow fairly sim-ilar trends, the results of using all data points or parts of them (as described in Horowitz, 2003) pro-duced differences smaller than 20%. Therefore, our rating curve is expected to be consistent. The extrap-olated point in Fig. 3 corresponds to the highest water discharge condition shown in Fig. 2(b) applying the curve given by Xu (2002), in which the saturated
0
20
40
Pr
ecipitation (mm/d) 60
80
(a)
Dischar
ge (m
3/d) 8.E+08
(b)
6.E+08
4.E+08
2.E+08
0.E+00
Suspended load (t/d)
(c)
1.E+06
8.E+05
6.E+05
4.E+05
2.E+05
0.E+00
Bed load (t/d)
(d)
1.E+06
8.E+05
6.E+05
4.E+05
2.E+05
0.E+00
jan-84 jan-86 jan-88 jan-90 jan-92 jan-94 jan-96 jan-98
Time
jan-00 jan-02 jan-04 jan-06 jan-08
Fig. 2 Time series of: (a) average precipitation in the study area, (b) water discharge, (c) suspended sediment load, and (d) bed load at the Jaguaribe River control section.
suspended sediment concentration, Cs (mg L-1) is a function of a dimensionless flow strength index, ψ =v3/(gwH), where g is the gravity acceleration, andv andware the water flow velocity and the set-tling velocity of the sediment, respectively. Note that we used the straight-line portion of Xu’s curve, which is based on data from a variety of rivers, irrigation channels and laboratory flumes at normal sediment concentrations, instead of the upper limb of the curve, which is based on hyperconcentrated flow regime data from Chinese rivers. Here we estimatedψ =22 and
Cs = 850 mg L-1 (v = 4.4 m s-1, w = 0.04 m s-1, andH =10 m), yielding a suspended sediment load
Qs of 588 000 t d-1, which is 30% lower than the value of 770 000 t d-1 obtained by extrapolating
the rating curve (see Fig. 3). Considering that the
extrapolated point was not used for the curve fit-ting, it can be assumed that the rating curve predicts well the suspended sediment load expected for the highest discharge conditions. Similarly to the water discharge behaviour (see Fig. 2(b)), the major contri-bution of the suspended load occurred from January to June 2004 (see Fig. 2(c)), corresponding to approx-imately 83% of the total cumulative value for the 25-year period. The average yearly suspended load divided by the study area resulted in a specific sus-pended sediment yield of 102 t km-2 year-1, which ranges from about 10 to 75% of the values obtained in other semi-arid watersheds (Probst & Amiotte-Suchet, 1992; Megnounif et al., 2003; Achite & Ouillon, 2007; Meloet al., 2009). Another compari-son can be made between the rating curve obtained in
1.E+04
This study (2008)
CPRM (1999–2009)
Estimated
1.E+03
1.E+02
1.E+01
1.E+00
Qs
(kg/s)
1.E–01
1.E–01 1.E+00
Q (m3/s)
1.E+01 1.E+02 1.E+03 1.E+04
y=0.06x1.33
r2=0.91
1.E–02
Fig. 3 Rating curve relating water discharge to suspended sediment load at the control section, obtained by fitting equation (1) to field data measured in the present study and by CPRM. The extrapolated point was estimated by applying the saturated suspended sediment concentration.
the present study (Qs=0.06Q1.33) and that obtained by Cherifet al. (2009) in a semi-arid basin in Algeria (Qs = 5.72Q1.31). Although the two curves follow similar power laws, our suspended loads were about 100 times smaller (for the same water discharges). This lower suspended load is possibly a consequence of sediment retention in the numerous reservoirs in our study area, suggesting that most of the sediment transported downstream from the dams was due to reservoir overflow. Moreover, flood attenuation due to the existence of the dams might also have played an important role in reducing the ability of the flow to suspend and transport the sediments.
Figure 2(d) shows the time series of bed load at the Jaguaribe River control section obtained by equa-tion (2), considering a calibrated energy line of slope
S = 0.75 m km-1. We also evaluated other bed load equations available in the literature, such as those of Cheng, Bagnold, Brown, Einstein, Meyer-Peter & Müller, and Van Rijn (cited in García, 2008), but equation (2) presented the best fit to the field data (efficiency coefficient of 0.813, as defined by Nash & Sutcliffe, 1970), as well as a value ofSclose to the river slope (0.60 m km-1). The comparison between measured and computed bed load transport rate is depicted in Fig. 4. The extrapolated point corresponds to the data measured by Gaeuman & Jacobson (2007) in a reach of the Missouri River, USA, with character-istics (Q=5500 m3 s-1,W =200 m,H =9 m,S =
0.16 m km-1, andD
50=5.5×10⁻⁴m) similar to those
in the studied reach of the Jaguaribe River. It can be seen that, for such conditions, equation (2) estimates a bed load per unit width of 1.6 kg s-1m-1, which is only
1.E + 01
1.E + 00
Line of perfect agreement
1.E – 01
Computed bedload tr
anspor
t
ra
te (kg m
-1 s -1)
1.E – 02
1.E – 03 1.E – 03
NSE=0.813
1.E – 02
Measured bedload transport rate (kg m-1 s-1) 1.E – 01 1.E + 00
Jaguaribe Missouri
1.E + 01
Fig. 4 Comparison between bed load transport rate mea-sured in the control section and computed values using equation (2). The efficiency coefficient NSE is also indi-cated. The extrapolated point corresponds to the data measured by Gaeuman & Jacobson (2007).
20% lower than the value of 2.0 kg s-1 m-1 reported by Gaeuman & Jacobson (2007). This indicates that equation (2) predicted well the bed load for higher discharge conditions. The simulation using equation (2) for the 25-year period resulted in a maximum bed load of 163 000 t d-1 (see Fig. 2(d)). Similarly to the water discharge and suspended load behaviours (Fig. 2(b) and (c)), the major contribution of the bed load occurred between January and June 2004 (Fig. 2(d)), corresponding to approximately 50% of the total cumulative value for the 25-year period. The average bed load resulted in 46 t km-2 year-1, about 30% of the total river sediment load at the control section. This percentage is about 5-fold larger than values reported in semi-arid basins (Alexandrovet al., 2009). A value of the same order of magnitude (40%) was also obtained by Vericat & Batalla (2006) in river reaches downstream from dams. However, in their case, the sediment diameter was larger (D50 =
3 × 10⁻² m). The relatively high bed load percent-age (or low suspended load percentpercent-age) reported here is probably due to reservoir sedimentation and flood attenuation, as mentioned above.
Reservoir sedimentation and sediment balance
The temporal evolution of reservoirs per class in the study area, obtained as described in the methodology above, is shown in Fig. 5. It can be seen that the num-ber of reservoirs is inversely dependent on their class capacity. For example, in 2008, the number of reser-voirs of class CI was about 3100 while that of class
CIVwas five. However, for the 25-year period (1984–
2008), the number of reservoirs of class CIVincreased
10000
1000
100
Number of
r
eser
v
oir
s per c
lass
10
1
Cl Cll Clll ClV
Time
1984 1986 1988 1990 1992 1994 1996 1998 2000 2002 2004 2006 2008
Fig. 5 Temporal evolution of micro (class CI, <1 hm3),
small (class CII, 1–10 hm3), medium-sized (class CIII, 10–
50 hm3) and large reservoirs (class CIV,>50 hm3) in the
study area.
about 4% per annum, while that of classes CI, CII
or CIII increased only about 2% per annum. Similar
increases in the number of reservoirs in dryland areas have also been reported by Pisanielloet al. (2006) and Callow & Smettem (2009).
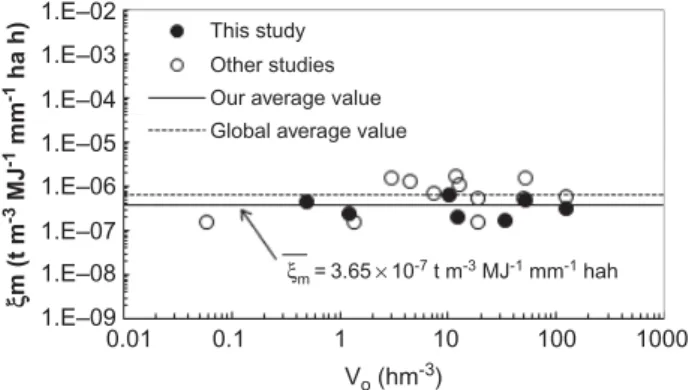
Figure 6 shows the values of the rate of sedi-ment retention,ξm, as a function of the initial storage capacity of the reservoirs, Vo. It is interesting to
observe that ξm does not vary significantly with Vo
and does not present any trend. Our average value (ξm) corresponds to the data given by de Araújoet al. (2003), while the global average value also includes the data from Medeiros (2009), Lima (2010) and COGERH (2010) in order to validate the method. Note that Fig. 6 includes the results for 19 reser-voirs of different locations (including the UJB and
1.E–02
This study
Other studies
Our average value Global average value
ξm =3.65×10⁻⁷ t m-3 MJ-1 mm-1 hah
1.E–03
1.E–04
1.E–05
1.E–06
ξ
m (t m
-3 MJ -1 mm -1 ha h)
1.E–07
1.E–08
1.E–09
0.01 0.1 1 10
Vo (hm-3)
100 1000
Fig. 6 Rate of sediment retention calculated from field measurements (de Araújoet al., 2003) as a function of the initial storage capacity of the reservoirs (coefficient of vari-ation is 0.49 without any trend). The global average value also includes data from Medeiros (2009), Lima (2010), and COGERH (2010).
other basins located in the State of Ceará), initial storage capacities (ranging from 0.06 to 126 hm3), and operation periods (ranging from 6 to 103 years). Since reservoir sedimentation rate can also be esti-mated by the global product of USLE × SDR ×
TE, where SDR is the sediment delivery ratio (see de Araújo et al., 2003), it can be inferred that the parameter ξm becomes approximately constant for different reservoir classes if there is a balance among the global product of these three factors. A recent study conducted by Lima (2010) in a micro-reservoir in the UJB has showed that TE can be as low as 7% (i.e. about six times lower than that predicted using Brune’s relationship). In contrast to the larger reser-voirs, the micro reservoirs in the semi-arid Brazilian region are usually designed to be filled every year (and also overflow water and sediment). A study conducted by Almeida (2001) in a medium sized-reservoir located in the State of Ceará has showed that
TEis about 86%, which is slightly lower than that pre-dicted by using Brune’s relationship. Therefore, while in smaller reservoirs USLE×SDR is expected to be high (i.e. there is a higher variability of rainfall ero-sivity, as well as a higher sediment yield), and TE is expected to be low (i.e. there is a higher overflow of water and sediments), in larger reservoirs, the oppo-site is expected to occur. Note that the procedure for reservoir sizing (i.e. the determination of Vo, which
is included in equation (4)) used in the State of Ceará usually takes into account the variability of some fac-tors, such as catchment area, slope, and cover type (see Carvalho, 1983; Campos, 1996), which also have some impact on the USLE factors. Therefore, Fig. 6 suggests that equation (4) incorporates the variability of the global product of USLE×SDR×TE and can be used to estimate (at least as a first approximation) reservoir silting in large semi-arid Brazilian basins.
The average value of the rate of sediment reten-tion (ξm=3.65×10⁻⁷t m-3MJ-1mm-1ha h) obtained from Fig. 6 was used in equations (6) and (7) to estimate the sedimentation rate for the four reservoir classes in the study area. Figure 7 shows time series of this sedimentation rate, as well as a time series of the sediment yield (total sediment discharge, i.e. sus-pended load plus bed load; Fig. 2(c) and (d)) at the Jaguaribe River control section. It may be observed that the two sets of curves in Fig. 7 present some degree of correlation (r = 0.40), regardless of the fact that they have been constructed independently from each other, using different methods. An evalu-ation of these curves over the 25-year period resulted in sediment retention by reservoirs of 122 Mt or
Ann
ual r
a
te (Mt)
1984 1988
Reservoir retention
Sediment yield
1992 1996
Time
2000 2004 2008
1.E + 02
1.E + 01
1.E + 00
1.E – 01
1.E – 02
Fig. 7 Time series of global reservoir retention (includ-ing the four reservoir classes: CI, CII, CIII and CIV) and
sediment yield at the Jaguaribe River control section.
235 t km-2year-1 (classes C
I–CIV), which is about
60% higher than the sediment yield at the control sec-tion (76 Mt or 148 t km-2year-1). The only exception is the year 2004 (see Fig. 7), when sediment discharge surpassed (almost five times) reservoir retention, due to excessive overflow in the whole reservoir network caused by intensive flooding, as observed in three nested watersheds within the UJB (Wiegand, 2009; Medeiros, 2009; Lima, 2010). In contrast, during the driest year of the period, 2005, reservoir retention was more than 200 times larger than sediment yield. Reservoir retention is, therefore, consistently greater than sediment yield, which shows the importance of the network for both sediment yield and sediment distribution in a basin with a HdRN.
As observed by Medeiros et al. (2010) in two watersheds within the UJB, the excess rainfall is only notable during extreme flood events, or after sequences of rainfalls, when the hydrological con-nectivity is high. Thus, in this region, the spatial patterns of overland flow are very similar to those of sediment yield. Therefore, our region can be consid-ered transport-limited. In other climate regions (non-dryland areas), lower variability of reservoir inflows is expected and, as a consequence, different proce-dures are used for reservoir sizing (see Camposet al., 1997). Hence, in such cases, the average value of the rate of sediment retention ξm may differ from that obtained in our study, but proportionality betweenξm and rainfall erosivity might also occur.
Figure 8 shows the sediment distribution along the 25-year period in the study area (20 700 km2) and the whole UJB (24 600 km2). In Fig. 8(a), it can be seen that the CI, CII, CIII and CIV reservoir classes
retained, respectively, 6, 18, 33 and 5% of the total sediment production (reservoir retention plus sedi-ment yield) in the study area (198 Mt, or 383 t km-2
40%
(a)
(b)
35% 30%
25% 20%
Sediment distrib
ution
(Study ar
ea)
Sediment distrib
ution
(UJB)
15% 10%
5% 6%
18% 33%
5%
5%
16%
29%
47%
2% 12%
27%
0%
0% 10% 20% 30% 40% 50% 60%
CI CII CIII CIV BL SL
CI CII CIII CIV Outlet
Fig. 8 Sediment distribution along the 25-year period (1984–2008) in the study area: (a) for the control section (20 700 km2); and (b) for the whole UJB (24 600 km2).
CI, CII, CIII and CIV represent the four reservoir classes;
BL: bed load, SL: suspended load; and Outlet: the sediment discharge in the Orós Reservoir outlet.
year-1), while the bed load and suspended load at the
control section corresponded to 12 and 27% of that amount, respectively. Although the percentage of sed-iment retained in the reservoirs increased consistently from classes CI to CIII, it decreased significantly for
class CIV, as the control section is located upstream
of the largest reservoir of the basin. Figure 8(b) shows that the inclusion of the reservoirs Trussu (300 hm3)
and Orós (2000 hm3) in the sediment balance of the whole UJB increased the contribution of the reser-voir class CIVto 47% of the total sediment production
in the whole basin (275 Mt, or 447 t km-2 year-1). The retention in the Orós Reservoir estimated from equation (7) was also compared to the retention esti-mated using equation (8), giving a difference of only 20%, which confirms the validity of the methodol-ogy proposed here to assess reservoir sedimentation. Note that, in equation (8), we used a trap efficiency
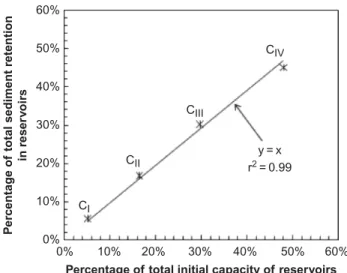
TE = 95%, which was obtained from Brune’s rela-tionship considering a ratio of 0.8 between reservoir capacity and average annual inflow. This resulted in a sediment yield at the Orós Reservoir outlet of 2% of the total sediment production in the UJB. Figure 9 shows the potential sediment retention as a function of the initial storage capacity for the four reservoir
60%
50%
40%
30%
20%
P
er
centa
ge of
total sediment r
etention
in r
eser
v
oir
s
10%
0% CI
CII
CIII
y=x r2=0.99
CIV
0% 10% 20% 30%
Percentage of total initial capacity of reservoirs
40% 50% 60%
Fig. 9 Potential sediment retention as a function of the ini-tial storage capacity for the four reservoirs classes in the Upper Jaguaribe Basin.
classes in the UJB. A simple linear relationship (y=x,
r2 =0.99) was obtained, which suggests that the ini-tial storage capacity is a good parameter to assess the percentage of sediment retention in each reser-voir class. This practical result is important to help in the problem of sediment management in basins with a HdRN. Although the methodology proposed here predicted well (20% difference) the retention in the Orós Reservoir, it is not expected to produce accurate estimates of deposition within individual reservoirs, especially the smaller ones, where trap efficiency may vary greatly depending on the catchment area, reservoir size and shape, among other parameters.
The percentages depicted in Fig. 8(b) indicate that the HdRN affects the basin’s geomorphology through sediment redistribution in the different reser-voir classes (98% of the total sediment production), and may also enhance erosion downstream of the reservoirs, especially at the UJB outlet where a very small amount of sediment (2% of the total sediment production) is discharged. According to the work of Einsele & Hinderer (1997), for a 20×103-km2 arid to semi-arid watershed, the sediment yield is expected to be within the range of 300–2000 t km-2 year-1, whereas the sediment yield of the control section is 148 t km-2year-1. Nonetheless, if the sediment reten-tion is considered, the total sediment producreten-tion rises to 383 t km-2 year-1, which is in agreement with the results of Einsele & Hinderer (1997). Note that the total sediment production in the UJB is equal to 447 t km-2 year-1, which is still close to the lower limit (i.e. 300 t km-2year-1) of the range above. The relatively low sediment production obtained here is
probably a consequence of flood attenuation (and lower fluvial sediment transport) due to the exis-tence of the numerous reservoirs. However, the HdRN reduces silting of the large (strategic) reservoirs, which would be expected to, at least, double in the case where only such reservoirs existed. This means that retention in non-strategic reservoirs has a positive impact on water availability, since siltation reduces considerably the water yield in semi-arid reservoirs. In order to illustrate that, we estimated the annual percentage storage loss by sedimentation in the Orós Reservoir for to two scenarios: (a) considering all the four reservoir classes, as shown in Fig. 1; and (b) con-sidering only the existence of the Orós Reservoir (i.e. neglecting the effect of the smaller reservoirs). For the first scenario, the annual storage loss by sedimenta-tion would be 0.18%, while for the second scenario, it would be 0.48%. This implies that, within 50 years, the Orós Reservoir would lose approximately 8 and 21% of its current storage capacity, according to sce-narios (a) and (b), respectively. We can also estimate the impact of siltation on water yield reduction using the methodology described by de Araújoet al. (2006). Following that methodology, water yield in the Orós Reservoir with 90% reliability would reduce approx-imately 27 and 37%, according to scenarios (a) and (b), respectively. Although the other reservoirs eval-uated here (see Fig. 6) are potentially being filled up with sediments at an average rate of about 0.2% of their initial storage capacity per year, which is lower than that observed in the world’s reservoirs (approx. 1% of the initial storage capacity per year, see Morris
et al., 2008), the results above show that the impacts of the HdRN cannot be neglected. This has important implications, since most empirical curves and hydro-sedimentological models used to estimate sediment yield at the basin scale consider only the effect of larger reservoirs (see the Introduction section above).
CONCLUSIONS
We presented a methodology based on rating curves and fitted parameters derived from field data to assess the sediment distribution in a large semi-arid Brazilian basin with a High-density Reservoir Network (HdRN). The bed load and suspended load estimated at a selected river control section were, respectively, 30% and 70% of the total sediment yield in the basin. The relatively low contribution of the suspended load (compared with other semi-arid regions) was attributed to the impact of the dense reservoir network. Micro (<1 hm3), small (1–10 hm3)
and medium-sized (10–50 hm3) reservoirs retained,
respectively, 5, 17 and 30% of the total sediment retention by the network, which means that the silt-ing of the large or strategic (>50 hm3) reservoirs would be expected to, at least, double in the case where only such reservoirs existed. Therefore, reten-tion in non-strategic reservoirs has a positive impact on water availability, since siltation reduces consider-ably water yield in semi-arid reservoirs. The potential sediment retention in the different reservoir classes was also shown to be a linear function of their cor-responding initial storage capacity. The HdRN has considerable impact on the basin’s geomorphology, since the reservoir sediment retention was about 60% higher than the sediment yield. Hence, at least two processes caused by the dense reservoir network are expected to reduce sediment yield in a large catch-ment: sediment direct retention and lowering of peak discharges.
Acknowledgements The authors are grateful to CAPES (Coordination for the Improvement of Higher Education Personnel) for the post-doctorate scholarship granted to the first author (PRODOC, Edital de Convocação 01/2007, Programa de Pós-Graduação em Engenharia Agrícola/UFC), to CNPq (National Council of Technological and Scientific Development) for the financial support of the CONECTE project (Grant no. 471101/2007-9), and to FINEP (Research and Projects Financing) for the financial support of the DISPAB project (Grant no. 2073/07). The authors would also like to thank Dr Alexandre Barra for translating the abstract into French.
REFERENCES
Achite, M. & Ouillon, S. (2007) Suspended sediment transport in a semiarid watershed, Wadi Abd, Algeria (1973–1995).J. Hydrol. 343, 187–202.
Aguiar, M. I., Maia, S. M. F., Oliveira, T. S., Mendonça, E. S. & Araújo Filho, J. A. (2006) Soil, water and nutrient losses in different agroforestry systems in Sobral county, Ceará, Brazil.
Revista Ciência Agronômica37(3), 270–278 (in Portuguese).
Alexandrov, Y., Cohen, H., Laronne, J. B. & Reid I. (2009) Suspended sediment load, bed load, and dissolved load yields from a semi-arid drainage basin: a 15-year study.Water Resour. Res. 45, W08408, doi:10.1029/2008WR007314.
Almeida, G. B. (2001) Modelagem da retenção de sedimentos em reservatórios do semi-árido. MSc Thesis, Federal University of Ceará, Fortaleza, Ceará, Brazil (in Portuguese).
Aquino, D. N., Andrade, E. M., Lopes, F. B., Teixeira, A. S. & Crisóstomo, L. A. (2008) The impact of irrigation on soil-water resources.Revista Ciência Agronômica39(2), 225–232 (in Portuguese).
Aragão Araújo, J. A. (1990) Dams in the Northeast of Brazil. Fortaleza, Ceará: DNOCS.
Bertoni, J. & Lombardi Neto, F. (1990)Conservação do Solo. Second edn (in Portuguese). São Paulo: Ícone, Brazil.
Brune, G. M. (1953) Trap efficiency of reservoirs. Trans. Am.
Geophys. Union34, 407–418.
Callow, J. N. & Smettem, K. R. J. (2009) The effect of farm dams and constructed banks on hydrologic connectivity and runoff estimation in agricultural landscapes.Environ. Model. Software 24, 959–968.
Campos, J. N. B. (1996) Dimensionamento de Reservatórios:
O Método do Diagrama Triangular de Regularização (in
Portuguese). Fortaleza, Ceará: UFC.
Campos, J. N. B., Souza Filho, F. A. & Araújo, J. C. (1997) Errors and variability of reservoir yield estimation as a function of the coefficient of variation of annual inflow. In:XXVII IAHR
Congress(San Francisco), 524–529. International Association
of Hydraulic Engineering and Research (IAHR).
Carvalho, L. H (1983). Curso de Barragens de Terra com
vis-tas ao Nordeste Brasileiro, vol. I. Ministério do Interior (in
Portuguese). Fortaleza, Ceará: DNOCS.
Chen, E. & Mackay, D. S. (2004) Effects of distribution-based param-eter aggregation on a spatially distributed nonpoint source pollution model.J. Hydrol.295, 211–224.
Cherif, E. A., Errih, M. & Cherif, H. M. (2009) Modélisation statis-tique du transport solide du bassin versant de l’Oued Mekerra (Algérie) en zone semi-aride méditerranéenne.Hydrol. Sci. J. 54(2), 338–348.
Church, M. & Slaymaker, O. (1989) Disequilibrium of holocene sedi-ment yield in glaciated British-Columbia.Nature,London337, 452–454.
COGERH (Water Resources Management Company of Ceará) (2010) Bathymetric survey reports (in Portuguese). Fortaleza, Ceará: COGERH.
de Araújo, J. C. (2007) Entropy-based equation to assess hillslope sediment production.Earth Surf. Processes Landf.32, 2005– 2018.
de Araújo, J. C., Fernandes, L., Machado Júnior, J. C., Lima Oliveira, M. R. & Cunha Sousa, T. (2003) Sedimentation of reservoirs in semiarid Brazil. In:Global Change and Regional Impacts: Water Availability and Vulnerability of Ecosystems and Society
in the Semiarid Northeast of Brazil(T. Gaiser, M. S. Krol, H.
Frischkorn & J. C. de Araújo, eds), 205–216. Berlin: Springer-Verlag.
de Araújo, J. C., Güntner, A. & Bronstert, A. (2006) Loss of reser-voir volume by sediment deposition and its impact on water availability in semiarid Brazil.Hydrol. Sci. J.51(1), 157–170. de Araújo, J. C. & Knight, D. W. (2005) Assessment of
sed-iment yield of watersheds by reservoir survey and sim-ulation modelling in Brazilian semiarid environment. In: Geomorphological Processes and Human Impacts in River
Basins(R. J. Batalla & C. Garcia, eds), 124–130. Wallingford:
IAHS Press, IAHS Publ. 299. Abstracts available at: http://www.iahs.info/redbooks/299.htm.
de Vente, J., Poesen, J. & Verstraeten, G. (2005) The application of semi-quantitative methods and reservoir sedimentation rates for the prediction of basin sediment yield in Spain.J. Hydrol.305, 63–68.
de Vente, J., Poesen, J., Verstraeten, G., Van Rompaey, A. & Govers, G. (2008) Spatially distributed modelling of soil erosion and sediment yield at regional scales in Spain. Global Planet.
Change60, 393–415.
Diplas P., Kuhnle, R. & Gray, J. (2008) Sediment transport measure-ments. Chapter 5, in: Sedimentation Engineering: Processes,
Measurements, Modeling, and Practice (M. H. García, ed.)
Reston, VA: American Society of Civil Engineers, ASCE Manual of Practice 110.
Einsele, G. & Hinderer, M. (1997) Terrestrial sediment yield and the lifetimes of reservoirs, lakes, and larger basins,Geol. Rundsch. 86, 288–310.
Flanagan, D. C., Ascough ,II J. C., Nicks, A. D., Nearing, M. A. & Lafle, J. M. (1995) Overview of the WEPP erosion pre-diction model. In:Water Erosion Prediction Project Hillslope
Profile and Watershed Model Documentation(D. C. Flanagan
& M. A. Nearing, eds), 1.1–1.12. West Lafayette, IA: US Dept Agriculture.
Francke, T., Guntner, A., Bronstert, A., Mamede, G. L. & Muller, E. N. (2008a) Automated catena-based discretisation of land-scapes for semi-distributed hydrological modelling. Int. J.
Geogr. Inf. Sci.22(2), 111–132.
Francke, T. López-Tarazón, J. A. & Schröder, B. (2008b) Estimation of suspended sediment concentration and yield using linear models, random forests and quantile regression forests.Hydrol.
Processes22, 4892–4904.
Gaeuman, D. & Jacobson, R. B. (2007) Field assessment of alter-native bed-load transport estimators.J. Hydraul. Engng ASCE 133(12), 1319–1328.
Gaiser, T., Krol, M. S., Frischkorn, H. & de Araújo, J. C. (2003) Global Change and Regional Impacts: Water Availability and Vulnerability of Ecosystems and Society in the Semi-arid
Northeast of Brazil. Berlin: Springer-Verlag.
García, M. H. (ed.) (2008)Sedimentation Engineering: Processes,
Measurements, Modeling, and Practice. Reston, VA: American
Society of Civil Engineers, ASCE Manual of Practice 110. Güntner, A. & Bronstert, A. (2004) Representation of landscape
variability and lateral redistribution processes for large-scale hydrological modelling in semiarid areas.J. Hydrol.297(1-4), 136–161.
Horowitz, A. J. (2003) An evaluation of sediment rating curves for estimating suspended sediment concentrations for subsequent flux calculations.Hydrol. Processes17, 3387–3409.
Kull, D. W. & Feldman, A. D. (1998) Evolution of Clark’s unit hydro-graph method to spatially distributed runoff.J. Hydrol. Engng 3(1), 9–19.
Lima, Y. C. P. (2010) Análise do Assoreamento de um Pequeno Reservatório: Estudo de caso Açude Boqueirão, Aiuaba, CE. MSc Thesis, Federal University of Ceará, Fortaleza, Ceará, Brazil (in Portuguese).
Malveira, V. T. C., de Araújo, J. C. & Güntner, A. (2011) Hydrological directives for an optimized reservoir network in the semiarid north-eastern Brazil.J. Hydrol. Engng ASCE(accepted). Mamede, G. L. (2008) Reservoir sedimentation in dryland
catchments: modelling and management. PhD dissertation, University of Potsdam, Potsdam, Germany.
Mati, B. M., Morgan, R. P. C. & Quinton, J. N. (2006) Soil erosion modelling with EUROSEM at Embori and Mukogodo catchments, Kenya. Earth Surf. Processes Landf. 31, 579–588.
Medeiros, P. H. A. (2009) Processos hidrossedimentológicos e conec-tividade em bacia semiárida: modelagem distribuída e validação em diferentes escalas. PhD Dissertation, Federal University of Ceará, Fortaleza, Ceará, Brazil (in Portuguese).
Medeiros, P. H. A., de Araújo, J. C. & Bronstert, A. (2009) Interception measurements and assessment of Gash model performance for a tropical semiarid region. Revista Ciência
Agronômica40(2), 165–174.
Medeiros, P. H. A., Güntner, A., Francke, T., Mamede, G. L. & de Araújo, J. C. (2010) Modelling spatio-temporal patterns of sediment yield and connectivity in a semi-arid catchment with the WASA-SED model.Hydrol. Sci. J.55(4), 636–648. Megnounif, A., Terfous, A. & Bouanani, A. (2003) Production and
transport of suspended sediment in the Upper-Tafna river basin (North West Algeria).Rev. Sci. Eau16(3), 369–380.
Megnounif, A., Terfous, A., Ghenaim, A. & Poulet, J. B. (2007) Key processes influencing erosion and sediment transport in a semi-arid Mediterranean area: the Upper Tafna catchment, Algeria.
Hydrol. Sci. J.52(6), 1271–1284.
Melo, R. O., Cantalice, J. R. B., Araújo, A. M., Cunha Filho, M., Souza, W. L. S. & Silva, Y. J. A. B. (2009) Produção de sedi-mento suspenso de uma típica bacia hidrográfica semi-árida. In: Produção de Sedimentos e seus Impactos Ambientais, Sociais e
Econômicos(C. N. Ide, L. A. A. Val & M. L. Ribeiro, eds),
199–216. Campo Grande, Oeste: Mato Grosso do Sul. Minear, J. T. & Kondolf, G. M. (2009) Estimating reservoir
sedimentation rates at large spatial and temporal scales: a case study of California. Water Resour. Res. 45, W12502, doi:10.1029/2007WR006703.
Molle, F. (1991) Caractéristiques et potentialités des Açudes du Nord-este brésilien. PhD Dissertation, University of Montpellier-II, France.
Morgan, R. P. C., Quinton, J. N., Smith, R. E., Govers, G., Poesen, J., Auerswald, K., Chisci, G., Torri, D. & Styczen, M. E. (1998) The European Soil Erosion Model (EUROSEM): a dynamic approach for predicting sediment transport from fields and small catchments.Earth Surf. Processes Landf.23, 527–544.
Morris, G. L., Annandale, G. & Hotchkiss, R. (2008) Reservoir sedimentation. Chapter 12 in: Sedimentation Engineering:
Processes, Measurements, Modeling, and Practice (M. H.
García, ed.). Reston, VA: American Society of Civil Engineers, ASCE Manual of Practice 110.
Nash, J. E. & Sutcliffe, J. V. (1970) River flow forecasting through conceptual models, Part I – A discussion of principles. J.
Hydrol.10, 282–290.
Pisaniello, J. D., Zhifang, W. & McKay, J. M. (2006) Small dams safety issues—engineering/policy models and commu-nity responses from Australia.Water Policy8, 81–95. Probst, J. L. & Amiotte-Suchet, P. A. (1992) Fluvial suspended
sed-iment transport and mechanical erosion in the Maghreb (North Africa).Hydrol. Sci. J.37(6), 621–637.
Prosser, I. P., Rutherfurd, I. D., Olley, J. M., Young, W. J., Wallbrink, P. J. & Moran, C. J. (2001). Large-scale patterns of erosion and sediment transport in river networks, with examples from Australia.Marine Freshwater Res.52, 81–99.
Ramsankaram, R., Kothyari, U. C. & Rawat, J. S. (2009) Simulation of surface runoff and sediment yield using the water erosion prediction project (WEPP) model: a study in Kaneli watershed, Himalaya, India.Hydrol. Sci. J.54(3), 513–525.
Rostamian, R., Jaleh, A., Afyuni, M., Mousavi, S. F., Heidarpour, M., Jalalian, A. & Abbaspour, K. (2008) Application of a SWAT model for estimating runoff and sediment in two mountainous basins in central Iran.Hydrol. Sci. J.53(5), 977–988. Vericat, D. & Batalla, R. (2006) Sediment transport in a large
impounded river: The lower Ebro, NE Iberian Peninsula.
Geomorphology79, 72–92.
Verstraeten, G., Poesen, J., de Vente, J. & Koninckx, X. (2003) Sediment yield variability in Spain: a quantitative and semiqualitative analysis using reservoir sedimentation rates.
Geomorphology50(4), 327–348.
Verstraeten, G., Prosser, I. P. & Fogarty, P. (2007) Predicting the spatial patterns of hillslope sediment delivery to river chan-nels in the Murrumbidgee catchment, Australia.J. Hydrol.334, 440–454.
Walling, D. E. (1983) The sediment delivery problem.J. Hydrol.65, 209–237.
Wiegand, M. C. (2009) Proposta metodológica para estimativa da pro-dução de sedimentos em grandes bacias hidrográficas: estudo de caso Alto Jaguaribe, CE. MSc Thesis, Federal University of Ceará, Fortaleza, Ceará, Brazil (in Portuguese).
Wilkinson, S. N., Prosser, I. P., Rustomji, P. & Read, A. M. (2009) Modelling and testing spatially distributed sediment budgets to relate erosion processes to sediment yields.Environ. Model.
Software24, 489–501.
Wischmeier, W. H. & Smith, D. D. (1978) Predicting rainfall ero-sion losses. A guide to conservation planning. Washington, DC: Department of Agriculture, Agriculture Handbook 537.
Wong, M. & Parker, G. (2006) Reanalysis and correction of bed-load relation of Meyer-Peter and Müller using their own database. J. Hydraul. Engng ASCE 132(11), 1159–1168.
Xu, J. (2002) Complex behaviour of natural sediment-carrying streamflows and the geomorphological implications.Earth Surf.
Processes Landf.27, 749–758.