ISSN online: 1807-1775
DOI: 10.4301/S1807-1775201815010
Manuscript first received: 2016-04-04. Manuscript accepted: 2018-08-14
PC, Lai. ELM Graduate School, Help University, Malaysia. Email: [email protected] RESEARCH METHODOLOGY FOR NOVELTY TECHNOLOGY
P.C. Lai https://orcid.org/0000-0002-8319-8459 ELM Graduate School, Help University, Malaysia
ABSTRACT
This paper contributes to the existing literature by reviewing the research methodology and the literature review with the focus on potential applications for the novelty technology of the single platform E-payment. These included, but were not restricted to the subjects, population, sample size requirement, data collection method and measurement of variables, pilot study and statistical techniques for data analysis. The reviews will shed some light and potential applications for future researchers, students and others to conceptualize, operationalize and analyze the underlying research methodology to assist in the development of their research methodology.
Keywords: Research Methodology; Single Platform E-payment; Sample Size, Structural Equation Model, Data Analysis
INTRODUCTION
The research methodology of this study is presented in this article and provides the details of research instrument development for the novelty technology like “single platform E-payment System” (Lai, 2012; 2014; 2015; 2016: 2018). According to Avison and Fitzgerald (1995), the methodology is based on some philosophical paradigm besides a compilation of procedures, techniques, tools and documentation aids that is being discussed in this article. This article also discusses the subjects, population, sample size requirement, data collection method and measurement of variables, pilot study and statistical techniques for data analysis.
RESEARCH STRATEGY
Positivism is an epistemology position that advocates the applications of the research strategy that is used in this study. It involves a deductive approach and underpinned by objectivist ontology (Crotty, 1998). The research strategy is vital to any study in order to identify hypotheses and significance to research development (Miller, 1983; Marczyk, DeMatteo and Festinger, 2005; Bryman and Bell, 2007).
Yin (2002) identifies the main research methods include surveys and experiments as primary research as well as archival analysis and case studies as secondary research. Methods used include library research, field work, interviews, surveys, observation, evaluation, and analysis. There are some secondary data being discussed in this paper. Because of the limitation of the secondary data, primary research using quantitative method is being chosen in this research.
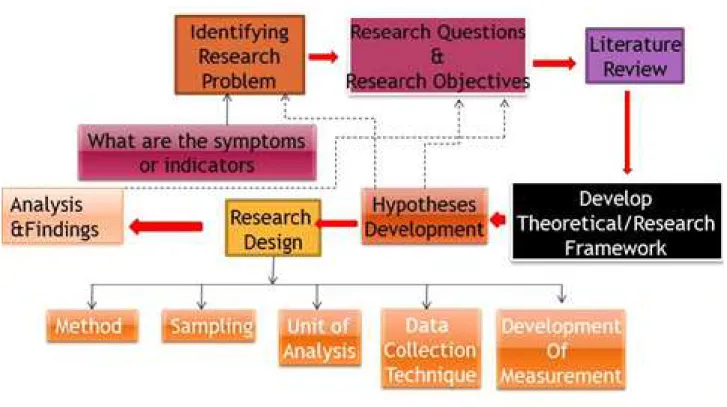
The aim of this study is to examine the relationships between perceived ease of use, perceived usefulness and perceived risk with consumers’ intention to use the novelty single platform E-payment (Lai, 2014; 2016; 2017; Lai and Zainal, 2014; 2015). Based on the scientific or positivistic paradigm, the quantitative research method is used in this study to explain these relationships, test the theory, describe the pattern, and measure the consumers’ intention to use (Cooper and Schindler, 2008). The research strategy uses the deductive process, going from generalizations (theory) leading to prediction (hypotheses), explanation, and understanding the consumers’ intention to use the novelty single platform E-payment. This research is explanatory whereby the research questions and hypotheses are poised to explain the phenomena under the investigation. The research strategy process used in this study is shown in Figure 1.
RESEARCH DESIGN
The research project to examine and attain answers to the proposed research questions guided through a plan is known as research design (Saunders, Lewis, & Thornhill, 2012). According to Cooper and Schindler (2008), the three types of research designs are exploratory, descriptive, and casual or explanatory. Neuman (2006) indicated that exploratory research involved an attempt to explore and generate new ideas and themes that provided the prerequisite for further research.
problems identified. The next stage the questionnaires design, pilot test, and data collection are being employed. After the data collection, the descriptive research design is being used for analysis in order to determine the mean, standard deviation, frequencies, and percentages as well as to explain the respondents’ characteristics of the factors used.
Target Population and Sample
The following section will explain the target population and sample with reference to the article consumers’ intention to use a single platform E-payment: A study among Malaysian Internet and Mobile banking users by Lai and Zainal (2015). The study involves surveying current users of Internet or/and mobile who use E-payment in Malaysia. Those who choose to use E-payment systems will be able to provide more realistic feedback on their personal experiences in regard to their intention to use the novelty single platform E-payment. Malaysian Internet users have reached 17.5 million with 5 million broadband users, 2.5 million wireless broadband users and 10 million 3G subscribers while Touch n Go has 10 million subscribers (Lai; 2014). The mobile phone subscribers (total of 3 major providers Maxis, Celcom - Axiata and Digi already more than 32 million) and bank card subscribers (e.g: 34 million for debit card based on Bank Negara report 2011) have already exceeded the number of population (28.3 million based on Malaysian Statistic report 2010) in Malaysia. Nevertheless, there are people owning more than one phone SIM as well as more than one bank cards. Bank Negara report 2011 released the figures for Internet banking subscribers (34.4% for Individual users in 2010 of the population) and mobile banking subscribers (3% Mobile penetration rate in 2010 against population). Figure 1. Research Strategy Process
The statistics did not take into account of foreigners in the country as the statistics only showed a number of subscribers. These figures show that there is high ownership of payment devices and banking E-payment subscribers that allow users to make E-payment, but the actual number of users of E-payment systems is not known. As such, this study falls under non-probability sampling; thus, purposive sampling was selected since the target users are those using the Internet or/and Mobile for E-payment for the last one year have to be identified.
Sample Size
By using the ratio of 10:1 as suggested by Kline (2011), the sample size will be taken from the total number of questionnaires used in the items. Therefore, targeting the minimum number of total questionnaires used in the items samples will fulfill these requirements. The sample size meets the requirements of the technique used to analyze the data and sample size based on Kline (2011). Therefore, using the ratio 10:1 and using nonprobability sampling, the minimum recommended sample size for the article consumers’ intention to use a single platform E-payment: A study among Malaysian Internet and Mobile banking users by Lai and Zainal (2015) are 440.
Unit of Analysis
Neuman (2006) noted that the type of unit the researcher used to measure the variables was indicated as a unit of analysis. This researcher seeks to investigate the factors that influence perceived ease of use and perceived usefulness of The novelty single platform E-payment system. Further, the researcher is interested to investigate the relationship between perceived ease of use, perceived usefulness and perceived risk with consumers’ intention to use one (1) single platform that integrates Card, Internet, and Mobile are known as “the novelty single platform E-payment”. Hence, the unit of analysis chosen for this study was the consumers who owned at least one (1) of the following items (e.g: mobile phone, card payment, internet) and used at least one time for the past 12 months through the survey method. This criterion was selected to identify the current users of the E-payment as respondents. Furthermore, this group will be the potential early adopter group of the novelty single platform E-payment.
Data Collection
Questionnaires
The most common method is the survey. The survey is a useful technique to capture facts, opinions, behaviours or attitudes from a range of respondents (Maylor and Blackmon, 2005). These are the preferred choice of research method for this project. Survey method is used to collect the data with the assistance of online research tools. According to Bryman and Bell (2007), the self-administered method has a better advantage than the Interview-self-administered in terms of convenience (time, cost and location for both interviewer and interviewee) and as it is less obstructive (absence of interviewer effects) to interviewees. Since there are a cost and time constraint in this study, a questionnaire survey was selected as the main empirical data collection method.
In this research, the researcher used the online questionnaire for standard electronic computation as discussed in research method choice. The novelty single platform E-payment market audience is the main target for online market research (Lai and Scheele, 2017). Therefore, an online research survey is chosen as the method for this research. The Internet can be accessed either through the mobile phone, the iPad and the PC/notebook as long as there is internet available. Thus, online research provides new opportunities for data collection of the targeted minimum number of respondents according to the number of questionnaires multiple by 10 that fulfill the requirements set. This method was chosen so that data collected is centralized and monitoring can be done any time for further action to respond to specific demographic requirements.
Online Research Survey
Electronic payment consumers are the target for the online research survey. Online research survey is selected because the consumers who use the internet or/and mobile are accessible online (Lai, 2006; 2007). To encourage responses to the online survey, besides utilizing e-mails blast techniques, Facebook posting and search engine optimization are used. In conventional paper and pencil surveys, one question might be asked if the respondent has used any payment system (card or Internet or Mobile) for the last one year. If the respondent answered “no,” to online payment, he or she is asked to skip online payment questions (e.g., going straight to question related to card payment instead of proceeding to Internet payment). If the respondent answered “yes” to Internet payment, he or she is instructed to go to the online payment question which, along with the next several ones, addresses issues related to the Internet payment experience.
Conditional branching allows the computer to skip directly to the appropriate question. If a respondent is asked the types of payment system he or she will consider, it is also possible to add payment system comparison questions to this list. For example, if the respondent considers using cash, card, Internet or mobile payment, it will be possible to ask the respondent questions about his or her view of the relative interest of each respective pair (e.g., in this case type of payment system, cash vs. card, card vs. Internet and card vs. Mobile). Online search data and page visit logs provide further valuable information for analysis of the company website page if this is deemed relevant for this research.
that depends on the respondent’s reading of a situation or product description. Therefore, online research questions should be straightforward and directly relevant to the research.
MEASUREMENT OF VARIABLES
Cox (1980) recommended that the scale points of five should be used depending on the particular environments. Therefore, in this research the five-point scale Likert-type of measuring the consumers’ intention to use the novelty single platform E-payment like “strongly disagree” to “strongly agree” were used. When responding to the survey items, participants specify their levels of agreement to a subject given. The five points scale is selected to encourage respondents to make positive or negative choices (Cooper, Schindler, and Sun 2008) in order to produce more emphatic information, avoiding what Oppenheim (1992) described as a lukewarm response. The following section will explain the measurement of variables with reference to the article consumers’ intention to use a single platform E-payment: A study among Malaysian Internet and Mobile banking users by Lai and Zainal (2015).
Design
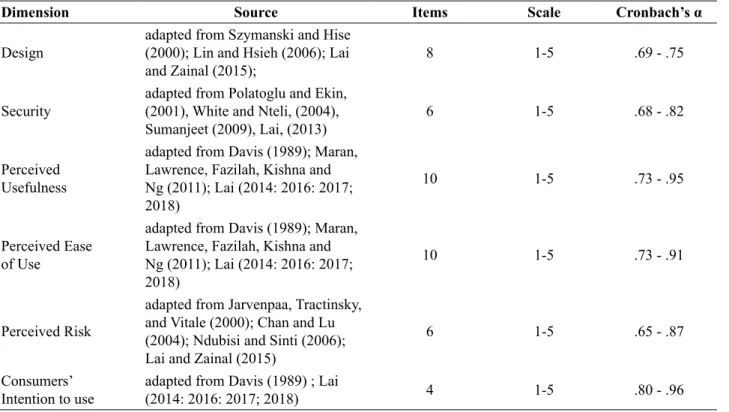
In this research, design was operationalized with the reference to the technical “design and functionality” of The novelty single platform E-payment novelty is in line with the adaptation to consumer’s capabilities of using the single The novelty single platform E-payment platform system for Card, Internet and Mobile Payment (Szymanski and Hise, 2000). In this study, the measurement of the novelty design of The novelty single platform E-payment in Table 1 is adapted from Szymanski and Hise (2000), Lin and Hsieh (2006) as well as Lai and Zainal (2015) using a five-point scale Likert.
Convenience
Convenience in this research was operationalized as the novelty single platform E-payment which is easy to use, accessible with multi-functions on the phone, and is in accessible places (Meuter et al., 2000). Convenience of the novelty single platform E-payment single platform E-payment system measurements were adapted from Szymanski and Hise (2000) and Lai (2010) referring to easy to use while accessible with multi-functions on the phone, and in reachable locations from Meuter, Ostrom, Roundtree, & Bitner (2000). A five-point scale Likert was used in the measurement of convenience in Table 1.
Perceived Usefulness
Perceived Usefulness was operationalized as the potential user’s subjective likelihood that the use of a certain system (e.g: The novelty single platform E-payment) will increase his/her performance (Davis, 1989; Lai (2014: 2016: 2017: 2018). Therefore, the measurement of perceived usefulness is adapted from Maran, Lawrence, Fazilah, Kishna, and Ng (2011), Lai (2014: 2016: 2017: 2018) and Davis (1989) using a 5-point Likert scale in Table 1.
Perceived Ease of Use
Table 1. Measurements Used in this Research
Dimension Source Items Scale Cronbach’s α
Design
adapted from Szymanski and Hise (2000); Lin and Hsieh (2006); Lai and Zainal (2015);
8 1-5 .69 - .75
Security
adapted from Polatoglu and Ekin, (2001), White and Nteli, (2004), Sumanjeet (2009), Lai, (2013)
6 1-5 .68 - .82
Perceived Usefulness
adapted from Davis (1989); Maran, Lawrence, Fazilah, Kishna and Ng (2011); Lai (2014: 2016: 2017; 2018)
10 1-5 .73 - .95
Perceived Ease of Use
adapted from Davis (1989); Maran, Lawrence, Fazilah, Kishna and Ng (2011); Lai (2014: 2016: 2017; 2018)
10 1-5 .73 - .91
Perceived Risk
adapted from Jarvenpaa, Tractinsky, and Vitale (2000); Chan and Lu (2004); Ndubisi and Sinti (2006); Lai and Zainal (2015)
6 1-5 .65 - .87
Consumers’ Intention to use
adapted from Davis (1989) ; Lai
(2014: 2016: 2017; 2018) 4 1-5 .80 - .96
(Davis, 1989; Lai (2014: 2016: 2017; 2018). Therefore, the measurement of perceived ease of use is adapted from Maran, Lawrence, Fazilah, Kishna and Ng (2011), Lai (2014: 2016: 2017: 2018) and Davis (1989) using a 5-point Likert scale in Table 1.
Perceived Risk
According to Chan and Lu (2004), perceived risk was operationalized as consumers perceived and their own tolerance of risk-taking that influences their financial transaction decision that is similar to (Jarvenpaa, Tractinsky, and Vitale, 2000; Lai and Zainal, 2015). In this study, a 5 point Likert scale of measurement the perceived risk in Table 1 is adapted from Jarvenpaa, Tractinsky, and Vitale (2000), Chan and Lu (2004), Ndubisi and Sinti (2006) and Lai and Zainal (2015).
Consumers’ Intention to use
DATA ANALYSIS
The measurement procedures and related operational definitions used to define the research methodology are directly dependent on the accuracy and quality of the data collected from the research. Marczyk, DeMatteo, and Festinger (2005) noted that reliability and validity are the most common and important psychometric concepts related to assessment-instrument selection and other measurement strategies. The data collected from the survey uses Structured Equation Modelling (SEM) for analysis.
The empirical data is analyzed using SPSS version 22 to obtain common descriptive statistics such as frequency and percentage to describe the demographic characteristics of the respondents. Cronbach’s Alpha is used to ensure that variables in each construct are internally consistent. Factor analyses are employed to validate the dimensions of independent variables and dependent variable. As usual, frequencies, percentages, maximum, minimum, means, standard deviations, and intercorrelations of the variables are also calculated.
Reliability
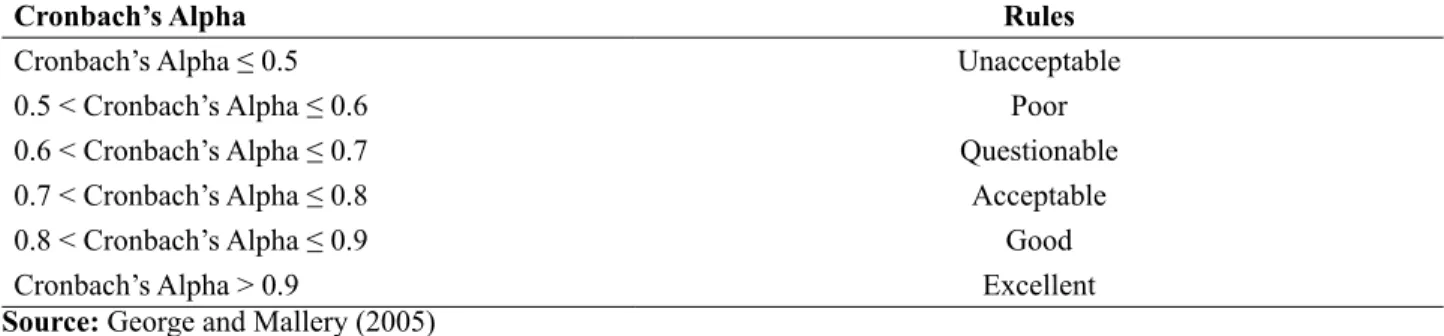
Yin (2002) expressed that reliability is the degree to which measures are considered free from random error. Reliability is concerned with the consistency or stability of the score obtained from a measure or assessment technique over time and across settings or conditions (Anastasi and Urbina, 1997; White and Saltz, 1957). Therefore, regarding the reliability concept for this research, and knowing the acceptance and generalization of Cronbach’s coefficient alpha (α), this research tried to address internal consistency by asking different related questions on the subject of every single dimension. Every effort should be made to ensure that data is collected, recorded, compiled, and analyzed accurately. According to Leary (2004), the data entry should be closely monitored and audits should be conducted on a regular basis for reliability. In this thesis, the researcher used the Cronbach’s Alpha value to assess the reliability of the questionnaire. The rule of assessment is according to George and Mallery (2005) in Table 2.
Table 2. Cronbach’s Alpha Rules
Cronbach’s Alpha Rules
Cronbach’s Alpha ≤ 0.5 Unacceptable
0.5 < Cronbach’s Alpha ≤ 0.6 Poor
0.6 < Cronbach’s Alpha ≤ 0.7 Questionable
0.7 < Cronbach’s Alpha ≤ 0.8 Acceptable
0.8 < Cronbach’s Alpha ≤ 0.9 Good
Cronbach’s Alpha > 0.9 Excellent
Source: George and Mallery (2005)
Validity
the operational construction of each actually measured what it was supposed to measure. In this study, construction validity and statistical validity are used as well. Statistical validity addresses the question of whether the statistical conclusions drawn from the results of a study are reasonable (Graziano and Raulin, 2004).
Mean and Standard Deviations
In this study, the statistical approach for determining equivalence between groups is to use simple analyses of means and standard deviations for the variables of interest for each group. Basically, mean is an average score, and a standard deviation is a measure of variability indicating the average amount that scores vary from the mean (Marczyk, DeMatteo and Festinger, 2005).
Pilot Study
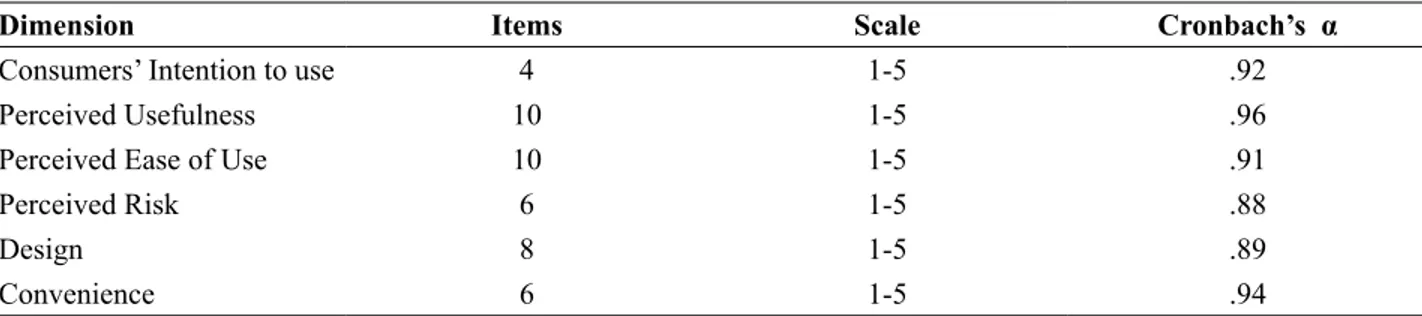
Participation by the respondents was purely voluntary. The 30 set of questionnaires designed for pilot study were distributed to academicians, students and relevant experts in the field of Information Communication Technology, Telecommunications and Finance before the final version being put online to collect the actual data. The academicians, students and relevant experts in the field of Information Communication Technology, Telecommunications and Finance were selected for the pilot study because they’re expected to represent the biggest group of participants in this the novelty single platform E-payment research survey. Information Communication Technology, Telecommunications, and Finance are selected because these groups were the target pioneer users. Respondents’ feedbacks of the questionnaires were straightforward and relevant.
The pilot study provided good feedback with high overall Cronbach’s alpha as shown in Table 3.
Table 3. Pilot Study Cronbach’s Alpha
Dimension Items Scale Cronbach’s α
Consumers’ Intention to use 4 1-5 .92
Perceived Usefulness 10 1-5 .96
Perceived Ease of Use 10 1-5 .91
Perceived Risk 6 1-5 .88
Design 8 1-5 .89
Convenience 6 1-5 .94
Descriptive Statistics
GOODNESS OF MEASURES
According to Mayers, Gamst, and Guarino (2006), the goodness of measures objective is to ascertain the factors or construct underlying the relatively set of variables. In this section, factor analysis was performed using SPSS version 22 to check the variables of each item of the questionnaires and each item that was correlated and related to each other was handled. A group of items is required to explain one variable as one item denotes only one part of the variable. Thus, this allows acceptable variables being used in this study analysis.
The factor analysis consists of two steps, namely extracting the items and rotating the items using the principal component factor analysis with varimax rotation. This process reveals the items that contribute to a factor that a frame of an element and rotation process refers to the interpretations that determine a simpler and more significant factor. As suggested by Kim and Mueller (1978), there should be at least three items for each construct with the minimum significant loading of ±.30 that indicates only 10% of the variance is accounted for by the factors, while ± .40 loading is more vital; at ± .50 the loading is more significant and above ± .70 explains 50% of the variances. As the rule of thumb suggested by Hair et al., 2006, the significant loading should be .50 or higher.
Kaiser-Meyer-Olkin (KMO) measure of sampling adequacy is an index used to examine the appropriateness of factor analysis that should be more than .50 in order to be acceptable according to (Hair et al., 2006). Bartlett’s test of sphericity is a test statistic used to examine the hypothesis that the variables are uncorrelated in the population. In other words, the population correlation matrix is an identity matrix; each variable correlates perfectly with itself (r = 1) but has no correlation with the other variables (r = 0) (Malhotra, 2009).
Correlation Analysis
The correlation design of this study has the ability to explain the relationship between a set of consumers behavior intention to use The novelty single platform E-payment factors. Vogt (2007) suggested that the correlation technique is helpful to determine if, and to what extent, a relationship exists between two variables. Furthermore, correlation analysis doesn’t need to have a control group and an experimental group to find causes and effects.
The Pearson Correlation Analysis is used to show the strength of the association between the variables involved. Inter-correlations coefficients (r) are calculated by means of Pearson’s Product Moment. A correlation coefficient has a value of -1 to +1. A zero value means that there is no relationship between the two variables. R of > 0.8 indicates a high correlation between the two variables (Sekaran, 2003).
Structural Equation Modeling (SEM)
This research is to generate an adapted model of Technology Acceptance that best described the consumers’ intention to use the novelty single platform E-payment in Malaysia. Therefore, Structural Equation Modeling is considered to be the most suitable as the produced model is expected to be a model that is both substantively meaningful and statistically well-fitting (Jöreskog, 1971; Bryne, 2006).
unmeasured concepts-factors with multiple variables) to estimate a series of interrelated dependence relationships simultaneously (Hair, Black, Babin, Anderson and Tatham, 2010; Schumacker and Lomax, 1996). In addition, SEM is also known as path analysis with latent variables and is now a regularly used method for representing dependency (arguably “causal”) relations in multivariate data in behavioral and social sciences (McDonald and Ho, 2002). Therefore, this study uses Structural Equation Modelling (SEM) because SEM can be used to analyze the theoretical model that consists of direct (and indirect) relationships between the independent variables and dependent variables.
Confirmatory Factor Analysis (CFA)
Raykov and Marcoulides (2006) noted that confirmatory factor analysis was potentially correlated with one another and had no specific directional relationships between the constructs. Confirmatory Factor analysis in this study was performed on the five independent variables - perceived usefulness, perceived ease of use, perceived risk, design, and convenience. The independent variables consisted of 40 items. Likewise, confirmatory factor analysis was conducted to check the dimensionality of the dependent variable (i.e. consumers’ intention to use the novelty single platform E-payment). Furthermore, the use of confirmatory factor analysis by SEM reduced errors each latent variable that had multiple indicators.
CFA will be verified using the Kaiser-Meyer-Olkin (KMO) Measure of Sampling Adequacy and Bartlett’s test of sphericity. The Kaiser-Meyer-Olkin (KMO) measure of sampling adequacy is an index used to examine the appropriateness of factor analysis. High values (between 0.5 and 1.0) indicate factor analysis is appropriate. Values below 0.5 imply that factor analysis may not be appropriate. Bartlett’s test of sphericity is a test statistic used to examine the hypothesis that the variables are uncorrelated in the population. In other words, the population correlation matrix is an identity matrix; each variable correlates perfectly with itself (r = 1) but has no correlation with the other variables (r = 0) (Malhotra, 2009).
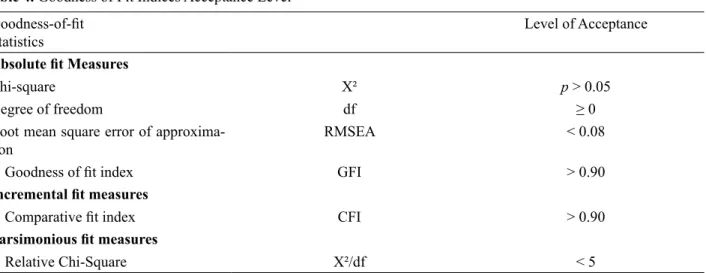
Goodness of Fit
Based on SEM, the overall fit model for the final measurement model was estimated to ensure a good data fit. The five absolute fit indices (Good-of-fit): χ² goodness-of-fit statistic, χ²/df,Goodness of Fit (GFI), Comparative Fit Index (CFI), Tucker-Lewis Index (TLI), and Standardized Root Mean Square Error of Approximation (RMSEA) will be assessed.
Table 4. Goodness of Fit Indices Acceptance Level Goodness-of-fit
Statistics
Level of Acceptance
Absolute fit Measures
Chi-square X² p > 0.05
Degree of freedom df ≥ 0
Root mean square error of approxima-tion
RMSEA < 0.08
Goodness of fit index GFI > 0.90
Incremental fit measures
Comparative fit index CFI > 0.90
Parsimonious fit measures
Relative Chi-Square X²/df < 5
Sources: Byrne (1998), McDonald and Ho (2002), Tabachnick and Fidell (2007), Hair (2010) and Kline (2011), Lai (2014: 2016: 2017; 2018)
Measurement and Structural Model
According to Anderson and Gerbing (1988), a two-step approach is suggested rather than a single-step approach in SEM. This research uses the two-step approach to SEM, namely a measurement model and a structural model (Hair, Black, Babin, and Anderson 2010). Firstly, the measurement models are evaluated to ensure that the items used to measure each of the constructs is adequate. The second step is the measurement model also involves conducting CFA to assess the contribution of each indicator variable and to measure the adequacy of the measurement model. This includes the validity of each item in each of the six (6) measurement model of design, convenience, perceived usefulness, perceived ease of use, perceived risk and consumers’ intention to use the novelty single platform E-payment. For example the measurement model of design has 8 items, if the factor loading of an item < .05, the item will be removed from the measurements model. This shall be applied to the rest of the measurement model. As for construct validity of each measurement model, Goodness of Fits in Table 4 will be referred.
Structural Model of the study is to represent the relationship among the variables in the theoretical framework. Structural Model will be developed after CFA and Goodness of fits. SEM will be used to identify the validity of the structural model of the study.
Construct Validity
Construct validity can be assessed by considering construct reliability, factor loadings, and variances extracted. As suggested by Hair et al., (2006), the factor loadings in the measurement model should be significant and .50 or higher, and ideally .70 or higher as the criteria for construct validity. The rational for the .70 or higher is that a loading of .71 squared equals .50 which means that the factor explains at least half of the variation in the item.
Where:
λ = standardized factor loading
n = the number of items
In the formula above the λ represents the standardized factor loading and i is the number of items. So, for n items, AVE is computed as the sum of the squared standardized factor loadings divided by the number of items, as shown above. A good rule of thumb is an AVE of .50 or higher indicates adequate convergent validity. An AVE of less than .50 indicates that on average, there is more error remaining in the items than there is variance explained by the latent factor structure you have imposed on the measure. An AVE estimate should be computed for each latent construct in a measurement model.
The measure of reliability and internal consistency of the measured variables representing a latent construct and the Construct Reliability (CR) should be ≥ .60 (Hair et al., 2010) to achieve convergent validity. The formula used to calculate the construct reliability value in a measurement model is as follow:
λ = standardized factor loading of every item;
The extent to which a construct is extremely distant from other construct is known as discriminant validity according to Hair et al., (2010). Thus, each measured items should only represent one latent construct. Therefore, the measurement model will be free from redundant items. CFA offers two methods to assess discriminant validity. The first method recommended by Bagozzi and Phillips (1982) involves a Chi-square difference analysis between a nested CFA model where the correlation between the two constructs is constrained. The second method was suggested by Bagozzi, Yi, and Phillips (1991) by examining the confidence interval for the estimated correlation between two constructs at the 95% confidence interval. Therefore, the discriminant validity is achieved when the correlation between any two constructs is significant from unity with the cut-off value of .90 according to Hair et al. (2010).
CONCLUSION
This article introduced the methodology and deliberated the details of research instrument development. This article also discussed the subjects, population, sample size requirement, data collection method and measurement of variables, pilot study and statistical techniques for data analysis. In this article also particular, focus on Structural Equation Modeling analysis. Figure 2 showed the overview of the research methodology using structural equation modeling analysis of the article Lai (2014: 2016: 2017; 2018) being conducted.
The section starts literature review to identify the gap in the literature and the problems that form the research questions, objectives, research model and hypothesis. Then, the initial questionnaire will
n
AVE
n
i i
∑
=
=
1 2be developed with revision in the questionnaire design section before the pilot study is done. A survey of 30 was done during the pilot study to check the reliability and validity analysis before the final questionnaire being distributed for the main study. The main study data collection will go through the test measurement mode (confirmatory factor analysis) and test structural model (Structural Equation Modeling) during the analysis process. Then, the results will be presented in the report with theoretical and management implications.
Figure 2. Overview of research Methodology (Lai, 2104)
The reviews will shed some light and potential applications for future researchers, students and others to conceptualize, operationalize and analyze the underlying research methodology to assist in the development of their research methodology.
REFERENCES
Avison, D. E., & Fitzgerald. G. (1995). Information systems development: methodologies, techniques, and tools. London: McGraw-Hill.
Anastasi, A., & Urbina, S. (1997). Psychological testing (7th ed.). Englewood Cliffs, NJ: Prentice Hall.
Anderson, J. C., & Gerbing, D. W. (1988). Structural Equation Modelling in practice: a review and recommended two-step approach. Psychological Bulletin, 103 (3), 411-423.
Byrne, B. M. (1998). Structural Equation Modeling with LISREL, PRELIS, and SIMPLIS: Basic Concepts, Applications, and Programming. New Jersey: Lawrence Erlbaum Associates.
Bryman, A., & Bell, E. (2007). Business Research Method, 2nd ed. Oxford: Oxford University Press.
Chan, S. C., & Lu T. M. (2004). Understanding Internet Banking Adoption and Use behaviour: A Hong Kong perspective. Journal of Global Information Management, 12, 3 12-43.
Churchill, G.A. (1979). A paradigm for developing better measures of marketing constructs. Journal of Marketing Research, 16, 64-73.
Cohen, P.N. (1998). Black concentration effects on black-white and gender inequality: Multilevel analysis for
US metropolitan areas. Social Forces, 77(1), 207–229.
Cooper, D. R., & Schindler, P. S. (2008). Business research methods (10th ed.). New York: McGraw-Hill. Crotty, M. (1998) The Foundations of Social Research : Meaning and Perspective in the Research Process,
London: Sage Publications.
Cox, E. P., (1980). The optimal number of response alternatives for a scale: A review. Journal of Marketing Research, 17, 407-422.
Davis, F. D. (1989) Perceived usefulness, perceived ease of use, and user acceptance of information technology. MIS Quarterly, 13(3), 319-340.
Davis, F. D., Bogozzi, R., P., & Warshaw, P., R. (1989). User acceptance of computer technology: A comparison of two theoretical models. Management Science, 35, 982-1003.
Digi Annual Report, 2011.
Emory, W C., & Cooper. D. R. (1991). Business Research Methods, 4th edition, Homewood, IL: Richard D. Irwin.
George, D. & Mallery, P. (2003). SPSS for Windows step by step: A simple guide and reference. 11.0 update (4th ed.). Boston: Allyn & Bacon.
Graziano, A. M., & Raulin, M. L. (2004). Research methods: A process of inquiry (5th ed.). Boston: Allyn & Bacon
Hair, J. F., Wolfinbarger, M., Ortinau, D. & Bush, R. (2008). Essentials of Marketing Research. New
York:McGraw Hill/Irwin.
Hair, J. F. (2010). Multivariate data analysis: a global perspective. Upper Saddle River, New Jersey, USA: Person Prentice Hall.
Hair, J., Black, W., Babin, B. Y. A., Anderson, R., & Tatham, R. (2010). Multivariate Data Analysis (7th ed.). New Jersey: Pearson Prentice Hall.
Harrison, R., Scheela, W, P C, Lai, Vivekarajah, S. Beyond institutional voids and the middle income trap?
The emerging business angel market in Malaysia, Asia Pacific Journal of Management. September 2017,
1-27
Hu, L., & Bentler, P. M. (1999). Cutoff criteria for fit indexes in covariance structure analysis: Conventional
criteria versus new alternatives. Structural Equation Modeling: A Multidisciplinary Journal, 6(1), 1-55 Jarvenpaa, S. L., Tractinsky, N., & Vitale, M. (2000). Consumer trust in an internet store. Information
Technology and Management, 1(1/2), 45-71.
Jöreskog, K. G. (1971) Simultaneous factor analysis in several populations, Psychometrika, 36, 409-26. Jöreskog, K. G. (1993). Testing structural equation models, In Byrne, B. M. (2006). Structural Equation
Kim, J. O., & Mueller, C. W., (1978). Introduction to factor analysis: What it is and how to do it. Beverly Hills, CA: Sage
Kline, R. B., (2011). Principles and practice of structural equation modelling (3rd ed.). New York: Guilford Press.
Krejcie, R., and Morgan, D. W., (1970). “Determining Sample size for Research Activities”. Educational and Psychological Measure, 30, 607-610.
Lai P. C (2006). The significant of E-business and knowledge-based Customer Relationship in the E-market
Place Environment. INTI Journal, 2 (1) 552-559.
Lai, P. C. (2007). The Chip Technology Management Implication in the Era of Globalization: Malaysian
Consumers’ Perspective, Asia Pacific Business Review, 3(1), 91-96
Lai P. C. (2010). E-business and E-banking. Japan Society for Software Science and Technology, Itech research group.
Lai P. C. (2012). E-Payment Systems Services. E-payment Banking. GlobalCLAS
Lai, P. C. (2014). Factors influencing Consumers’ intention to use single platform E-payment. UNITEN
Lai P. C. & Ahmad, Z. A. (2015). Perceived Enjoyment and Malaysian consumers’ intention to use a single platform E-payment. SHS Web o f Conferences, 18, EDP Sciences
Lai P. C. & Zainal A. A., (2015). Consumers’ Intention to Use a Single Platform E-Payment System: A Study Among Malaysian Internet and Mobile Banking Users. Journal of Internet Banking and Commerce. (20) (1) 1-13
Lai P. C. & Zainal A.A, (2015). Perceived Risk as an Extension to TAM Model: Consumers’ Intention To Use A Single Platform E-Payment. Australia Journal Basic and Applied Science, 9(2): 323-330. Lai, P. C. (2016) Design and Security impact on consumers’ intention to use single platform E-payment,
Interdisciplinary Information Sciences, 22 (1), 111-122
Lai, P. C. (2017). The literature review of technology adoption models and theories for the novelty technology. Journal of Information Systems and Technology Management, 14 (1), Jan/Apr., 21-38 Lai P C, Scheela, W, Convergence of technology in the E-commerce World and Venture Capital Landscape:
South East Asia, Global Entrepreneurship and New Venture Creation in the Sharing Economy. IGI-Global, 2018, 149-168
Lai, P. C. (2018), Single platform E-payment Consumers’ intention to use. Journal of Information Technology Management. 29 (2), 22-28
Lai, P. C. (2018), Security as an extension to TAM Model: Consumers’ intention to use a single platform
E-payment System. Asia Pacific Journal of Management Research and Innovation 13 (3-4), 110-119
Lai P C. (2018) Research, Innovation and Development Strategic Planning for Intellectual Property Management. Economic Alternatives 12 (3), 303-310
Laukkanen, T., & Lauronen, J. (2005). “Consumer value creation in mobile banking services”. International Journal of Mobile Communications, 3 (4), 325 – 338.
Leary, M. R. (2004). Introduction to behavioral research methods. Boston: Allyn & Bacon
Lin, J. and Hsieh, P., (2006). The role of technology readiness in customers’ perception and adoption of self-service technologies, International Journal of Service Industry Management, 17, 497-517
Marczyk G., DeMatteo D., & Festinger D. (2005). Essentials of Research Design and Methodology, John Wiley & Sons, Inc.
Malaysia, The 2010 Population and Housing Census of Malaysia (Census 2010)
Malhotra, N. (2009). Marketing Research: An Applied Orientation with SPSS (6ed). Pearson Education. Maran, M., Lawrence, A., M. Fazilah, A. S., M. Kishna, M., and Ng, K. K. (2011) ‘‘Cashless Society and the
determinants: An empirical Investigation,’’ International Journal of Academic Research, 3(3), 674–682. Maxis Annual report, 2011.
Maylor, H., & Blackmon, K. (2005). Researching Business and Management. New York: Palgrave Macmillan.
McDonald, R. P., & Ho, M-H, R. (2002). Principles and Practice in Reporting Structural Equation Analyses. Psychological Methods, 7(1), 64-82.
Meyers, L. S., Gamst, G., & Guarino, A. J. (2006). Applied multivariate research. Sage publications: London.
Meuter, M. L., Ostrom, A. L., Roundtree, R. I., & Bitner, M. J. (2000). Self-service technologies:
Understanding customer satisfaction with technology-based service encounters. Journal of Marketing, 64(3), 50-65.
Miller, D. (1983). Handbook of Research Design and Social Measurement, 4th ed. London: Longman. Neuman, W. (2006). Social research methods: Qualitative and quantitative approaches (6th ed.). Needham
Heights, MA: Allyn & Bacon.
Ndubisi, N.O. and Sinti, Q., (2006). Consumer attitudes, system’s characteristics and internet banking adoption in Malaysia. Management Research News, 29 (1/2), 16-27.
Oppenheim, A.N., (1992). Questionnaire design, interviewing and attitude measurement. 2nd ed. London and New York: Continuum International Publishing.
Harrison, R., Scheele, W., Lai, P. C., Vivekarajah S, (2017). Beyond institutional voids and the
middle-income trap: The emerging business angel market in Malaysia. Asia Pacific Journal of Management, 1-27 Raykov, T., & Marcoulides, G. A. (2006). Estimation of Generalizability Coefficients via a Structural
Equation Modeling Approach to Scale Reliability Evaluation, International Journal of Testing (6), 81-95. Saunders, M., Lewis, P. & Thornhill, A. (2016). Research methods for business students. 7th Edition, Pearson
Education Ltd.
Schumacher, R. E., & Lomax, R. G. (1996). A Beginner’s Guide to Structural Equation Modeling. New Jersey: Lawrence Erlbaum Associates, Publishers
Sekaran, U. (2003), Research Methods for Business. 4th ed. U. S. A.: John Wiley and Sons, Inc
Sekaran, U. & Bougie, R. (2013), Research Methods for Business: A Skill-Building Approach. 7th ed. U. S. A.: John Wiley and Sons, Inc.
Szymanski, D.M., & Hise, R.T. (2000). E-satisfaction: An initial examination. Journal of Retailing, 76(3), 309–322.
Tabachnick, B. G., & Fidell, L. S. (2007). Using Multivariate Statistics. Boston: Pearson Education Inc. Vogt, W. P. (2007). Quantitative research methods for professionals. Boston, MA: Pearson Education. White, B. W., & Saltz, E. (1957). Measurement of reproducibility. Psychological Bulletin, 54, p. 81–99. Wortley, D. J., Lai, P. C., (2017) The Impact of Disruptive Enabling Technologies on Creative Education, 3rd
International Conference on Creative Education, Mar 3-4