em melhoramento animal.] O Brasil possui diversidade edafoclimática e realidades socioeconômicas e políticas distintas. Isto contribui para diferenciar as regiões polí-tico administrativas do país. Objetivou-se espacializar os fatores ísicos, climáticos e socioeconômicos que melhor discriminam a produção de caprinos leiteiros no Brasil. Fo-ram analisados índice de produção de leite por cabra; ín-dice de produção de caprinos; ínín-dice de produção de leite, amplitude da temperatura; temperatura média; precipita-ção; índice normalizado de diferença vegetativa; umidade relativa do ar; altitude; estabelecimentos agropecuários; estabelecimentos com pastagem nativa; estabelecimentos com pastagens de boa qualidade; estabelecimentos com re-cursos hídricos; estabelecimentos que recebem orientação técnica; estabelecimentos de agricultura familiar; estabele-cimentos de agricultura não familiar e índice de desenvol-vimento humano. Foram realizadas análises multivariadas
Spatialization of climate, physical and socioeconomic factors
that affect the dairy goat production in Brazil and their impact
on animal breeding decisions
1Fernando B. Lopes2*, Marcelo C. da Silva2, Eliane S. Miyagi2, Maria C.S. Fioravanti2,
Olivardo Facó3, Renato F. Guimarães4, Osmar A. de C. Júnior4 and Concepta M. McManus4,5
ABSTRACT.- Lopes F.B., Silva M.C., Miyagi E.S., Fioravanti M.C.S., Facó O., Guimarães R.F., Jú-nior O.A.C. & McManus C.M. 2012. Spatialization of climate, physical and socioeconomic factors that affect the dairy goat production in Brazil and their impact on animal bree-ding decisions. Pesquisa Veterinária Brasileira 32(11):1073-1811. Programa de Pós-Gradua-ção em Ciência Animal, Escola de Veterinária de Zootecnia, Campus II Samambaia, Cx. Postal 131, Goiânia, GO 74001-970, Brazil. E-mail: [email protected]
Brazil has high climate, soil and environmental diversity, as well as distinct socioecono-mic and political realities, what results in differences among the political administrative re-gions of the country. The objective of this study was to determine spatial distribution of the physical, climatic and socioeconomic aspects that best characterize the production of dairy goats in Brazil. Production indices of milk per goat, goat production, milk production, as well as temperature range, mean temperature, precipitation, normalized difference vegetation index, relative humidity, altitude, agricultural farms; farms with native pasture, farms with good quality pasture, farms with water resources, farms that receive technical guidance, fa-mily farming properties, non-familiar farms and the human development index were evalu-ated. The multivariate analyses were carried out to spatialize climatic, physical and socioe-conomic variables and so differenciate the Brazilian States and Regions. The highest yields of milk and goat production were observed in the Northeast. The Southeast Region had the second highest production of milk, followed by the South, Midwest and North. Multivariate analysis revealed distinctions between clusters of political-administrative regions of Brazil. The climatic variables were most important to discriminate between regions of Brazil. There-fore, it is necessary to implement animal breeding programs to meet the needs of each region.
INDEX TERM: Spatialization, animal breeding program, cluster, milk, multivariate analysis.
1 Received on March 13, 2012.
Accepted for publication on May 16, 2012.
2 Programa de Pós-Graduação em Ciência Animal (PPGCA), Escola de Ve-terinária de Zootecnia, Campus II Samambaia, Cx. Postal 131, Goiânia, GO 74001-970, Brazil. *Corresponding author: [email protected]. Other au-thors: [email protected], [email protected], [email protected]
3 Embrapa Caprinos e Ovinos, Fazenda Três Lagoas, Estrada Sobral Groaíras, Km 4, Cx. Postal 145, Sobral, CE 62010-970, Brazil. E-mail: [email protected]
4 LSIE, Departamento de Geograia, Universidade de Brasília, Brasília, DF 70910-900, Brazil. E-mails: [email protected], [email protected]
5 Departamento de Zootecnia, Universidade Federal do Rio Grande do Sul (UFRGS), Av. Bento Gonçalves 7712, Porto Alegre, RS 91540-000, Bra-zil. E-mail: [email protected]
para espacializar as variáveis climáticas, ísicas e socioeco-nômicas e, assim, discriminar os Estados e Regiões brasilei-ras. As maiores produções de caprinos e de leite foram ob-servadas na região Nordeste. A região Sudeste apresentou segunda maior produção de leite, seguido pelo Sul, Centro--Oeste e Norte. As médias para produtividade mostraram que as regiões Centro-Oeste e Sudeste apresentaram ani-mais ani-mais especializados a produção de leite. As análises multivariadas evidenciaram distinções entre clusters das regiões político-administrativas do Brasil. As variáveis cli-máticas foram as mais importantes para discriminar entre as regiões brasileiras. A heterogeneidade dos componentes climáticos, ísicos e socioeconômicos evidenciou peculia-ridades em cada região. Portanto, é preciso implementar programas de melhoramento genético animal que atendam as necessidades de cada região.
TERMOS DE INDEXAÇÃO: Espacialização, análises multivariadas, cluster, leite, programa de melhoramento animal.
INTRODUCTION
In Brazil, the goat population was estimated at over 9.3 million head, of which more than 91% is in the Northeast region (IBGE 2008). Goat production is also of interest in other regions, notably in the Southeast. Goat farming in Brazil is mainly for the production of milk and most of the breeds, especially those in the Northeast, are for this pur-pose, with meat obtained from the culling of adult animals (Costa et al. 2008, McManus et al. 2008, Oliveira et al. 2009).
Most herds in northeastern Brazil are reared extensi-vely. In southeastern Brazil, the animals are raised mostly in coninement (Gonçalves et al. 2001, 2008, Barros et al. 2005). Goat production is inluenced by factors such as local vegetation (Skonhoft et al. 2010), average air tem-perature (McManus et al. 2010) and altitude (Campbell et al. 2010). These factors inluence the implementation and creation of production units because of their inluence on production characteristics and adaptation of animals used (Joost et al. 2010).
The successful production of small ruminants also de-pends on socioeconomic factors, because the higher the population, gross domestic product and the area, greater the demand for animal products and production also incre-ases in adjacent areas (Hewitson et al. 2007, Sibbald et al. 2008).
Farmers, in general, try to minimize the impact of exter-nal factors that negatively affect animal production. These include various environmental (soil and climate, vegeta-tion and geomorphology), socioeconomic (gross domestic product and population) and technological (ownership of knowledge about information such as feeding, handling, reproduction, health and sanitation) factors (Herrero et al. 2010). Factors affecting production and productivity of goats in the Northeast may not be the same characteristics that inluence these in the South and Southeast. Brazil has a land area of continental dimensions, as well as wide varie-ty of climate and soil and vegetative diversivarie-ty. Agricultural systems in different regions of the country have peculiari-ties that differentiate them from each other. Thus, the aim
of this study was to analyze the spatial distribution of the production of dairy goats in Brazil in relation to physical, climate and socioeconomic factors.
MATERIALS AND METHODS
Analyses were performed using individual climate, physical and socioeconomic data from 5,564 Brazilian municipalities (Fig.1). Study variables were obtained by the Brazilian Institute of Geo-graphy and Statistics, National Institute of Meteorology, National Institute for Space Research, United States Geological Survey and the United Nations Program for Development.
All analyses were performed using the computer program Sta-tistical Analysis System (SAS ®). Multivariate regression analysis (PROCREG -stepwise) were performed to create three indices (IGP, IMP and PIM) that best describe the municipalities based on the variables related to the actual goats, the volume of milk productivity and gross domestic product (GDP), the area and po-pulation.
IGP = β1 x CA + β2 x CA2 + β
3 x CP + β4 x CP 2 + β
5 x CH + β6 x CH 2
IMP = β1 x LA + β2 x LA2 + β
3 x LP + β4 x LP 2 + β
5 x LH + β6 x LH 2
PIM = β1 x PA + β2 x PA2 + β
3 x PP + β4 x PP 2 + β
5 x PH + β6 x PH 2
where the IGP is index of goat production, IMP is the rate of milk production; PIM is the productivity index of milk/doe; β is the estimator of the parameters analyzed, CA is the ratio of goats per area, CP is goats by the ratio of GDP (Gross Domestic Product), CH is the ratio of goats per inhabitant, LA is the ratio of milk pro-duction per area, LP is the ratio of milk propro-duction per GDP, LH is the ratio of milk production per capita, PA is the ratio of milk productivity per area; PP is the ratio of milk productivity per GDP, and PH is the ratio of dairy products per head of population.
Variables used in the analysis on a municipality basis were: index of goat production (IGP), index of milk production (IMP), productivity index of milk/goat (PIM), temperature range (TR),
average temperature (AT), precipitation (PR), normalized diffe-rence vegetation index (NDVI), relative humidity (RH), altitude (AL), farms per area (FA), farms with native pasture (FNP ), far-ms with good pastures (FGP); farfar-ms with water resources (FWR), farms that receive technical advice (FTA), family farms (FF), non--family farms (NFF) and human development index (HDI). The va-riables were standardized by the STANDARD procedure of SAS®, assuming a mean of zero (0) and variance one (1).
Analyses of variance were performed using the GLM procedu-re. The sources of variation were the Brazilian States and Regions. The means were adjusted by least squares method (LSMEANS) and compared using the Tukey test (p<0.05).
To better understand the correlation structure and try to understand the sources of variation in the data analysis a factor analysis (PROC FACTOR) was performed. In this analysis, the as-sumption of orthogonality criterion was tested by Kaiser-Meyer--Olkin statistic (Kaiser, 1970). To best explain the variance of each factor, we used the option SMC (Squared Multiple Correlations), i.e., the square of the multiple correlations of each variable with the other variables was used as a prior estimate of the commona-lities. We used a screen test to establish the minimum number of factors to be considered.
Canonical correlation analysis was performed to summarize the variation between classes (CANCORR). Discriminatory power of variables in differentiating regions and units of the federation was deined by a discriminant analysis (DISCRIM) (Lachenbru-ch1997). To determine the subsets of variables used in the quan-titative discrimination of the Brazilian regions, the procedure STEPDISC (p<0.10) was used.
To organize the information about the regions and states, so that similar groups were formed, we used the procedures CLUSTER and CANDISC. The method adopted for the deinition of clusters was the minimum variance method (Ward’s method). In this method, the intra-group variance is calculated for all possible clusters, choosing the arrangement that provides the smallest variance. The graphics were created using the procedures GPLOT, GMAP and TREE.
RESULTS
Brazil is a country of continental proportions. It has speciic climate, physical, and socioeconomic differences by region.
This is clear when looking at the ranges for the variables under study, especially area, GDP and population (Table 1). Thus, multivariate regression analyses were necessary to adjust the total goat milk produced and goat milk producti-vity (l/doe/year) by GDP, area and number of inhabitants. All data is on a municipality basis. The indices for produc-tion of goat milk and yield (IGP, IMP and PIM) were respec-tively:
IGP = -130.007 + CAx468.673 + CPx154 - CP²x1143.806 + CHx2153.789 - CH²x7.437;
IMP = -903.785 + LAx379.677 - LA²x0.378 + LPx473 - LP²x246.487 - LHx966.266;
PIM= 2.36029 + PAx70.50967 + PPx17113 + PP²x1.43355 + PHx1062.44162.
Production spatialization
The Northeast region had a higher average effective number of animals and milk productions (p<0.05) than the other regions (Fig.2). Although large differences were seen for the North, Midwest, South and Southeast regions, there were no statistically signiicant differences (p>0.05), pro-bably due to large variations. For productivity, the Southe-ast Region had higher mean estimate to the other regions (Table 2). Breeding programs are usually based on impro-vements in productivity (Blackburn et al. 1998). Thus, it assumes that in regions such as South and Southeast would be a better base to start a breeding program for goats in Brazil.
About 91% of Brazil’s goats are raised in the Northe-ast. However, these animals have low production levels, with around 66% of all milk produced. On the other hand, in the Southeast, which has about 3% of the goat, the herd milk production is around 25% of the national total. This demonstrates both the use of more specialized animals for milk production, as well as higher input farming systems (intensive). In the Northeast, there was predominance of Table 1. Municipal statistical data for the climate, physical and socioeconomic variables
related to goat production in Brazil
Variable Mean Standard deviation Minimum Maximum
Area (km2) 1,544.31 5,717.00 2.85 160,755.00
GDP (R$/year) 545,001.50 5,817,536.67 6,492.19 357,116,681.00 Population 34,083.15 200,479.18 834.00 10,990,249.00 Number of goats 1,272.86 6,441.27 0.00 188,854.00 Milk volume per year (l) 5,458.70 50,895.71 0.00 2,381,685.00 Productivity (l/doe/year) 9.79 85.55 0.00 5,475.00
Temperature amplitude (oC) 9.38 1.48 4.36 13.41
Temperature Mean (oC) 27.71 3.45 22.00 36.00
Precipitation (mm/year) 1,437.84 371.02 353.17 3370.26
Relative humidity (%) 60.19 11.56 20.37 98.91
Altitude (m above sea level) 568.40 315.46 1.36 2091.10
NDVI 0.24 0.30 -0.47 0.96
Farms per area 0.04 0.07 0.00 3.06
Farms with native pasture 0.09 0.13 0.00 3.23
Farms with good pastures 0.09 0.22 0.00 9.23
Farms with water resources 0.79 1.16 0.00 33.33
Farms that receive technical advice 13.57 39.88 0.00 1587.00
Family Farms 0.09 0.13 0.00 4.48
Non-family farms 0.01 0.02 0.00 1.21
Human development index 0.70 0.08 0.47 0.92
semi-intensive and, in most cases, with less specialized ani-mals for milk production.
For the Midwest, the states of Goiás and Mato Grosso do Sul were more specialized in milk production, while Mato Grosso has dual purpose animals (dairy and meat). In the North, the states of Acre, Amazonas, Roraima and Amapá had no effective production of goat milk. Possibly, these ani-mals are raised for meat production. In the states of Para,
Rondônia and Tocantins the animals are dual purpose. The low productivity of these states may be related to the lack of speciic technical information, with a low number of ani-mals in commercial production, among others.
Productive and environmental descriptors
Three factors were needed to explain 97% of the varian-ce (Table 3). The Adequacy of the database for this analysis
Fig.2. (A) Herd size (number of goats). (B)Total milk production. (C) Production of milk per doe (l/doe) by States.
Table 2. Average for the production of goat milk and municipal productivity adjusted by the method of least squares between the states (UF) within each region and between the Midwest (CO), North (N), Northeast (NE), South (S) and Southeast (SE)
Region UF Number Means Milk Means Productivity Means of goats between production between (milk/doe/year) between
states (l) states states
CO GO 88.23B 188.43B 2,701.56A 1,168.56B 4.45A 1.98BC
MS 261.99A 706.85A 1.03A
MT 204.85A 97.45A 0.43A
N AC 331.73ABC 274.55B - 80.57B - 0.31C
AM 239.19BC - -
AP 78.19C - -
PA 526.62A 290.36A 0.31A
RO 207.98BC 233.37A 1.73A
RR 380.80AB - -
TO 157.33BC 40.29A 0.09A
NE AL 332.44C 2,997.10A 3676.99B 11,373.62A 15.99AB 9.18ABC BA 5,129.46A 27,890.71A 5.51CD
CE 4,069.92AB 9717.11AB 10.35BC
MA 1,396.87C 647.64B 1.42D
PB 2,067.85BC 19,507.55AB 11.81ABC PE 5,605.44A 15,444.67AB 17.98A PI 6,535.09A 10,251.09AB 1.24D RN 1,636.47BC 13,700.72AB 11.59ABC
SE 200.37C 1526.07B 6.70CD
S PR 310.24A 212.64B 521.31A 816.52B 3.04B 12.05AB
RS 191.72B 654.84A 5.00AB
SC 135.98B 1,273.42A 28.10A
SE ES 131.49AB 114.20B 1,653.53B 3,429.90B 12.19B 21.39A
MG 87.07BC 1,648.17B 18.61B
RJ 167.59A 8,875.57A 46.73A
SP 70.68C 1,542.34B 8.01B
was represented by the value of Kaiser-Meyer-Olkin (KMO) (0.72). This conirms the assumption of orthogonality, i.e., all factors help in understanding the variance because they are independent of each other. The correlation matrix pre-sented nonsingular estimates.
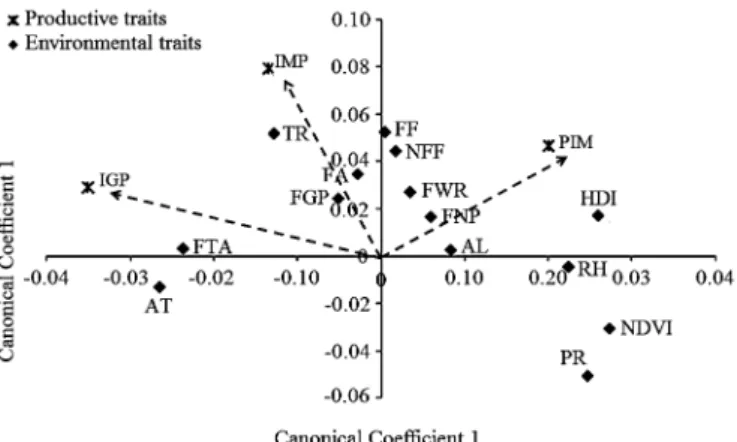
The irst two eigenvectors (Fig.3) showed clear groupin-gs of the relationships between the variables measured, and it was possible to group into three fairly distinct groups, the variables that had a closer relationship: i) Huma n Develo-pment Index, precipitation, relative humidity, altitude and normalized difference vegetative index; ii) farms per area, farms with native pasture, farms with good pastures, pro-ductivity index of milk/goat, farms with water resources, family farms and non-family farms; iii) farms that receive technical advice, temperature range, index of goat produc-tion, index of milk producproduc-tion, average temperature.
Production of goats showed a higher correlation with average temperature and farms that receive technical ad-vice, and negatively correlated with relative humidity, pre-cipitation, normalized difference vegetation index, altitude and Human Development Index. Milk production was posi-tively related to temperature range, farms with good pastu-res and farms per area. Productivity index of milk per goat showed a higher correlation with Human Development In-dex (Fig.4).
Regional discriminants
All political administrative regions of Brazil were well
discriminated through analyzing the production, climate, physical and socioeconomic variables (Table 4). For the North and Northeast, the factors studied discriminated well these regions, i.e., no confounding with other regions. Only 2.03% of the municipalities in the Midwest were in-correctly allocated to the South. The Southern region sho-wed discriminatory power of 80.40%, with almost 20 per-cent of confounding with the Southeast Region. The latter presented was well discriminated (96.58%), with low con-founding with the Midwest and South, with percentages of 1.56 and 1.86%, respectively.
The results of discriminant analysis (stepdisc) showed that the sources of climate variability (range of tempera-ture, average temperatempera-ture, precipitation, humidity, altitude and normalized difference vegetation index) were more im-portant in explaining the causes variation between regions (p<0.05). The human development index was essential to discriminate both the Northeast region from the Midwest, South and Southeast, the South and the North and South (p<0.8). Other factors discriminate the regions below 10% signiicance (Table 5).
Regional groupings
The distances between clusters (Ward’s Minimum-Va-riance Method) for the Federative Units (FU) were effective Table 3. Common factors, percentage of variance explained
by each factor and cumulative variance Factor Eigenvalue Explained Accumulated
variance (%) variance (%)
1 2.61 0.45 0.45
2 2.03 0.35 0.81
3 0.96 0.16 0.97
Table 4. Success of discriminate analysis for political administrative regions of Brazil
Region CO N NE S SE Total of cities
CO 97.97 0 0 2.03 0 443
N 0 100 0 0 0 448
NE 0 0 100 0 0 1784
S 0.26 0 0 80.40 19.34 1157
SE 1.56 0 0 1.86 96.58 1665
Error 0.0203 0 0 0.196 0.0342 0.0501 CO = Midwest, N =North, NE =Northeast; S =South, SE =Southeast. Fig.4.Canonical correlation between the production of goat
meat and milk and the physical, environmental and socio-economic variables. IGP = Index of goat production; IMP = Index of milk production; PIM = Productivity index of milk/ goat; TR = Temperature range; AT = Average temperature; PR = Precipitation; NDVI = Normalized difference vegetative index; RH = relative humidity; AL = altitude; FA = Farms per area; FNP = Farms with native pasture; FGP = Farms with good pastures; FWR = Farms with water resources; FTA = Farms that receive technical advice; FF = Family farms; NFF = Non--family farms; HDI = Human Development Index.
in grouping the States within their respective regions. Thus, it was possible to group the states in four distinct groups: I) Espirito Santo, Rio de Janeiro, Rio Grande do Norte, Goiás, Mato Grosso and Mato Grosso do Sul; II) Minas Gerais, São Paulo, Paraná, Rio Grande do Sul and Santa Catarina; III) Acre, Amapá, Rondônia, Roraima, Amazonas, Pará and To-cantins, and IV) Alagoas, Sergipe, Maranhão, Bahia, Ceará, Piauí, Paraíba and Pernambuco. Group IV is the group more differentiated, compared to other groups, as is represented by the federal units in the Northeast, which produced more goats (Fig.5).
Due to the low production of milk and goats in the Nor-thern region, this was removed from the canonical
analy-Fig.5. Dendogram of the distances between states (UF) and Brazilian regions. CO =Midwest, N = North, NE =Northeast, S = South, SE =Southeast; ES = Espirito Santo; RJ = Rio de Janei-ro; RN = Rio Grande do Norte; GO = Goiás; MT = Mato Grosso; MS = Mato Grosso do Sul; MG = Minas Gerais: SP =São Paulo; PR =Paraná; RS = Rio Grande do Sul; SC = Santa Catarina; AC = Acre; AP =Amapá; RO =Rondônia; RR = Roraima; AM = Amazo-nas; PA = Para; TO = Tocantins. AL = Alagoas; SE = Sergipe; MA =Maranhão; BA = Bahia; CE = Ceara; PI =Piauí; EGP =Paraíba; PE = Pernambuco.
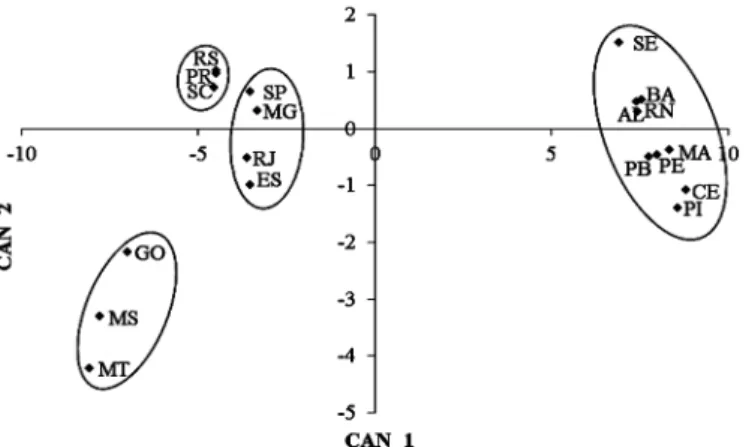
Fig.6. Graphical representation of the canonical discriminant analysis of the states within the regions of Brazil. ES = Es-pirito Santo; RJ = Rio de Janeiro; RN = Rio Grande do Norte; GO =Goiás; MT = Mato Grosso; MS = Mato Grosso do Sul; MG = Minas Gerais; SP =São Paulo; PR =Paraná; RS = Rio Grande do Sul; SC = Santa Catarina; AL = Alagoas; SE = Sergipe; MA =Maranhão; BA = Bahia; CE = Ceara; PI =Piauí; PB =Paraíba; PE = Pernambuco.
Fig.7. Graphical representation of means of canonical varia-bles and regions.CO = Midwest, N = North, NE = Northeast, S: =South, SE = Southeast; IGP = Index of goat production; IMP = Index of milk production; PIM = Productivity index of milk/ goat; TR = Temperature range; AT = Average temperature; PR = Precipitation; NDVI = Normalized difference vegetative index; RH = relative humidity; AL = altitude; FA = Farms per area; FNP = Farms with native pasture; FGP = Farms with good pastures; FWR = Farms with water resources; FTA = Farms that receive technical advice; FF = Family farms; NFF = Non--family farms; HDI = Human Development Index.
Table 5.Variablesdiscriminate between the Brazilian regions
Region N NE S SE
CO PIM IGP IMP PIM IMP TR PIM IGP TR AT PIM IGP TR AT TR AT PR AL AT PR FWR AL PR FWR AL PR FWR INDV INDV FF NFF INDV FNP FWR INDV FA FGP FNP FGP FWR
HDI FWR FTA NFF FF
HDI
N IGP TR AT FWR PIM IGP TR AT PIM IGP TR AT AL FWR AG PR AL INDV FF PR FWR AL
HDI INDV FGP
NE PIM IMP TR PIM IMP TR AT
AT PR FWR AL PR AL INDV INDV FF HDI FWR FF HDI
S PIM IGP IMP TR
AT PR INDV FNP FGP FTA NFF
HDI
sis. These discrepancies for the North are also justiied by the small number of municipalities and population per unit area, and present the largest municipal territorial ex-tensions. Canonical components showed that the Midwest region showed the greatest variation among the federating units, followed by the Northeast and Southeast and South (Fig.6).
The canonical average for both regions and for the stu-dy variables showed distinction between all regions. For the Northeast region factors related to average high tem-perature were more important, while in the Midwest there was a higher temperature range, which indicates greater temperature changes throughout the year. The South and Southeast were more similar, being more related to human development index, precipitation and the normalized diffe-rence vegetation index (Fig.7).
DISCUSSION
Univariate approach
All components of climate, physical and socio-economic estimates were highly variable. Therefore, the indices (PIG, IMP and IGP) determined by means of multivariate regres-sion were important, especially in economic terms, as re-gions with higher GDP and a larger number of people tend to demand more products of animal origin (Sibbald al et al. 2008).
As most dairy goats were in the Northeast of the coun-try, this also has the largest goat milk production (Fig.2). However, higher productivity per doe was seen in the Sou-theast, probably due to the use of specialized dairy herds, reared in intensive systems while the Northeast has dual purpose animals, raised in extensive and semi-intensive systems (Gonçalves et al. 2008, McManus et al. 2008, Oli-veira et al. 2009).
All regions showed distinct productions. These are re-lated to both the genetic component and climate, physical and socioeconomic variables, intrinsic to each region. The-se differences are attributed not only to the breeds uThe-sed, but also the use of biotechnologies, the technical advisory services, the level of information farmers receive, and ma-rket demand.
Although the Northeast region shows high yields of milk in some states, most animals are dual purpose. It must be remembered that each municipality has a different area that may affect the igures. To the South, the state of Paraná had the highest effective number of goats (dual purpose), but the state of Santa Catarina is more specialized in ani-mals for milk production.
The highly variable productions of goat milk and pro-ductivity also arise from the distinctions between the ob-jectives of selection, and shape important aspects to be considered. When the animal breeding programs are de-signed without the selection objectives are in line with the characteristics of each region and also to the needs of the farmers in each region, these programs tend to have limited results (Kosgey et al. 2006).
These results are an indication that the selection objec-tive for the Southeast should be milk productivity, conir-ming results obtained by Blackburn et al. (1998) and
Mc-Manus et al. (2011), who showed that breeding programs are usually created by taking into account the levels of pro-duction, breeding systems and proitability.
Multivariate approach
Three distinct groups were formed in the factor analy-sis: i) variables related to the physical components (FNP, FA, NFF, FF, FWT, FGP and PIM), ii) climatic variables (AT and TR), milk production and technical guidance, and, iii) other climate variables (RH, AL, PR and NDVI) and a socioe-conomic component, represented by the municipal human development index (HDI).
A positive relationship was found between number of animals, milk production, technical guidance, range of tem-perature and average temtem-perature. Areas with native pas-tures are more related to farms with water, which in turn are more related to production of goat milk. The produc-tion of goat milk is more related to variable temperatures and average temperature range, respectively. The producti-vity of goat´s milk was found to be more closely related to relative humidity, precipitation, NDVI, altitude and human development index (Fig.3).
The productivity of goat milk (PIM) showed a positi-ve correlation with RH, NDVI and PR. This variable also showed high correlation with HDI (Human Development Index), whose values were 0.74, 0.66, 0.61, 0.77 and 0.74 for the Mid-West, North, Northeast, South and Southeast, respectively. This is an indication that regions with higher indicators of longevity, education and income were more specialized in animals for milk production (Fig.4). The municipalities with the highest HDI, concentrated in South and Southeast regions showed to be inversely related to the production of goats, as the highest milk production per mu-nicipality is located in northeastern Brazil, which presents HDI below the national average (0.71).
All Brazilian regions showed speciic peculiarities, reve-aled by discriminant analysis. In general, the climate varia-bles, physical and socioeconomic had, on average, discrimi-natory power exceeding 94% (Table 4). Climate variables explain the variation between these regions (AT, TR, RH, PR and NDVI).
The reduction of areas for livestock production, due to population growth has created new opportunities to pro-mote the dairy goat rearing through government initiatives (Devendra 2010, Bett et al. 2011). Bett et al. (2009a) have shown that the largest goat dairy producing areas are lo-cated in environments of medium to high rainfall. In this study, the largest goats production were in the Northeast, in areas with medium to high temperature, low to medium precipitation and low Human Development Index, with averages of 30.35°C, 1156.19 mm/year and 0.61, respec-tively. Thus, because there are poorer communities in this region, with greater governmental incentive for goat rea-ring, which serve as a source of food protein, both meat or milk (Lobo et al. 2011).This is an indication that physical, socioeconomic and climate are important sources of va-riation that should be considered for that animal breeding programs can be successful (McManus et al. 2011).
analysis (Northeast, Midwest, Southeast and South) were well deined and differentiated. Of these, two have distinct peculiarities, for the production of milk and goats: i) the Northeast region (SE, BA, RN, AL, MA, PE, PB, EC, PI), ma-rkedly different, due to a high number of goats with low in-dividual milk production in extensive production systems; ii) Southeast (SP, MG, RJ and ES), using animals specialized for milk production, in intensive systems (Gonçalves et al. 2001, 2008).
These tests also revealed which climate and socioeco-nomic variables were most important for production in the different regions. It is therefore possible to create pro-grams of genetic improvement of goats rooted not only in production levels (Blackburn et al. 1998), but also in all the factors that may inluence the production of goats in diffe-rent regions of Brazil (McManus et al. 2011).
Animal breeding program
As we intensify production systems, with increasing demand for eficiency, there are greater the need for struc-tured breeding programs. This is only possible through systematic data collection with eficient and well-deined selection objectives. These goals should be oriented accor-ding to the expectations and demands of market, and with different environmental conditions, speciic to each region. Thus, as one of the main prerequisites for achieving suc-cess, animal breeding programs must be based on clearly deined goals and objectives, consistent with the market structure and conditions consistent with the general envi-ronment. Blackburn et al. (1998) showed that depending on the environment and the level of production, different breeds should be used. Thus, when creating a breeding pro-gram, one should take into account these two factors.
The development of a breeding program should inclu-de the implications for agricultural policies, infrastructure, and involvement of both the government and private initia-tives as the producer, weather, market and choice of breed best suited to the region. A breeding program should be in-tegrated and its success is determined by participation of the producer (Kosgey et al. 2006).
The success of animal breeding programs is limited by knowledge of the interactions between genotype and cli-mate, social, political, economic and cultural variables. For example, the Southeast region of Brazil has higher GDP, HDI and population, and lower average temperature. For this region, the use of specialized and purebred goats for milk production should be the basis for the success of a bree-ding program, since HDI indicates high educational and economic levels. This sets a positive relationship between consumption and demand. The Northeast region has large areas, is less populated, has average high temperature, low relative humidity, and its HDI is below the national average. These factors, combined with marketing and parameters desired by farmers relect selection for distinct characte-ristics of goats. These animals must have dual purpose, as well as contribute to improving the income of disadvanta-ged families through the sale of milk, can also add econo-mic returns through the sale of animals for slaughter (Lobo et al. 2011).
The valuation of components such as technical guidan-ce, water resources, marketing services, productivity, mo-nitoring and evaluation activities for the rearing of dairy goats are of great importance to the sustainability of bre-eding programs for dairy goats (Bett et al. 2009b). This is because the production of dairy goats in tropical systems is inluenced by soil and climate conditions, biological and socioeconomic. The implementation of breeding programs should be grounded by taking into consideration this set of factors, because they are often dificult or impossible to change (Wollny 2003).
Sustainable systems of livestock production must be adjusted to local conditions, natural and social. The re-cognition of differences in social, economic, cultural and edaphoclimatic between regions increase the distinction between the objectives of selection. The differentiation of these objectives is important for the maintenance of gene-tic variability of domesgene-tic animals. Not only is the heteroge-neity of the circumstances of production between regions, countries or individual farms, but also uncertainty and risk associated with future circumstances that promote the di-fferentiation between the goals of creating and maintaining breeders (males and females) are better adapted to regions speciic (Olesen et al. 2011).
Thus, the implementation of animal breeding programs, speciic to similar regions, especially in terms of climate, it is essential to obtain higher production levels, consistent and appropriate to the local environment. The heterogeneity of the Brazilian reality requires the design of breeding progra-ms that meet the speciicities of each region in order to mi-nimize the impact of different factors that inluence them.
CONCLUSIONS
Brazil, a country of continental proportions, presents hete-rogeneity of climate, physical and socio-economic compo-nents speciic in each region. This becomes more evident, for example, when we compare the goats raised in the Sou-th region of Brazil wiSou-th goats raised in Sou-the NorSou-theast, which don’t presents the same performance, what can be due to the great environmental and socio-economic distinctions that exist between these regions. Therefore, it is necessary to implement programs of animal breeding that meet the needs and characteristics of each region.
REFERENCES
Barros N.N., Silva F.L.R. & Rogério M.C.P. 2005. Efeito do genótipo sobre a produção e a composição do leite de cabras mestiças. Revta Bras. Zoo-tec. 34:1366-1370.
Bett R.C., Bett H.K., Kahi A.K. & Peters K.J. 2009a. Analysis of production objectives and breeding practices of dairy goats in Kenya. Trop. Anim. Hlth Prod. 41:307-320.
Bett R.C., Bett H.K., Kahi A.K. & Peters K.J. 2009b. Evaluation and effecti-veness of breeding and production services for dairy goat farmers in Kenya. Ecological Economics 68:2451-2460.
Bett R.C., Bett H.K., Kahi A.K. & Peters K.J. 2011. Definition of breeding ob-jectives and optimum crossbreeding levels for goats in the smallholder production systems. Small Rumin. Res. 96:16-24.
Campbell W.B., Freeman D.C. & Emlen J.M. 2010. Correlations between plant phylogenetic and functional diversity in a high altitude cold salt desert depend on sheep grazing season: Implications for range recovery. Ecological Indicators 10:676-686.
Costa R.G., Almeida C.C., Pimenta Filho E.C., Holanda Junior E.V. & Santos N.M. 2008. Caracterização do sistema de produção caprino e ovino na região semi-árida do Estado da Paraíba, Brasil. Archs Zootecnia 57:195-205.
Devendra C. 2010. Concluding synthesis and the future for sustainable goat production. Small Rumin. Res. 89:125-130.
Falconer D.S. & Mackay T.F.C. 1996. Introduction to Quantitative Genetics. 4th ed. Longmans Green, Harlow. 365p.
Gonçalves H.C., Silva M.A., Wechsler F.S. & Ramos A.A. 2001. Fatores gené-ticos e de meio na produção de leite de caprinos leiteiros. Revta Bras. Reprod. Anim. 30:719-729.
Goncalves A.L., Lana R.P., Vieira R.A.M., Henrique D.S., Mancio A.B. & Perei-ra J.C. 2008. Avaliação de sistemas de produção de caprinos leiteiros na Região Sudeste do Brasil. Revta Bras. Zootecnia 37:366-376.
Herrero M., Thornton P.K., Notenbaert A.M., Wood S., Msangi S., Freeman H.A., Bossio D., Dixon J., Peters M., Van de Steeg J., Lynam J., Rao P.P., Mac Millan S., Gerard B., McDermott J., Seré C. & Rosegrant M. 2010. Smart investments in sustainable food production: Revisiting mixed crop--livestock systems. Science 327:822-827.
Hewitson L., Gordon I.J. & Dumont B. 2007. Social context affects patch--leaving decisions of sheep in a variable environment. Anim. Behavior 74:239-246.
IBGE 2008. Diretoria de Pesquisas, Coordenação de Agropecuária, Pesqui-sa da Pecuária Municipal. Instituto Brasileiro de Geograia e Estatística. Available at <http://www.ibge.gov.br> Accessed Aug. 18, 2010. Joost S., Colli L. & Baret P.V. 2010.Integrating geo-referenced multiscale
and multidisciplinary data for the management of biodiversity in lives-tock genetic resources. Anim. Genetics 41:47-63.
Kaiser H.F. 1970. A second generation little Jiffy. Psychometrika 35:401-415.
Kosgey I.S., Baker R.L., Udo H.M.J. & Van Arendonk J.A.M. 2006. Successes and failures of small ruminant breeding programmes in the tropics: A review. Small Rumin. Res. 61:13-28.
Lachenbruch P.A. 1997. Discriminant diagnosis. Biometrics 53:1284-1292.
Lobo R.N.B., Pereira I.D.C., Facó O. & McManus C.M. 2011. Economic values for production traits of Morada Nova meat sheep in a pasture based pro-duction system in semi-arid Brazil. Small Rumin. Res. 96:93-100 McManus C., Soares Filho G., Louvandini H., Dias L.T., Teixeira R.A. &
Mu-rata L.S. 2008. Growth of Saanen, Alpine and Toggenburg goats in the Federal District, Brazil: Genetic and environmental factors. Ciênc. Anim. Bras. 9:68-75.
McManus C., Louvandini H., Gugel R., Sasaki L.C.B., Bianchini E., Bernal F.E.M., Paiva S.R. & Paim T.P. 2010. Skin and coat traits in sheep in Brazil and their relation with heat tolerance. Trop. Anim. Hlth Prod. 43:121-126.
McManus C., Cobuci J., Braccini Neto J. & Paiva S. 2011. Decision making in animal breeding programs and their consequences for animal produc-tion. Revta Bras. Reprod. Anim. 35:69-76.
Olesen I., Goren A.F. & Gjerde B. 2011. Deinition of animal breeding goals for sustainable production systems. J. Anim. Sci. 78:570-582.
Oliveira D.F., Cruz J.F., Carneiro P.L.S., Malhado C.H.M., Rondina D., Ferraz R.C.N. & Teixeira Neto M.R. 2009. Desenvolvimento ponderal e caracte-rísticas de crescimento de caprinos da raça Anglonubiana criados em sistema semi-intensivo. Revta Bras. Saúde Prod. Anim. 10:256-265. Sibbald A.M., Oom S.P. & Hooper R.J. 2008. Effects of social behaviour on
the spatial distribution of sheep grazing a complex vegetation mosaic. Appl. Anim. Behav. Sci. 115:149-159.
Skonhoft A., Austrheim G. & Mysterud A. 2010. A bioeconomic sheep-vege-tation trade-off model: an analysis of the Nordic sheep farming system. Natural Resource Modeling 23:354-380.