Received: 29 Apr., 2014 Accepted: 09 July, 2014 (006369)
1Department of Nursing, Nutrition and Physiotherapy, University Pontifical Catholic of Goiás – PUC-GO, Goiânia, GO, Brazil 2School of Nutrition, Federal University of Goiás – UFG, Goiânia, GO, Brazil, e-mail: [email protected], [email protected] *Corresponding author
Carotenoids are related to the colour and lipid content of the pequi
(
Caryocar brasiliense
Camb.) pulp from the Brazilian Savanna
Débora Melo RIBEIRO1, Daniela Canuto FERNANDES1, Aline Medeiros ALVES2, Maria Margareth Veloso NAVES2*
1 Introduction
The Brazilian Savanna (Cerrado) is the second largest biome in Brazil and is located mainly in the mid-western region of the country. The Brazilian Savanna has several fruit-bearing species with a great potential for agricultural and technological uses (Carvalho et al., 2009; Castro et al., 1999). Among these native fruits, pequi (Caryocar brasiliense Camb.) is the most expressive example; its pulp has an intense colour that ranges from light yellow to dark orange and a striking and peculiar flavour(Geőcze et al., 2013).
Pequi pulp is often consumed and appreciated by the population of the Brazilian Savanna, either in its homemade or industrial form, and its harvest period varies from September to February (Araújo, 1995). In addition to its gastronomic and technological potentials, studie suggests that pequi has a good antioxidant potential (Morais et al., 2013). However, research regarding the carotenoid and phenolic contents of its pulp is limited in number and sample stratification since sampling has been restricted to a small area of the Cerrado or even reduced to a single plant (Azevedo-Meleiro & Rodriguez-Amaya, 2004; Rodriguez-Amaya et al., 2008).
The lack of sample stratification is an important limitation in food research, mainly for native fruits, since studies on the biodiversity of the Brazilian Savanna have shown that there is a great variability of physical (Moura et al., 2013; Vera et al., 2005) and chemical (Czeder et al., 2012) properties of the native fruits from different area of the biome. Therefore, this study tested the hypothesis that there are differences in colour, chemical properties and antioxidant activity of pequi fruits from different regions of the Brazilian Savanna, and that these properties are interrelated. Thus, the present study analysed and compared the
colour and chemical and antioxidant properties of pequi fruit samples from five different regions of the Brazilian Savanna, and the correlations among the variables were tested.
2 Materials and methods
2.1 Fruit sampling
Five fruit samples were obtained from native pequi plants from different regions of the Brazilian Savanna: North (latitude: 08° 32’ 20”, longitude: 48° 30’ 21”), South (latitude: 16° 51’ 39”, longitude: 44° 54’ 50”), West (latitude: 15° 51’ 57”, longitude: 56° 04’ 37”), East (latitude: 15° 59’ 42”, longitude: 44° 16’ 12”), and Central (latitude: 16° 37’ 08”, longitude: 48° 44’ 38”). These areas are representative of the production of the native pequi from the Cerrado biome. The samples were obtained in different months, according to the harvest period in each region: North - October 2010; Central - December 2010; South - December 2010; East - January 2011; West - January 2011. The fruits acquired were newly collected and at optimum maturity for commercial use.
2.2 Pequi pulp colour analysis
The colour analysis was performed with 30 pequi fruits from each savanna region, randomly selected from a total of 50 kg. This analysis, which was performed in peeled fruits using a Sphere Colorimeter - Color Quest II (Hunter Lab, Reston, VA, USA) to determine the following CIE (Commission Internationale de l’éclairage) parameters: L* (whiteness or brightness), a* (redness/greenness), and b* (yellowness/ blueness) (Lancaster et al., 1997). Colour intensity (chroma) Abstract
This study investigated the colour, proximate composition, bioactive compounds (phenolic and carotenoid contents), and antioxidant activity of the pulp of pequi from different regions of the Brazilian Savanna. The colour parameters and the lipid and carotenoid contents of the pulp were significantly different between the samples. The lipid content ranged from 135.4 to 322.5 g/kg. The pequi pulp showed high total phenolic content (1.8 to 3.3 mg GAE/g). The carotenoid amount ranged from 37 to 187 µg/g. The carotenoid content was significantly correlated with the colour and lipid content of the pequi pulp. The antioxidant activity showed a mean IC50 value of 197.9 µg/mL. The pequi pulp is rich in phenolic compounds and carotenoids
and has a good antioxidant activity. Its colour is influenced by the carotenoid content, which can be predicted by regression models using routine colour parameters.
Keywords:Caryocar brasiliense Camb.; native fruits; Savanna; bioactive compounds; antioxidant capacity. OI:
9.52 M acetone, followed by a second extraction with 12.33 M methanol. Then, the extract (0.6 mL) was added to 5.0 mL of distilled water, and 1.0 mL of the Folin-Ciocalteu’s phenol reagent and 1.0 mL of 0.24 M sodium carbonate were added to the mixture. The mixture was agitated and incubated at 25°C for 30 min. The absorbance at 700 nm was measured using a spectrophotometer V-630 (JASCO, Tokyo, Japan). A standard curve of gallic acid was drawn, and absorbance was converted to phenolic content in terms of mg of gallic acid equivalents (GAE) per g of pulp. The analyses were performed in triplicate.
Total carotenoid content
The total carotenoid content of the pequi pulp was analysed according to the method described by Higby (1962). The extractions were performed using 25 mL of cold acetone and 1.0 g of pulp mixed with 0.1% of butyl hydroxy toluene (BHT). The residue was re-extracted until it became colourless. The extracts were transferred to petroleum ether, and the filtrates were combined in a separatory funnel and washed with distilled water. The water phase was discarded, and sodium sulphate was added as a desiccant. The ether phase was transferred to a 100 mL volumetric flask and brought to volume with petroleum ether. The absorbance of the extracts was measured from 250 to 700 nm in a spectrophotometer. To determine the total carotenoid content, the highest value of absorbance detected was considered. The total carotenoid content was calculated using the absorbance of anteraxantin at 1 g/mL, which has an extinction coefficient of 2350 (Chisté & Mercadante, 2012). The analyses were performed in triplicate.
2.4 Evaluation of antioxidant activity of the pequi pulp
The antioxidant activity of the pequi pulp was measured
using a 2,2-diphenyl-1-picrylhydrazyl (DPPH•)-free radical
scavenging assay, according to the method of Brand-Williams et al. (1995) with some adaptations. The extraction experiments were conducted using 50 mL of ethanol and 2.5 g
of pulp. Then, 1.5 mL of a 0.05 mM DPPH• solution was added
to the extracts. The decrease in the absorbance at 517 nm at 0, 1, 2, 3, 4, 5, 10, 15, and 20 min of the reaction was measured using a spectrophotometer V-630 (JASCO, Tokyo, Japan). The decrease in the sample absorbance readings was related to the control (without the extract), and the percentage of
DPPH• discoloration was estimated. Based on this value, the
IC50 (concentration of the sample required to inhibit 50% of
the radical) was calculated. BHT was used as a standard. The analyses were performed in triplicate.
2.5 Statistical analysis
The values of colour, proximal composition, total phenolic, carotenoid content, and antioxidant activity obtained were submitted to variance analysis, and the comparisons between the means were performed by the Tukey test. The coefficient of correlation r was calculated to assess the correlations between the variables. Statistical calculations were performed using the Statistica software (Stat Soft Inc., 7.0 version, 2004, Tulsa, USA). A significance level of 5% was adopted.
(Equation 1) and hue angle (Equation 2) were calculated using the following equations (McGuire, 1992):
Chroma (C) = (a*2 + b*2)½ (1)
Hue angle (h) = tan–1 (b*/a*) (2)
2.3 Chemical analyses of the pequi pulp
Sample preparation
For the chemical analyses, the pequi fruits were peeled and pulped manually using a stainless steel knife. Then, the fruit pulp was ground and homogenized in a food processor HL-3253 (Walita, São Paulo, Brazil), packaged in opaque bags, and stored at –45°C until analyses. For the analyses of the total phenolic and carotenoid content, whole fruits were frozen and stored at –45°C until analysis.
Proximate composition
The following analyses were performed: moisture (Association of Official Analytical Chemists, 2002); total nitrogen, according to the micro-Kjeldahl method and converted into protein using the factor 6.25 (Association of Official Analytical Chemists, 2002); total lipids, extracted using the technique of Bligh and Dyer(1959) and subsequently measured by gravimetry; ash, by burning in an oven at 550°C; and total dietary fibre (Association of Official Analytical Chemists, 2002). The total carbohydrates were estimated by difference, subtracting the values obtained for moisture, protein, fat, ash and fibre from one hundred. The energy value of the samples was estimated based on the proximate composition data, considering the Atwater conversion factors, which are 4, 4, and 9 kcal/g for protein, carbohydrate, and lipid, respectively (Merril & Watt, 1973). The analyses were performed in triplicate.
Fatty acid composition
To determine the fatty acid composition, the samples were extracted as described by Folch et al. (1957) and esterified according to Hartman & Lago(1973). Fatty acids were separated by Finnigan Focus GC gas chromatography (Thermo, Austin, TX, USA) with a flame ionization detector and capillary column (RESTEK, Bellefonte, PA, USA - polyethylene glycol crossbond - 30 m x 0.25 mm) of fused silica. The running conditions were: carrier gas – hydrogen (2 mL/min); make up gas – nitrogen (28 mL/min); and hydrogen (30 mL/min), and synthetic air (300 mL/min) in order to maintain the detector flame. The injection volume was 1 µL and split ratio of 2:98. Retention time, peak area, and area relative percentage values were obtained using the Chrom Quest 4.1 software. Fatty acids were identified and quantified by reference to the calibration curve prepared with standard methyl esters of fatty acids (Sigma Aldrich). The analyses were performed in triplicate.
Total phenolic content
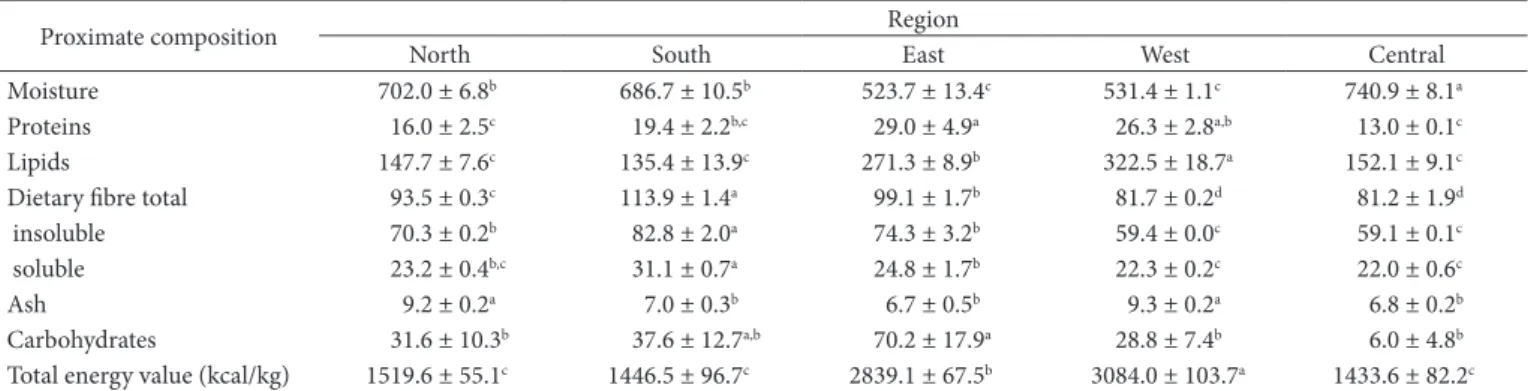
observed in the lipid content of the pequi pulps is most likely due to different genetic profiles in the same pequi species. The monounsaturated fats were the most prevalent among the fatty acids in all samples, mainly oleic acid (Table 3). The energy values found in this study varied according to the lipid content of the fruits. The fruits from the West region showed the highest energy values (greater than 3000 kcal/kg), which is compatible with the literature (Lima et al., 2007). On the other hand, lower energy values of approximately 1500 kcal/kg (Table 2) were found for the pequi fruit, which represent lighter pulps than that of the cited study (3584 kcal/kg). The pequi pulps also had high percentage of total dietary fibre, mainly insoluble fibre (Table 2). A portion of 20 g of pequi pulp provides around 10% of the Dietary Reference Intake (DRI) for dietary fibre (Institute of Medicine, 2005). The pequi pulp contains low levels of carbohydrates, ranging from 6.0 (Central region) to 70.2 g/ kg (East region) (Table 2).
The fruits from the Central region had the highest value of total phenolic content (Table 4), which is higher than the previously reported value (2.09 mg GAE/g)(Lima et al., 2007). The phenolic content found in the pequi pulp in this study is comparable with that of the other exotic fruits, such as blackberry, cactus pear, and mangaba (Clerici & Carvalho-Silva, 2011).
Regarding the total carotenoid content, values ranging from 37 (North region) to 187 µg/g (East region) were found (Table 4). The only previous study on the total carotenoid content in pequi fruits of the same species investigated in the present study reported an intermediate value, 72.5 µg/g (Lima et al., 2007). The identification and quantification of the carotenoids of the
C. brasiliense are an important tool to clarify the differences
3 Results and discussion
3.1 Pequi pulp colour
The fruits from the North and Central regions showed higher values of L* (mean= 70.8) and lower values of a* (mean= 23.7), which indicate lighter coloured and less red fruits. In contrast, the fruits from the East region were darker and redder (Table 1). There was a positive correlation between L* and the parameter a* (p= 0.001). The pequis from the North region showed the highest b* values. The lowest values were observed in fruits from the East and Central regions (Table 1). The variation in this parameter is due to the great amplitude of the yellow colour of the pequi pulp. The parameter C ranged from 75 to 115 and was positively correlated with the parameter b* (p= 0.006). The hue angles of the pequi pulps ranged from approximately 55° to 80°, indicating a fruit colour from orange-red to intense yellow since lower hue angle values corresponded to more orange-red pulps and higher hue angles corresponded to more yellow pulps. There are no studies on the CIE parameters of pequi pulps in the literature.
3.2 Chemical characteristics of pequi pulp
The pequi pulp showed moisture content greater than 500 g/kg and protein content less than 30 g/kg (Table 2), similar values to those reported for other pulps of exotic fruits (Clerici & Carvalho-Silva, 2011). There was a significant variation in the lipid content of the pequi pulps (approximately 147 to 322 g/kg); however, a narrower range of lipid content for
the C. brasiliense - 200 to 330 g/kg - has been reported in the
literature (Lima et al., 2007; Vera et al., 2007). The wide variation
Table 1. Colour parameters of pequi pulp from five regions of the Brazilian Savanna1.
Region L* a* b* C h* (°)
North 72.86 ± 2.54a 23.34 ± 6.52c 112.94 ± 17.15a 115.42 ± 17.39a 78.38 ± 2.40a
South 59.99 ± 12.07c 35.11 ± 11.39b 97.08 ± 19.84b 107.11 ± 8.15a 69.04 ± 5.30b
East 43.63 ± 7.40e 54.10 ± 3.97a 75.20 ± 12.74c,d 93.13 ± 9.12b 53.74 ± 5.98d
West 48.11 ± 4.72d 42.19 ± 4.02b 82.73 ± 8.01c 93.13 ± 5.52b 63.08 ± 4.53c
Central 68.77 ± 5.61b 24.10 ± 11.97c 70.81 ± 21.13d 75.22 ± 22.90c 72.16 ± 7.04b 1The values are expressed as means ± standard deviation of the triplicate analysis of each region. Means in the same column with the same letter are not significantly different according
to the Tukey test (5% of probability).
Table 2. Proximate composition (g/kg) of pequi pulp from five regions of the Brazilian Savanna1.
Proximate composition Region
North South East West Central
Moisture 702.0 ± 6.8b 686.7 ± 10.5b 523.7 ± 13.4c 531.4 ± 1.1c 740.9 ± 8.1a
Proteins 16.0 ± 2.5c 19.4 ± 2.2b,c 29.0 ± 4.9a 26.3 ± 2.8a,b 13.0 ± 0.1c
Lipids 147.7 ± 7.6c 135.4 ± 13.9c 271.3 ± 8.9b 322.5 ± 18.7a 152.1 ± 9.1c
Dietary fibre total 93.5 ± 0.3c 113.9 ± 1.4a 99.1 ± 1.7b 81.7 ± 0.2d 81.2 ± 1.9d
insoluble 70.3 ± 0.2b 82.8 ± 2.0a 74.3 ± 3.2b 59.4 ± 0.0c 59.1 ± 0.1c
soluble 23.2 ± 0.4b,c 31.1 ± 0.7a 24.8 ± 1.7b 22.3 ± 0.2c 22.0 ± 0.6c
Ash 9.2 ± 0.2a 7.0 ± 0.3b 6.7 ± 0.5b 9.3 ± 0.2a 6.8 ± 0.2b
Carbohydrates 31.6 ± 10.3b 37.6 ± 12.7a,b 70.2 ± 17.9a 28.8 ± 7.4b 6.0 ± 4.8b
Total energy value (kcal/kg) 1519.6 ± 55.1c 1446.5 ± 96.7c 2839.1 ± 67.5b 3084.0 ± 103.7a 1433.6 ± 82.2c 1The values are expressed as means ± standard deviation of the triplicate analysis of each region. Means in the same row with the same letter are not significantly different according
other regions. These values are comparable with those of other exotic fruits (Dembitsky et al., 2011). A lower antioxidant activity (IC50 = 298 μg/mL) than those found in the present study (Table 4) was reported for the pulp + seed of the pequi fruit (Roesler et al., 2007).
3.4 Relationship between colour parameters and carotenoid content
According to the r coefficient values (Table 5), there are strong significantly (p<0.001) correlations between luminosity and the carotenoid content and between the hue angle and carotenoid content in the pequi pulp. In addition, a significant correlation between the carotenoid content and the parameters a* and b* was observed. These correlations are a useful tool for the technological and commercial uses of the pequi pulp because the equations presented in Table 5 can predict the carotenoid content using routine colour parameters.
found in the present study, as recently reported for the Caryocar
villosum (Chisté & Mercadante, 2012; Chisté et al., 2012). There
was a linear and positive correlation between the carotenoid and lipid contents of the pequi pulp (r= 0.67, p= 0.002), confirming the lipophilic nature of carotenoids (Amorim-Carrilho et al., 2014).
It is important to note that the great variation of the physical and chemical characteristics of the pequi fruits from the different regions studied may occur due to differences in the climate, soil fertility and pH, annual rainfall, and other environmental conditions observed in the Brazilian Savanna biome (Novaes et al., 2013).
3.3 Antioxidant activity
All extracts showed the ability to sequester the free radical DPPH (Table 4). The fruits from the East and West regions showed higher antioxidant activity than the fruits from the
Table 3. Fatty acid composition (g/kg of lipid) of pequi pulp from five regions of the Brazilian Savanna1.
Fatty acid (main components)
Region
North South East West Central
Saturated 299.7 ± 2.5d 394.2 ± 5.2b 368.8 ± 4.7c 431.9 ± 2.0a 384.1 ± 0.1b
Myristic C14:0 1.0 ± 0.0b 1.0 ± 0.0a,b 1.1 ± 0.1a 0.6 ± 0.0c 1.1 ± 0.1a,b
Palmitic C16:0 281.4 ± 2.8d 367.8 ± 5.6b 343.9 ± 4.6c 405.0 ± 1.8a 359.6 ± 0.2b
Stearic C18:0 13.9 ± 0.1d 20.7 ± 0.7b 18.5 ± 0.1c 22.8 ± 0.1a 20.1 ± 0.0b
Monounsaturated 643.6 ± 3.6a 525.2 ± 14.5c 559.7 ± 1.6b 510.0 ± 0.0c 537.0 ± 0.2b,c
Palmitoleic C16:1 n7 3.9 ± 0.0e 11.8 ± 0.1a 6.7 ± 0.2d 10.2 ± 0.0b 9.5 ± 0.0c
Oleic C18:1 cis n9 635.4 ± 3.5a 507.2 ± 15.0c,d 547.6 ± 1.3b 498.3 ± 0.1d 526.0 ± 0.2b,c
Polyunsaturated 16.1 ± 0.0a 15.6 ± 0.7b 16.9 ± 0.0a 11.5 ± 0.0c 15.8 ± 0.0b
Linoleic C18:2 n6 16.1 ± 0.0a 11.3 ± 0.3c 12.8 ± 0.0b 11.3 ± 0.0c 15.8 ± 0.0a
Eicosapentaenoic C20:5 n3 ND 2.7 ± 0.3 2.4 ± 0.1 ND ND
ND - not detected. 1The values are expressed as means ± standard deviation of the triplicate analysis of each region. Means in the same row with the same letter are not significantly
different according to the Tukey test (5% of probability).
Table 4. Total phenolic and total carotenoid content and antioxidant activity (alcoholic extract) of pequi pulp from five regions of the Brazilian Savanna1.
Region Total phenolics (mg GAE/g) Total carotenoid (µg/g) Antioxidant activity (IC50, µg/mL)
North 1.78 ± 0.01c 37.08 ± 1.84d 197.93 ± 2.17a
South 2.23 ± 0.14b 141.89 ± 6.76b 202.00 ± 5.15a
East 2.16 ± 0.17b,c 187.00 ± 12.43a 194.30 ± 2.68b
West 1.80 ± 0.04c 155.23 ± 0.53b 195.97 ± 5.16b
Central 3.34 ± 0.07a 72.10 ± 3.58c 199.40 ± 3.14a
GAE: Gallic Acid Equivalents. 1The values are expressed as means ± standard deviation of the triplicate analysis of each region. Means in the same column with the same letter are not
significantly different according to the Tukey test (5% of probability).
Table 5. Relationship between colour parameters and total carotenoid content of pequi pulp from the Brazilian Savanna.
Colour parameter Regression model Correlation coefficient r p value
L* Y = 378.4216 – 4.4004.L –0.91 <0.0001
a* Y= –27.4857 + 3.6537.a* 0.81 <0.0001
b* Y= 266.8659 – 1.7275.b* –0.69 0.0030
Clerici, M. T. P. S., & Carvalho-Silva, L. B. (2011). Nutritional bioactive compounds and technological aspects of minor fruits grown in Brazil. Food Research International, 44(7), 1658-1670. http://dx.doi. org/10.1016/j.foodres.2011.04.020
Czeder, L. P., Fernandes, D. C., Freitas, J. B., & Naves, M. M. V. (2012). Baru almonds from different regions of the Brazilian Savanna: implications on physical and nutritional characteristics. Agricultural Science, 3(5), 745-754. http://dx.doi.org/10.4236/as.2012.35090 Dembitsky, V. M., Poovarodom, S., Leontowicz, H., Leontowicz, M.,
Vearasilp, S., Trakhtenberg, S., & Gorinstein, S. (2011). The multiple nutrition properties of some exotic fruits: biological activity and active metabolites. Food Reserach International, 44(7), 1671-1701. http://dx.doi.org/10.1016/j.foodres.2011.03.003
Folch, J., Less, M., & Stanley, G. H. S. (1957). A simple method for the isolation and purification of total lipides from animal tissues.
Journal of Biological Chemistry, 226(1), 497-509. PMid:13428781. Geőcze, K. C., Barbosa, L. C. A., Fidêncio, P. H., Silvério, F. O., Lima,
C. F., Barbosa, M. C. A., & Ismail, F. M. D. (2013). Essential oils from pequi fruits from the Brazilian Cerrado ecosystem. Food Research International, 54(1), 1-8. http://dx.doi.org/10.1016/j. foodres.2013.06.005
Hartman, L. & Lago, R. C. A. (1973). Rapid preparation of fatty acids methyl esters. Laboratory Practice, 22(6), 475-476. PMid:4727126. Higby, W. K. (1962). A simplified method for determination of some
aspects of the carotenoid distribution in natural and carotene fortified orange juice. Journal of Food Science, 27(1), 42-49. http:// dx.doi.org/10.1111/j.1365-2621.1962.tb00055.x
Institute of Medicine. (2005). Dietary reference intakes for energy, carbohydrate, fiber, fat, fatty acids, cholesterol, protein, and amino acids. Washington: National Academy Press.
Lancaster, J. E., Lister, C. E., Ready, P. F., & Triggs, C. M. (1997). Influence of pigment composition on skin color in a wide range of fruit and vegetables. Journal of the American Society for Horticultural Science, 122(4), 594-598.
Lima, A., Silva, A. M. O., Trindade, R. A., Torres, R. P., & Mancini-Filho, J. (2007). Composição química e compostos bioativos presentes na polpa e na amêndoa de pequi (Caryocar brasiliense, Camb.)/ Chemical composition and bioactive compounds in the pulp and almond of pequi fruit. Revista Brasileira de Fruticultura, 29(3), 695-698. http://dx.doi.org/10.1590/S0100-29452007000300052 McGuire, R. G. (1992). Reporting of objective color measurements.
Hort Science, 27(12), 1254-1255.
Merril, A. L., & Watt, B. K. (1973). Energy value of foods: basis and derivation. Washington: United States Departament of Agriculture. Moura, N. F., Chaves, L. J., & Naves, R. V. (2013). Caracterização física de frutos de pequizeiro (Caryocar brasiliense Camb.) do Cerrado.
Revista Árvore, 37(5), 905-912. http://dx.doi.org/10.1590/S0100-67622013000500013
Morais, M. L., Silva, A. C. R., Araújo, C. R. R., Esteves, E. A., & Dessimoni-Pinto, N. A. V. (2013). Determinação do potencial antioxidante in vitro de frutos do Cerrado brasileiro. Revista Brasileira de Fruticultura, 35(2), 355-360. http://dx.doi.org/10.1590/ S0100-29452013000200004
Novaes, P., Molinillo, J. M. G., Varela, R. M., & Macías, F. A. (2013). Ecological phytochemistry of Cerrado (Brazilian savanna) plants.
Phytochemistry Reviews, 12(4), 839-855. http://dx.doi.org/10.1007/ s11101-013-9315-3
Rodriguez-Amaya, D. B., Kimura, M., Godoy, H. T., & Amaya-Farfan, J. (2008). Updated Brazilian database on food carotenoids: factors affecting carotenoid. Journal of Food Composition and Analysis,
21(6), 445-463. http://dx.doi.org/10.1016/j.jfca.2008.04.001
4 Conclusions
Colour and the lipid and carotenoid contents are influenced by the native region of the pequi fruit. The carotenoid content is positively related to the colour and the lipid content of the pequi pulp. The pequi pulp is rich in phenolic compounds and carotenoids, and it has good antioxidant activity. The regression models developed enable the prediction of the total carotenoid content of the pequi pulp using routine colour parameters.
Acknowledgements
The authors are grateful to CNPq and CAPES (Brazil) for the financial support, to professor Dr. Ronaldo Veloso Naves, School of Agronomy (UFG), for his guidance in collecting the pequi fruit, and to Dr. Tânia S. Agostini-Costa, Embrapa Cenargen, Brasília-DF, Brazil, for her assistance in the carotenoid analysis.
References
Amorim-Carrilho, K. T., Cepeda, A., Fente, C., & Regal, P. (2014). Review of methods for analysis of carotenoids. Trends in Analytical Chemistry, 56(1), 49-73. http://dx.doi.org/10.1016/j. trac.2013.12.011
Association of Official Analytical Chemists - AOAC. (2002). Official Methods of Analysis of the AOAC International. Gaithersburg. Araújo, F. D. (1995). A review of Caryocar brasiliense (Caryocaraceae):
an economically valuable species of the central Brazilian cerrados.
Economic Botany, 49(1), 40-48. http://dx.doi.org/10.1007/ BF02862276
Azevedo-Meleiro, C. H., & Rodriguez-Amaya, D. B. (2004). Confirmation of the identity of the carotenoids of tropical fruits by HPLC-DAD and HPLC-MS. Journal of Food Composition and Analysis, 17(3), 385-396. http://dx.doi.org/10.1016/j. jfca.2004.02.004
Bligh, E. G., & Dyer, W. J. (1959). A rapid method of total lipid extraction and purification. Canadian Journal of Biochemistry and Physiology, 37(8), 911-917. PMid:13671378. http://dx.doi. org/10.1139/o59-099
Brand-Williams, W., Cuvelier, M. E., & Berset, C. (1995). Use of a free radical method to evaluate antioxidant activity. LWT - Food Science and Technology, 28(1), 25-30. http://dx.doi.org/10.1016/ S0023-6438(95)80008-5
Carvalho, F. M. V., Marco Júnior, P., & Ferreira, L. G. (2009). The Cerrado intopieces: habitat fragmentation as a function of landscape use in the savannas of central Brazil. Biological Conservation, 142(7), 1392-1403. http://dx.doi.org/10.1016/j.biocon.2009.01.031 Castro, A. A. J. F., Martins, F. R., Tamashiro, J. Y., & Sheperd, G. J.
(1999). How rich is the flora of Brazilian Cerrados? Annals of the Missouri Botanical Garden, 86(1), 192-224. http://dx.doi. org/10.2307/2666220
Chisté, R. C., Freitas, M., Mercadante, A. Z., & Fernandes, E. (2012). The potential of extracts of Caryocar villosum pulp to scavenge reactive oxygen and nitrogen species. Food Chemistry, 135(3), 1740-1749. PMid:22953916. http://dx.doi.org/10.1016/j.foodchem.2012.06.027 Chisté, R. C., & Mercadante, A. Z. (2012). Identification and
Vera, R., Souza, E. R. B., Fernandes, E. P., Naves, R. V., Soares Júnior, M. S., Caliari, M., & Ximenes, P. A. (2007). Caracterização física e química de frutos do pequizeiro (Caryocar brasiliense Camb.) oriundos de duas regiões no estado de Goiás, Brasil. Pesquisa Agropecuária Tropical, 37(2), 93-99.
Vera, R., Naves, R. V., Nascimento, J. L., Chaves, L. J., Leandro, W. M., & Souza, E.R.B. (2005). Caracterização física de frutos do pequizeiro (Caryocar brasiliense Camb.) no estado de Goiás/Physical characterization of pequi fruits (Caryocar brasiliense Camb.) in Goiás state. Pesquisa Agropecuária Tropical, 35(2), 71-79.
Roesler, R., Malta, L. G., Carrasco, L. C., Holanda, R. B., Sousa, C. A. S., & Pastore, G. M. (2007). Atividade antioxidante de frutas do Cerrado/Antioxidant activity of cerrado fruits. Ciência e Tecnologia de Alimentos, 27(1), 53-60. http://dx.doi.org/10.1590/S0101-20612007000100010
Swain, T., & Hillis, W. E. (1959). The phenolic constituents of Prunus domestica L: the quantitative analysis of phenolic constituents.