Rev. Caatinga
WATER DEMAND, CROP COEFFICIENT AND UNCOUPLING FACTOR OF
COWPEA IN THE EASTERN AMAZON
1VIVIAN DIELLY DA SILVA FARIAS2*, MARCUS JOSÉ ALVES DE LIMA2, HILDO GIUSEPPE GARCIA CALDAS
NUNES2, DENIS DE PINHO SOUSA2, PAULO JORGE DE OLIVEIRA PONTE DE SOUZA2
ABSTRACT – Cowpea has great socioeconomic importance in the northeastern part of Pará state. However, in order to provide suitable irrigation management during the dry period this region requires solid information
regarding water demand by regional crops. This research aims to determine the water demand, the crop coefficient (Kc) and the uncoupling factor during the different development stages of cowpea in the northeast
of Pará. The crop evapotranspiration (ETc) was measured by drainage lysimeters. This information was coupled to the reference evapotranspiration (ETo) to obtain the crop coefficients, which were used to adjust the model function of accumulated degree-days and the leaf area index (LAI). The uncoupling factor was estimated to indicate the factors that control evapotranspiration. The ETc values reached a cumulative total of 267.73 mm ± 10.21 mm during the cowpea cycle. The average value of the uncoupling factor was 0.66. This indicates that the cowpea crop does not fully uncouple from the atmosphere underneath the climatic conditions in northeast Pará. The cowpea Kc values presented averages of 0.8, 1.4 and 0.8 in the vegetative phase, reproductive phase and final stage, respectively. The Gaussian model showed an excellent fit for the estimation of Kc values based on accumulated degree days and the LAI. These amounts differ from others found in the literature. Therefore, it reinforces the necessity for an assessment of crop coefficients under local conditions and for the employment of more precise methods.
Keywords: Vigna unguiculata L. Walp. Penman-montheith. Lysimeters. Uncoupling factor. Evapotranspiration.
DEMANDA HÍDRICA, COEFICIENTE DE CULTIVO E FATOR DE DESACOPLAMENTO DO FEIJÃO CAUPI NA AMAZÔNIA ORIENTAL
RESUMO – O feijão caupi possui grande importância sócioeconômica para o nordeste paraense, porém, a região necessita de informações seguras quanto demanda hídrica, para promover um manejo adequado de irrigação no período considerado mais seco do ano. Assim, o objetivo da pesquisa foi determinar a demanda hídrica, coeficiente da cultura (Kc) e fator de desacoplamento nos diferentes estádios de desenvolvimento do feijão caupi no nordeste paraense. Com a evapotranspiração da cultura (ETc), obtida por meio de lisímetros de drenagem, e a evapotranspiração de referência (ETo) foram obtidos os coeficientes de cultura (Kc), utilizados posteriormente, para ajustar modelos em função dos graus dias acumulados (GD) e índice de área foliar (IAF), o fator de desacoplamento foi estimado para indicar os fatores que estão governando a evapotranspiração. Os valores de ETc atingiram um total acumulado, durante o ciclo do feijão caupi, de 267,73 mm ± 10,21 mm. O valor médio do fator de desacoplamento foi 0,66 indicando que a cultura do feijão-caupi não desacopla totalmente da atmosfera nas condições climáticas do nordeste paraense. O Kc do feijão caupi apresentou valor médio de 0,8, 1,4 e 0,8 na fase vegetativa, fase reprodutiva e estádio final, respectivamente. O modelo Gaussiano apresentou ótimo ajuste para a estimativa dos valores Kc em função dos graus-dia acumulados e do IAF. Tais valores se diferenciam de alguns encontrados na literatura, o que reforça a necessidade de estudos relacionados a consumo hídrico, assim como coeficiente de cultura, em condições locais e por métodos precisos.
Palavras-chave: Vigna unguiculata L. Walp. Penman-montheith. Lisímetros. Fator de desacoplamento. Evapotranspiração.
____________________ *Corresponding author
1Received for publication in 04/30/2016; accepted in 07/12/2016.
Paper extracted from the doctoral thesis of the first author, research financed by CAPES.
Rev. Caatinga
INTRODUCTION
The production chain of cowpea (Vigna unguiculata L. Walp) is an important source of employment and income in the northeast region of Pará state. Nonetheless, the most recent data from the Pará State Executive Secretary of Agriculture (SAGRI, 2015) reveal that in 2012 the productivity ranged from 850 to 650 kg ha-1 and has been falling since 2003. This trend might be related to technical or climatic conditions. Considering that most of Pará state has two well-defined seasons: the first semester is the rainiest and the second semester has scarce rainfall (LOPES et al., 2013). The cultivation of this crop is thus limited to the first half of the year.
The productivity of cowpea in the region could be increased with the adoption of irrigation systems in order to fully or partly supplement its water requirement during the driest period of the year. About 29,333 ha of Pará state area is irrigated. Non-traditional irrigation methods are used in 41% of this area (SOUZA, 2012).This reinforces the
necessity for information regarding evapotranspiration in Pará state, in order to support
the proper management of water, and to provide information for growth prediction and productivity models of this crop in the region.
The uncoupling factor (Ω) indicates the biosphere-atmosphere interaction in the plant evapotranspiration processes (SILVA et al., 2012). It
allows one to distinguish the factors that influence the exchange of water vapor with the atmosphere. In other words, the coupling degree between a leaf and
the atmosphere determine what controls the transpiration rate, which might be the relation between the vapor pressure deficit and stomatal conductance or the irradiation balance.
The evapotranspiration (ETc) can be determined by direct and indirect methods. The lysimeter method is the oldest method (MARQUES et al., 2015), of which the weighing lysimeter is considered the most accurate; however, it is also the most expensive. The drainage lysimeters have advantages when compared to the water balance method in the field as the volume of vegetated soil is properly insulated and therefore, all inputs and outputs of water in this system are controlled (SANTOS et al., 2009). However, the isolation of plants can interfere with the water consumption, growth and development in comparison with field conditions.
The crop coefficient (Kc) is related to environmental and physiological factors of plants.
Thus, the performance of experiments that seek the determination of Kc at the regional scale is quite
significant. Experimental values of Kc for the cowpea are found in the literature for the northeast of
Pará (AGUIAR; LEÃO; SAUNDERS, 1992); however, the authors relied on the variation of soil moisture content to estimate the water consumption.
Additionally, they obtained the reference evapotranspiration (ETo) data from the data of a
Class A Tank.
No studies are available relating to cowpea water demand in Pará state over a three-year period.
In addition, there is no technical or current information available regarding the evapotranspiration obtained through the lysimeter
method, which is considered by many authors as a standard tool due to its precision (SANTOS et al., 2009; MARQUES et al., 2015; BASTOS et al., 2008). Therefore, this study aims to determine the
water demand, the crop coefficient and the uncoupling factor during the different development
stages of cowpea at the northeast of Pará.
MATERIAL AND METHODS
The field experiment was carried out at the Experimental Site of the Federal Rural University of Amazon that is situated in the city of Castanhal-PA,
(1°19'24.48"S; 47°57'38.20"W). The regional climate, according to the Koppen classification, is Af
(wet equatorial climate). The maximum and minimum temperatures are 35 and 18°C, with an
average annual temperature of 26°C. The maximum and minimum relative humidity is 95% a 79%, respectively, and the average annual rainfall is around 2571.6 mm. However, 35% of the rain is
concentrated during the months of January, February, and March, and this trimester is
characterized as the rainiest. The less rainy trimester covers the months of July, August, and September with 16% of total rainfall. Finally, the least rainy
month is September, which presents only 4% of all precipitation.
The experiment was executed in 2013, 2014 and 2015 during September and November in an area
of 3.168 m². The physical soil analysis was performed in the soil laboratory of EMBRAPA
Eastern Amazon. The results indicated a sandy texture, in which 56% is sand, 16% is thicker sand, 12% is silt, and 16% is clay. The wilting point (WP) and field capacity (FC) data were obtained in a laboratory. They were determined from undeformed soil samples using a Richard’s pressure chamber. For 2013, 2014 and 2015 the WP and FC values were 0.11, 0.10, 0.11 m3 m-3 and 0.20, 0.22, 0.21 m3 m-3, respectively.
Manually, 13 to 15 seeds were sown per running meter. Subsequently, they were thinned out, totaling 10 plants per running meter with spacing of 50 cm between rows. The soil chemical analyses during the first year of study indicated: N 0.04 %; P 1 mg.dm-3; K 12 mg.dm-3; Na 10 mg.dm-3; Ca+ 0.5 cmol
c dm-3; Ca++ Mg 0.8 cmolc dm-3; Al 0.5 cmolc dm-3, and pH (H2O) was 4.9 for the first
year of the experiment. During the second year of the
Rev. Caatinga
P 10 mg.dm-3; K 9 mg.dm-3; Na 2 mg.dm-3; Ca+ 1.4 cmol
c dm-3; Ca++ Mg 2.1 cmolc dm-3; Al 0.4 cmolc dm-3 and pH (H2O) of 4.6. Finally, in
the third year of the experiment analyses showed: N 0.05 %; P 2 mg.dm-3; K 11 mg.dm-3; Na 6; Ca+ 0.5 cmol
c dm-3; Ca++ Mg 0.8 cmolc dm-3; Al 0.8 cmolc dm-3 and pH (H2O) of 4.9.
Fertilizer was added following the guidelines
of the soil laboratory of EMBRAPA Eastern Amazon, who recommended N:P:K proportions of
0:60:45, 0:40:45, and 0:60:45 kg ha-1 for the first,
second, and third year of the experiment, respectively.
During the experiment, cultural practices were executed in order to keep the area free of weeds, diseases, and pests. The cultivar used was the BR3-Tracuateua as it has an indeterminate growth habit and a cycle of 60 to 70 days. Additionally, it is
the most recommended cultivar for the edaphoclimatic conditions of northeastern Pará
(FREIRE FILHO et al., 2009).
Two meteorological stations were installed at the experimental site to measure: temperature and air humidity on two levels (2.0 m above ground and 0.5 m above the crop canopy); rainfall; solar irradiation; wind speed; and soil moisture. The
height of the plant was evaluated daily, focusing on the calculation of the aerodynamic conductance. This sampling was completely randomized and consisted of eight repetitions within a running meter of plants, as well as through the phenological development. We used the scale proposed by Gepts and Fernandez (1982), wherein the following steps are considered: V0 (germination); V1 (cotyledon above ground); V2 (expanded cotyledons); V3 (first trifoliate leaf); V4 (third trifoliate leaf); R5 (first flower bud); R6 (anthesis of the first flower); R7 (first pod); R8
(grain filling) and, finally, R9 (physiological maturation).
The analysis of leaf area was achieved
through the random sampling of 10 plants in a running meter of the planted lines in which the lysimeters were installed. The leaf area was obtained by collecting three leaf disks per plant, totaling 30 disks per sample. The samples of the disks were carefully collected from the middle third of the fully expanded central leaflet. Thus, the leaf area index (LAI) was estimated basing on these measures and the dry weight of the sampled leaves (BENINCASA, 2003).
The thermal need was calculated for each phenological stage of the crop, according to the theory of degree days (DD) or heat time. Daily values of DD were calculated by Equation 1 described by Ometto (1981) due to its coverage of thermal conditions during the experiment period.
Tb < Tmin; Tmax < TB
(1) ) min ( 2 min max Tb T T T
DD
where DD is the thermal sum in degree days;
Tmax and Tmin are maximum and minimum air temperature on a daily scale (°C), respectively; Tb is
lower basal temperature of the culture below which the development is greatly reduced. In this study we considered the Tb to be 9°C and TB to be 38°C (FARIAS et al., 2015).
Daily values of ETo were calculated by the Penman-Montheith FAO 56 method (ALLEN et al., 1998). The data were obtained from an automatic meteorological station run by National Institute of
Meteorologyin Castanhal, which is located approximately 3 km from the experiment site.
The Kc values were determined via the following equation (DOORENBOS; PRUITT,
1977):
(2) where the Kc is crop coefficient, the ETc is
crop evapotranspiration and the ETo is reference evapotranspiration.
The ETc was monitored daily by the direct method. Four identical drainage lysimeters were installed at the leeward end of the experiment site. Each lysimeter had a volumetric capacity of 500 L and were built from plastic water tanks shaped like truncated cones with the following measurements: upper and lower diameters of 1.20 m and 0.98 m, respectively; and, a depth of 0.60 m, similar to the works of Marques et al. (2015) and Santos et al. (2009).
Upon installation of the lycimeterl, the soil was separated in layers and classified as dystrophic Yellow Oxisol. Manually, the soil was dug to a depth of 60 cm and subsequently divided into four layers of 15 cm. In each layer, soil samples were collected for physical characterization in order to maintain as
much as possible the conditions and baseline characteristics of the soil in the lysimeters. Subsequently, by placing the soil layers in the order
reverse to their removal, the tanks were filled. After that, each placed layer of soil was compressed slightly to allow greater accommodation in the tanks. It is worth noting that this procedure was performed with dry soil, thus preventing further compression of the layers.
The drainage system of the lysimeters was the gravitational type, consisting of a PVC drain with a 25 mm diameter, linked to an observational and collection well of the daily drained volume of 1.5 m depth (MARQUES et al., 2015). The order of the free drainage system in the bottom of the tank was as follows: 5 cm of crushed stone; the 25 mm diameter
PVC tubing, in the form of a rectangle and perforated at the top and side with 5 cm-spaced holes; another crushed stone layer of 15 cm; and finally, a geotextile mantle of polyester to prevent possible clogging of the drainage holes.
After a period of ten days, 13 seeds were
ETo
ETc
Rev. Caatinga
sown per running meter. Then, they were thinned out, totaling 10 plants per running meter and 20 plants in each lysimeter.
Irrigation was carried out daily. Water was applied until field capacity (FC) was reached for each lysimeter and its surroundings to ensure water content replacement. The water replacement was performed as to provide a corresponding drainage blade of about 10 to 15% of the applied water blade, according to Pereira, Villa Nova and Sediyama (2013). The drip irrigation method was performed with an average flow measured in the field of 0.605 L/h-1 per dripper for a 3 mca pressure. The soil
moisture was monitored by Time Domain Reflectometry (TDR) technique to 30 cm depth.
Initially, a TDR calibration process was performed that consisted of obtaining daily assessments of the apparent dielectric constant of the soil (ka) and the corresponding volumetric water content (θ). Thus, making it possible to obtain linear regression equations.
The ETc was estimated in the lysimeters through the application of the water balance to a soil volume control (SANTOS et al., 2009).
(3) where P is precipitation, I is irrigation, D is drainage, and ETc is crop evapotranspiration. In this experiment, the capillary ascension and runoff were not considered.
The uncoupling factor proposed by Jarvis and McNaughthon (SILVA et al, 2012) was applied in order to assess the sensitivity of evapotranspiration by the cowpea to climatic or biological control for the study area (Equation 4):
(4)
where (kPa °C-1) is the curve of the slope of
saturation vapor pressure versus temperature;
(kPa °C-1) is the psychrometric coefficient; and
and are aerodynamic and surface conductance (m s-1), respectively.
When the uncoupling factor is equal to or
close to 0, the biotic control over the evapotranspiration is dominant. On the other hand,
when it is close to 1, external conditions are prevailing in the process.
The aerodynamic conductance was estimated according to Allen et al. (1998) and the stomatal conductance to water vapor was estimated through
D
I
P
ETc
ga gc
.
γ
Δ
Δ
γ
1
ag
cg
Equation 5, which was adjusted and validated for cowpea using data measured in the field:
(5)
(6) where z is a weighting factor that depends on the product of the meteorological variables, Tar is air temperature (°C); DPV is vapor pressure deficit, and Sin is incident global solar irradiation (MJ m-2 day-1).
The leaf conductance data used for generating the equation were measured using a porometer (AP4 type Delta-T Devices brand) on days predefined by phenological phases of cowpea: V4 (20 days after seeding(DAS)), R5 (32 DAS), R8 (48 DAS) and R9 (55 DAS). The measurements were carried out in the
daytime, between 8 a.m. and 4 p.m. at hourly intervals.
Variance analysis was applied to ETc data of the four lysimeters and on ETc data between the cycles. The variables Kc and accumulated degree days, Kc and LAI were submitted to the variance analysis based on adjustments described by Gaussian functions (SOUZA et al., 2015), according to their significance determined by the F-test.
RESULTS AND DISCUSSION
Throughout the experiment period, the average air temperature remained near the regional
normal climate average for the respective period (28° C) along the cycle. However, in 2015, there was a lower temperature range due to the presence of El Niño (GRIMM, 2015) that consequently led to a lower wind speed. Additionally, it caused a reduction in rainfall amount during the experiment and increased the global solar irradiation, which resulted from the decrease in cloudiness and reduction in relative humidity, which also led to an increase in the ETo. It can be observed that during 2015 ETo and ETc values were greater compared to those in 2013 and 2014.
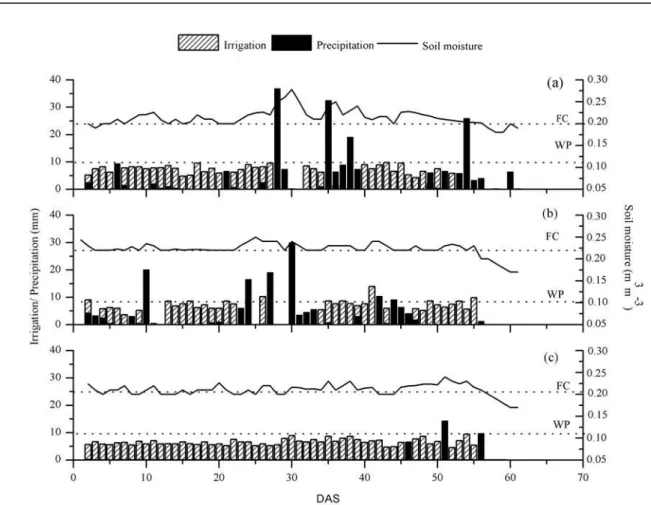
The total rainfall observed during the experiment in 2013 was 207.51 mm. On the other
hand, in 2014 and 2015 the total rainfall was 160 mm and 30.73 mm, respectively. The reduction registered in 2015 corresponds to a value of approximately 80% of the historical average. In spite of this difference in the rainfall regime between the experiment years, the water supply for the irrigation system substituted the rainfall events throughout the experimental period and kept the crops at elevated soil moisture conditions (Figure 1). On days when there was no precipitation, the irrigation was applied at the end of the day until FC was reached.
46
*
755
1
z e p ze
gf
Sin
DPV
Tar
Rev. Caatinga
Figure 1. Irrigation (mm), precipitation (mm) and soil moisture (m3 m-3) throughout the cowpea cycle (Vigna unguiculata
L. Walp) in 2013, 2014, and 2015, under the climatic conditions of Castanhal City in Pará state.
The productivities of the cowpea were 2657.98 kg/ha, 2602.12 kg/ha and 2219.35 kg/ha in 2013, 2014, and 2015, respectively. The total water consumption of cowpea during the cycles were 246.98 mm, 248.89 mm and 306.98 mm in 2013, 2014, and 2015, respectively. The difference in the
third year is noteable. On average, the water consumption was 267.73 mm ± 10.21 mm, and the
average daily evapotranspiration was 3.7 mm ± 0.2 mm. These average values differ from those
obtained by Aguiar, Leão and Saunders (1992), who reported amounts of 305.7 mm (water consumption)
and 4.4 mm day-1 (evapotranspiration) to cultivate Manteguinha in the northeast of Pará state. Nonetheless, these values are close to the ETc of the
third year.
The total water blade applied in the three-year experiment, through irrigation and rain, averaged 407.94 mm ± 20.13 mm. Through comparison between the cumulative evapotranspiration and the water content in the same period, it is noticeable that
the culture did not undergo water limitation.
Contrastingly, it received an extra drained water blade of 140.21 mm ± 5.10 mm over the respective period. It is noteworthy that the sandy soil texture promoted the occurrence of water loss by drainage.
June is commonly the month of cultivation in the region. The experiment was conducted in the least rainy period in order to have greater control of water inputs. Therefore, it can be stated that the rainfall pattern is undoubtedly the main reason for the low production observed. In spite three-years of data, it is very clear that the standard deviation between the registered total rainfall amounts is large.
Rev. Caatinga
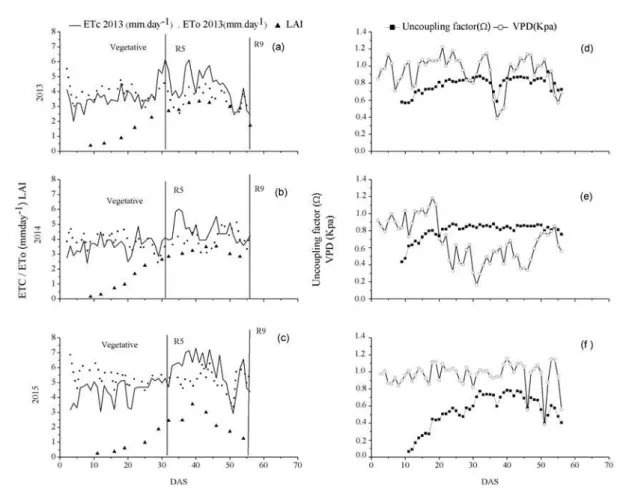
Figura 2. Crop evapotranspiration (ETc) of the cowpea, reference evapotranspiration (ETo) and LAI on 2013 (a), 2014 (b) and 2015 (c). Uncoupling factor (Ω) and vapor pressure deficit (VPD) of cowpea in 2013 (d), 2014 (e), and 2015 (f) under the climatic conditions of Castanhal City, Pará state.
Between 25 and 50 DAS a different pattern between ETc and ETo is noticeable. This coincides with the phases of growth, flowering, and grain filling and reaches maximum values of about 6 mm day-1. This is a result of the transpiration increase due to the LAI growth. Additionally, the increase of the land cover fraction led to a consequent decrease in soil evaporation as the exposed land portio decreased. In this period, the water demand is the greatest; therefore, a strict control of water supply is quite necessary. It can be done either by an irrigation system or the well utilization of rainfall in order to optimize the
development of cowpea crop satisfactorily.
The average maximum LAI was 3.5 ± 0.08, and took about 40 DAS to develop. Then, it remained close to this value over most of the reproductive phase (Figure 2). The maximum water
consumption accompanied the increasing trend of the LAI, in agreement with the results of Bastos et al. (2008).
After 50 DAS, the ETc declined again due to the partial senescence of crop leaves. On the other hand, the atmospheric demand, which is represented by the ETo, remained high, with an average water consumption of 4.52 mm day-1.
Considering the growth stages of the cowpea, it is noticeable that the reproductive period (flowering (R5) and grain filling (R8)) is the phase with the greatest demand for water with an average consumption of 4.55 mm day-1, which is similar to
the results presented by Lima et al. (2011). Therefore, the occurrence of water scarcity near the
flowering phase can reduce the vegetative growth, which limits production. There are cases in which the grain productivity can be severely reduced if the water supply is not sufficient during the reproductive period (ENDRES et al., 2010).
The Ω was estimated in order to distinguish the susceptibility of crop evapotranspiration to physical variables and physiological factors (Figures 2d, 2e, 2f). The average daily value of Ω was 0.38 at the beginning cycle when the LAI of cowpea was around 0.9 ± 0.1. The low initial values of Ω indicate
that the VPD has a greater influence on vapor transfer of water to the atmosphere, as it is associated
with the prevalent stomatal control of the plant. However, it does signify greater evaporation from the soil than transpiration due to the low LAI.
Rev. Caatinga
dependent on the net irradiation received and less dependent on stomatal control and VPD. Regarding the soil surface covered by vegetation, the process of transpiration exceeded the evaporation directly from the soil. This was also observed by Nassif, Marin and Costa (2014) in sugarcane cultivation.
Between 20 and 50 DAS the Ω values were 0.8 on average, specifically in the years 2013 and 2014. This suggests a low interaction between the vegetative canopy and the atmosphere, and thereby
that the greatest contribution to the evapotranspiration was due to the energy input in the
form of irradiation as a large amount of water kept the leaf stomatal conductance at high levels during the experiment. Therefore, this demonstrated that the
stomatal control had a secondary role on gas exchange between the surface and the atmosphere in
this cycle period.
During the cowpea cycle, the average Ω
ranged from 0.54 (2015) to 0.72 (2013) and 0.74 (2014), which indicates that the cowpea culture does not fully uncouple from the atmosphere under the prevailing climatic conditions in the northeast of
Pará state. In years when the rainfall regime is negatively affected, such as in 2015, a greater stomatal control of cowpea near the 30 DAS could
be noted. This is different in comparison to previous years when the rainfall regime was superior and, consequently, caused the uncoupling of the canopy from the atmosphere at 10 DAS, with Ω values greater than 0.6.
The moisture in the soil remained close to the FC during the three experimental years as a result of irrigation (Figure 1). However, on 2013 and 2014, when there were higher occurrences of rainfall
events, a greater coupling is observed and dependence on stomatal control is evident at the beginning of the cycle in the 2015 experiment. Souza et al. (2015) also observed the effect of rainfall events on canopy uncoupling in the Caatinga, which occurred in virtue of increases in the Ω value.
Nassif, Marin and Costa (2014) noticed that the Ω values for sugarcane at Piracicaba, São Paulo, were lower than the values found by Silva et al. (2012) for the same irrigated crop in the northeast of Brazil. Thus, the availability of energy to this culture has a greater contribution on evapotranspiration in hot and dry regions than in cold and humid regions. Accordingly, wind speed and vapor pressure deficit have a greater control on the crop evapotranspiration in the latter case. According to the Ω values obtained at the experimental site, it can be stated that the evapotranspiration of cowpea subject to dripping
irrigation is more influenced by the energy availability than stomatal and DPV control.
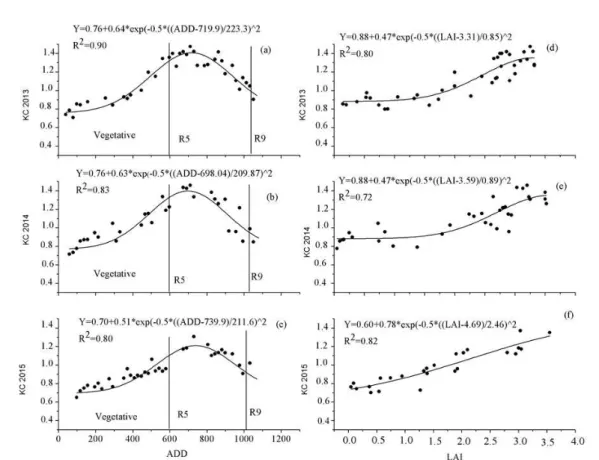
The Kc values obtained for cowpea are shown in Figure 3. The Kc presented high correlation
(R2 > 0.8) to the accumulated day degrees variable and the LAI, thus resulting in adjustments described by Gaussian functions similar to those found by Souza et al. (2015). The shape of the Kc curve represents changes in vegetation and soil cover over
the growth and maturation of the cowpea, which affect the relationship between ETc and ETo. The parameters of the Gaussian functions that promote an asymmetry in curve towards the right (Figures 3a, 3b, 3c) are 719.9, 698.04, and 739.9, respectively. In other words, these parameters indicate from which accumulated degree days the Kc begins to decline. Therefore, if the cowpea achieves the degree days in a shorter period, the trend of the curve will become more sinuous, and then Kc decreases faster.
The presented crop coefficients, in relation to
the number of days after sowing, might lead to erroneous estimates of water demand in different
regions during phenological phases or the entire crop cycle. This is possible due to the variation in the development cycle caused by climatic factors, especially the temperature.
A close relationship between the Kc and the LAI in all the experiments is ascertained. However, a better explanation is provided by analyzing the equations related to the accumulated degree days,
starting with the highest coefficients of determination (R²). Generally, the coefficients for
LAI determination were also considered satisfactory. This demonstrates that both functions can be used for the regional estimation of Kc. The results suggest
that the Kc has a better correlation to thermal indices, such as the accumulated degree days, than
the growth parameters of the culture, like the LAI. Possibly, it is due to the strong dependence of Kc on the period of phenological phases, which also depend on local climatic conditions.
Satisfactory models correlating Kc values as a function of accumulated degree days have been previously cited for the cowpea (DETAR, 2009) and for the Carioca bean (MEDEIROS et al., 2004). The latter authors obtained highly significant relations between basal coefficient of culture (Kcb) and degree days for the cultivation in a lysimeter of constant groundwater level. Marques et al. (2015) also observed better Kc adjustments regarding the accumulated degree days than the vegetation cover index for a basil culture over drainage lysimeters.
At the initial stage, which is from emergence until 15 DAS (V4), the Kc presented an average value of 0.8 for all of the three years. This value reflects the direct influence of evaporation from the soil (frequently irrigated) due to low LAI values (Figure 2) and high stomatal control of the process, which are represented by low values of Ω
Rev. Caatinga
Figure 3. Relationship between the crop coefficient (Kc), the accumulated degree-days (ADD) and the leaf area index
(LAI) represented by Gaussian functions and their coefficients of determination (R²) under the climatic conditions of Castanhal City in Pará state. Vertical lines indicate the occurrence of phenological phases.
This value is close to other results reported in the literature for this culture, such as those observed
by Bastos et al. (2008) for the conditions of the Gurguéia-Piaui Valley, and to the value suggested by
Allen et al. (1998). On the other hand, our result is bigger than the Kc obtained by Souza et al. (2015), who identified a value of 0.68 for the vegetative phase (30 days), and lower than the Kc value (0.99) found by Lima et al. (2011). However, factors like the frequency of irrigation and the cultivar itself may have contributed to these differences, and this must be considered.
The Kc reached its maximum value of 1.4 ± 0.09 around 40 DAS (750 accumulated degree-days), which corresponds to the R7 stage
(first pod). However, it did not reach stabilized water consumption as suggested by Allen et al. (1998) for the culture of the common bean. This is due to the indeterminate growth habit of cowpea, which continues to produce new leaves, even after flowering. Souza, Bezerra and Teofilo (2005) also
observed this detail. Similar Kc values (1.1 to 1.4) for this stage were obtained by Bastos et al. (2008) for the variety BR-17, Gurguéia, by Souza, Bezerra and Theophilus (2005) for the cultivar Setentão (1.35) and by Souza et al. (2015) for the cultivar Pujante, which was grown in conjunction with corn (1.3).
According to Allen et al. (1998), the maximum value of Kc for the common bean is 1.15.
However, Medeiros et al. (2004) obtained Kc values
up to 1.7. These authors cite the meteorological conditions in the period and the crop growth beyond the edges of the lysimeters as determining factors for the trend of increasing the value of Kc.
The Kc obtained in this study for the reproductive stage was higher than those reported by
Aguiar, Leão and Saunders (1992) in the northeast region of Pará. This is due to the different methods adopted, such as cultivar selection; as the ETc can be influenced by stomatal characteristics, leaf anatomy, aerodynamic properties and albedo (ALLEN et al 1998).
In the final stage, after 50 DAS (900 accumulated degree days), there is a sharp drop in
Kc values caused by the senescence of the plant leaves. It is noticeable that according to the LAI variation (Figure 2a, 2b, 2c) this variable has an average value of 0.8 at the physiological maturity stage (R9).
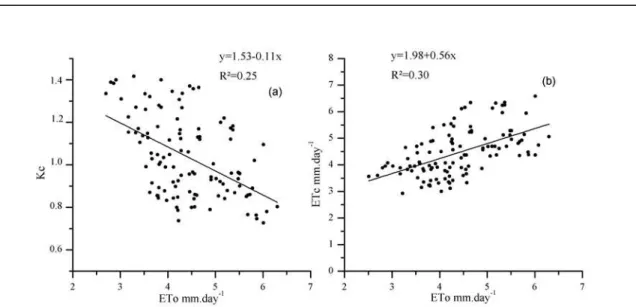
The Kc decreases in relation to high ETo values (Figure 4), even if soil moisture is high. In addition, the results of Flumignan et al. (2011) and
Rev. Caatinga
Figure 4. The relation between crop coefficient (Kc) and reference evapotranspiration (ETo) (a), and between crop evapotranspiration (ETc) and ETo (b).
A linear relationship was observed between the ETc and ETo (Figure 4b), which indicates an increase of internal resistance to the transport of water from the plants when under conditions of high atmospheric demand. The results reported by Nassif, Marin and Costa (2014) showed the conductance response (gs) to air temperature, solar radiation and vapor pressure deficit: the gs decreases with the increase of ETo.
Under conditions of high available energy, wind speed and VPD, which normally occur when the ETo exceeds 4.0 mm day-1, it can be expected that some species with high stomatal resistance do not respond directly to the water demand in the atmosphere. However, it is noticeable that the decrease in the transpiration rate under elevated atmospheric demands was compensated due to the fact that the crop evapotranspiration became less
dependent on atmospheric conditions and the irradiation balance became the main contributor to
this process, as it can be seen by the Ω values. It is noteworthy that the methodology applied in the determination of ETc and ETo values were different from those used in some of the works cited. It proves the importance of obtaining accurate and regionalized values of ETc and Kc in order to achieve real effectiveness in the management of local irrigation.
CONCLUSION
The total water consumption of cowpea averaged 267.73 ± 10.21 mm, or 3.7 mm ± 0.2 mm
day-1.
The Ω ranged, on average, from 0.54 (2015), to 0.72 (2013) and 0.74 (2014) during the cowpea cycle. This indicates that the cowpea crop does not fully decouple from the atmosphere under the climatic conditions in the northeast of Pará.
The cowpea Kc averaged 0.8 in the vegetative phase, reaching 1.4 during the reproductive phase, and finally, in the final stage attaining a mean value of 0.5.
The Gaussian model presented an excellent fit for the estimation of the Kc values of cowpea in relation to accumulated degree days and the LAI.
ACKNOWLEDGEMENTS
We thank the National Counsel of Technological and Scientific Development (CNPq,
Brazil) for its financial support to this research
through the Universal Project (process n° 483402/2012-5) and the stipend of research
productivity of the last author. In addition, we acknowledge the Coordination for the Improvement of Higher Education Personnel for its concession of a doctorate stipend to the first author.
REFERENCES
AGUIAR, J. V.; LEÃO M. C. S.; SAUNDERS L. C. U. Determinação do consumo de água pelo caupi (Vigna unguiculata (L.) Walp) irrigado em Bragança – Pará. Ciência Agronômica, Fortaleza, v. 23, n. 2, p. 33-37, 1992.
ALLEN, R. G. et al. Crop evapotranspiration: Guidelines for computing crop water requirements. 56. ed. New York: Rome:FAO, 1998. 299 p. (FAO Irrigation and Drainage Paper 56.)
Rev. Caatinga
BENINCASA, M. P. Análise de crescimento de plantas: noções básicas. 2. ed. Jaboticabal, SP: Funep. 2003.41 p.
BRASIL. Secretaria Executiva de Agricultura do Estado do Pará. Dados Agropecuários. Disponível
em: <http://www.sagri.pa.gov.br/>. Acesso em: 10 de Jun. 2015.
DETAR, W. R. Crop coefficients and water use for cowpea in the San Joaquin Valley of California. Agricultural Water Management, Amsterdan, v. 96, n. 1, p. 53-66, 2009.
DOORENBOS, J.; PRUITT, W. O. Guidelines for predicting crop water requirements. 24 ed. New York: Rome: FAO, 1977. 194 p. (FAO. Irrigation and Drainage Paper, 24).
ENDRES, L. et al. Gas exchange alteration caused by water deficit during the bean reproductive stage. Revista Brasileira de Engenharia Agrícola e Ambiental, Campina Grande, v. 14, n. 1, p. 11-16, 2010.
FARIAS, V. D. S. et al. Temperaturas basais e necessidade térmica para o ciclo do feijão caupi. Enciclopédia Biosfera, Goiânia, v. 11, n. 21, p. 1781-1792, 2015.
FLUMIGNAN, D. L. et al. Evapotranspiration components and dual crop coefficients of coffee trees during crop production. Agricultural Water Management, Netherlands, v. 98, n. 5, p. 791-800, 2011.
FREIRE FILHO, F. R. et al. BRS Milênio e BRS Urubuquara cultivares de feijão-caupi para a região Bragantina do Pará. Revista Ceres, Viçosa, v. 56, n. 6, p. 749-752, 2009.
GEPTS, P.; FERNÁNDEZ, F. Etapas de desarrollo de la planta de fríjol común (Phaseolus vulgaris L.). Colômbia: CIAT. 1982. 10 p.
GRIMM, A. M. El Niño, novamente!. Revista Brasileira de Meteorologia, São José dos Campos, v. 30, n. 4, p. 351-357, 2015.
LIMA, J. R. S. et al. Balanço de energia e evapotranspiração de feijão caupi sob condições de sequeiro. Revista Ciência Agronômica, Fortaleza,
v. 42, n. 1, p. 65-74, 2011.
LOPES, G. da S et al. Preferência para oviposição e ciclo de vida de mosca-negra-dos citros Aleurocanthus woglumi Ashby em espécies frutíferas. Revista Brasileira de fruticultura, Jaboticabal, v. 35, n. 3, p. 738-745, 2013.
MARIN, F. R. et al. Crop coefficient changes with reference evapotranspiration for highly canopy-atmosphere coupled crops. Agricultural Water Management, Netherlands, v. 163, n. 1, p. 139-145, 2016.
MARQUES, P. A. A. et al. Consumo hídrico do manjericão por meio de lisímetro de drenagem. Irriga, Botucatu, v. 20, n. 4, p. 745-761. 2015.
MEDEIROS, G. A. et al. Crescimento vegetativo e coeficiente de cultura do feijoeiro relacionados a graus-dia acumulados. Pesquisa agropecuária brasileira, Brasília, v. 35, n. 9, p. 1733-1742, 2004.
NASSIF, D. S. P.; MARIN, F. R.; COSTA, L. G. Evapotranspiration and Transpiration Coupling to the Atmosphere of Sugarcane in Southern Brazil: Scaling Up from Leaf to Field. Sugar tech, Lucknow, v. 16, n. 3, p. 250-254, 2014.
OMETTO, J. C. Bioclimatologia vegetal. 1. ed. São Paulo, SP: Agronômica Ceres, 1981. 425 p.
PEREIRA, A. R.; VILLA NOVA, N. A.; SEDIYAMA, G. C. Evapotranspiração. Piracicaba, SP: Fealq, 2013. 31 p.
SANTOS, F. et al. Determinação do consumo hídrico da cenoura utilizando lisímetros de drenagem, no agreste pernambucano. Revista Brasileira de Ciências Agrárias, Recife, v. 4, n. 3, p. 304-310. 2009.
SILVA, T. G. F. et al. Fator de desacoplamento em um canavial irrigado no submédio do vale do São Francisco. Revista Brasileira de engenharia agrícola e ambiental,Campina Grande, v. 16, n. 8, p. 849-858. 2012.
SOUSA, A. M. L. et al. Variabilidade Espaço -Temporal da Precipitação na Amazônia Durante Eventos Enos. Revista Brasileira de Geografia Física, Recife, v. 8, n. 1, p. 13-24. 2015.
SOUZA, L. S. B. et al. Balanço de energia e controle biofísico da evapotranspiração na caatinga em condições de seca intensa. Pesquisa agropecuária Brasileira, Brasília, v. 50, n. 8, p. 627-636, 2015.
SOUZA, L. S. B. et al. Requerimento hídrico e coeficiente de cultura do milho e feijão-caupi em sistemas exclusivo e consorciado. Revista Caatinga, Mossoró, v. 28, n. 4, p. 151– 60, 2015.
Rev. Caatinga