http://dx.doi.org/10.1590/1806-9061-2016-0228
Pelletized Feed in Broiler Diet
Author(s)
Cheah YSI,III
Loh TCI,II
Akit HI
Kimkool SIII
I Department of Animal Science, Faculty
of Agriculture, Universiti Putra Malaysia, 43400 UPM Serdang, Malaysia
II Institute of Tropical Agriculture, Universiti
Putra Malaysia, 43400 Serdang, Selangor, Malaysia
III Department of Feed Technology, Charoen
Pokphand Holdings, 42000 Port Klang, Ma-laysia
Mail Address
Corresponding author e-mail address T.C. Loh
Department of Animal Science, Faculty of Agriculture, Universiti Putra Malaysia, 43400 UPM Serdang, Malaysia Tel: 603-8947-4814 Email: [email protected]
Keywords
Emulsifier, Feed intact form, Pellet durability index, Pellet quality, Starch gelatinization.
Submitted: February/2016 Approved: September/2016
ABSTRACT
A feed production trial was conducted to study the effect of synthetic emulsifier and natural biosurfactant the process and quality of pelletized broiler feed. A corn-soy based broiler diet was formulated with fixed ratio 2:1 of oil-to-water with two types of emulsifiers, namely glyceryl polyethylene glycol ricinoleate synthetic emulsifier and lysophosphatidylcholine natural biosurfactant. T1: Basal diet with no water and no emulsifier; T2: Basal diet with water and no emulsifier; T3: Basal diet with water and synthetic emulsifier glyceryl polyethylene glycol ricinoleate; T4: Basal diet with water and a natural biosurfactant lysophosphatidylcholine as comparative treatment. The treatment diets were manufactured by a commercial feed mill. The electricity cost and meal temperature were measured during the process of milling. Composite samples were collected from different processed points, tested for physical properties, chemical stability and biostability of pelletized feed. Pellet quality of emulsifier supplemented diets was significantly (p<0.05) improved in crumble and pellet intact form. Correlation between emulsifier and pelletize processed cost was not observed in this present study. No deteriorate effect was observed in hydrolytic rancidity (AV), oxidation rancidity (PV), mold count, moisture content and water activity. However, percentage of starch gelatinization on pelletized feed was significantly (p<0.0001) improved in both
types of emulsifier treated diets. These results demonstrated that the addition of emulsifier to broiler diet improved pellet quality to some extent although significant difference between synthetic emulsifier and natural biosurfactant was not observed.
Abbreviations: AV, acid value; PV, peroxide value; amp, ampere; vol, voltage; T/h, tonne per hour; kW, kilowatt; Aw, water activity; PDI, pellet durability index
INTRODUCTION
Alongside with the rise of ingredient price and energy cost, feed formulation highly affected the shrinking of profit margin. Inclusion of the cheapest energy source from high density oils and fats becomes
a common practice by many nutritionists (Buchanan et al., 2010).
However, inclusion of more than three percent of oil may have a
negative impact in feed manufacturing (Attawong et al., 2014). It
tends to produce low quality feed with soft pellet and low durability (Cavalcanti & Behnke, 2005). Process of pelletizing broiler feed, requires inclusion of steam at conditioning process (CPM California Pellet Mill Co.). However, steam and oil are not compatible between phases during feed milling. Moritz et al. (2002) demonstrated that pellet quality do
becomes a common phenomenon in most regions of the country as to compromise the feed mill efficiency and cost margin in feed formulation (Buchanan et al.,
2010). Concept of emulsifier supplementation was introduced into feed industry as latest technology to improve in feed quality (Ziggers, 2012). Emulsifier possesses properties which are capable of reducing the interfacial tension between two immiscible phases of oil and water (Hasenhuettl & Hartel, 2008). Steam penetration of conditioner during feed process is expected to be achieved, leading to feed quality improvement. Application of emulsifier has been expected to improve the feed process´ efficiency and feed quality. However, not many researches have been conducted on emulsifier technology in pelletized poultry feed. Thus, the objective of this study was to identify the effectiveness of synthetic emulsifier glyceryl polyethylene glycol ricinoleate compared with
biosurfactant lysophosphatidylcholine in feed process and quality of pelletized broiler feed.
MATERIAL AND METHODS
Diet treatment and design
A corn-soy based diet was formulated by the least-cost Brill feed formulation software (Feed Management Systems, Inc.), meeting the nutritional recommendations of Cobb 500 (Cobb-vantress, 2015). The composition of ingredients and analyses of nutrient contents for starter and grower diets were presented in Tables 1 and 2, respectively. A 2-phase feeding program was adopted; starter crumble feed (1-14 days) and grower pellet feed (15-35 days). All diets were isocaloric, isonitrogenous and contained similar digestible amino acid percentages. Total oil inclusion, as formulated by least-cost formulation,
Table 1 – Ingredients of starter diet formulation
Ingredient Units Starter Diet, 1-14 days
Treatment 1 Treatment 2 Treatment 3 Treatment 4
Corn meal % 43.921 43.921 43.831 43.871
Soybean meal 46% % 42.271 42.271 42.271 42.271
1Crude palm oil @ mixer % 2.000 2.000 2.000 2.000
2Crude palm oil @ post pelleting % 4.450 4.450 4.500 4.450
Rice bran % 2.190 2.190 2.190 2.190
Corn gluten meal 60% % 0.500 0.500 0.500 0.500
Di-calcium phosphate 18% % 1.784 1.784 1.784 1.784
Limestone % 1.109 1.109 1.109 1.109
Salt % 0.310 0.310 0.310 0.310
DL-methionine 99% % 0.308 0.308 0.308 0.308
3Premix % 0.800 0.800 0.800 0.800
Sodium bicarbonate % 0.220 0.220 0.220 0.220
L-Lysine 78% % 0.070 0.070 0.070 0.070
Choline chloride 75% % 0.050 0.050 0.050 0.050
L-Threonine 98.5% % 0.018 0.018 0.018 0.018
4Synthetic emulsifier % - - 0.050
-5Natural biosurfactant % - - - 0.050
Water % - 1.000 1.000 1.000
Analysed composition
6GE kcal/kg 4,155 4,162 4,159 4,168
Dry matter % 89.0 88.4 88.2 88.9
Crude protein % 24.2 24.4 24.5 24.3
Calcium % 0.98 0.97 0.99 0.98
Total phosphorus % 0.79 0.78 0.77 0.78
Lysine % 1.41 1.43 1.42 1.43
Methionine % 0.58 0.57 0.57 0.58
1Crude palm oil added during mixing process 2Crude palm oil added after pelleting process
3Supplied per kg of diet: Fe 40 mg; Zn 100 mg; Mn120 mg; Cu 20 mg; Se 0.3 mg; vitamin A 12kIU; vitamin D 4.4kIU; vitamin E 57 mg; vitamin K 2.8 mg; vitamin B
13.06mg; vitamin B26.72 mg; vitamin B6 5.49 mg; vitamin B12 0.028 mg; niacin 67.3 mg; folic acid 1.33 mg; pantothenic acid 14.8 mg; biotin 0.26 mg; ethoxyquin 100 mg; growth promoter 140 mg; anticoccidial 200 mg; mold inhibitor 500 mg.
4Each 1 kg contains 100% glyceryl polyethylene glycol ricinoleate(Bredol®, Akzo Nobel, Sweden) 5Each 1 kg contains 250 g lysophosphatidylcholine (LysoforteTM, Kemin Industries)
was added into feed milling through mixing process and post pelleting spray. Two percent of oil was added into the mixer while the remaining percentage of the oil was added during post pelleting spray. Treatment 1 consisted of basal diet with 2% of oil added into the mixer prior to pelleting; Treatment 2 consisted of basal diet with 2% of oil and 1% of water, added directly into the mixer through individual spray nozzle; Treatment 3 consisted of basal diet with 2% of oil, 1% of water and 0.05% of synthetic emulsifier, pre-blended through an emulsitron system with emulsion order sequence of oil-, emulsifier- and water at 60°C for 3 minutes before it was introduced into the mixer; Treatment 4 consisted of basal diet with 2% of oil, 1% of water and 0.05% of natural biosurfactant added directly into the mixer as comparative treatment. Similar treatments were applied for grower pellet feed.
The four experimental diets were manufactured in four replicates, in a completely randomized design.
Manufacturing and facilities
All diets were produced by a commercial feed mill, and pelleted at the same pellet mill. Corn and soybean meal were ground through Roskamp Champion Model 20x54 hammer mill, with screen aperture of 3x3mm. All ingredients were mixed in Heavy Duty Double Action Ribbon Horizontal Mixer, Hough International Model HFM 205 with 3.5 tonne capacity. All diets were homogenized mixed for 120 seconds dry mixing time, and then for another 180 seconds wet mixing time. Mash feed from mixer was conveyed into Munch Type 50-275 double feeder conditioners with steam inlet temperature of 120 °C and pressure of 2 bars for 45 seconds of retention time. All diets were formed into
Table 2 – Ingredients of grower diet formulation
Ingredient Units
Treatment 1 Treatment 2 Treatment 3 Treatment 4
Corn meal % 52.514 52.514 52.226 52.226
Soybean meal 46% % 32.297 32.297 32.297 32.297
1Crude palm oil @ mixer % 2.000 2.000 2.000 2.000
2Crude palm oil @ post pelleting % 3.293 3.293 3.381 3.381
Rice bran % 5.000 5.000 5.000 5.000
Corn gluten meal 60% % 0.613 0.613 0.613 0.613
Di-calcium phosphate 18% % 1.639 1.639 1.639 1.639
Limestone % 0.889 0.889 0.889 0.889
Salt % 0.310 0.310 0.310 0.310
DL-methionine 99% % 0.246 0.246 0.246 0.246
3Premix % 0.800 0.800 0.800 0.800
Sodium bicarbonate % 0.240 0.240 0.240 0.240
L-Lysine 78% % 0.082 0.082 0.082 0.082
Choline chloride 75% % 0.050 0.050 0.050 0.050
L-Threonine 98.5% % 0.026 0.026 0.026 0.026
4Synthetic emulsifier % - - 0.050
-5Natural biosurfactant % - - - 0.050
Water % - 1.000 1.000 1.000
Wheat pollard % 0.003 0.003 0.153 0.153
Analysed composition
6GE kcal/kg 4,238 4,230 4,220 4,229
Dry matter % 89.0 88.4 88.4 88.2
Crude protein % 20.6 20.8 20.5 20.7
Calcium % 0.84 0.85 0.85 0.86
Total phosphorus % 0.76 0.74 0.75 0.75
Lysine % 1.16 1.15 1.16 1.16
Methionine % 0.50 0.49 0.49 0.50
1Crude palm oil added during mixing process 2Crude palm oil added after pelleting process
3Supplied per kg of diet: Fe 40 mg; Zn 100 mg; Mn 120 mg; Cu 20 mg; Se 0.3 mg; vitamin A 10.5 kIU; vitamin D 3.8 kIU; vitamin E 50 mg; vitamin K 2.45 mg; vitamin B 1 2.68 mg; vitamin B2 5.88 mg; vitamin B6 4.8 mg; vitamin B12 0.025 mg; niacin 58.9 mg; folic acid 1.16 mg; pantothenic acid 12.9 mg; biotin 0.23 mg; ethoxyquin 100 mg; growth promoter 125 mg; anticoccidial 550 mg; mold inhibitor 500 mg.
4Each 1 kg contains 100% glyceryl polyethylene glycol ricinoleate(Bredol®, Akzo Nobel, Sweden) 5Each 1 kg contains 250 g lysophosphatidylcholine (LysoforteTM, Kemin Industries)
pellets through Munch RMP 600 pellet mill with the capacity of 18 tonne per hour, 3.5mm dies aperture and 55mm dies thickness. The pelletized feeds were cooled immediately through Geelen 24x38 countered flow cooler for 15 minutes of retention time. The mean ambient temperatures in the mill were 30°C and 32°C during manufacturing of starter and grower feed, respectively. All diets were produced within a day for each feed phase, to eliminate the variable factors that might exist from ingredient variation, machinery configuration setting, condition variation and other production variables associated with feed manufacture. The grower diets were prepared two weeks after the preparation of starter diets.
Measurements and analytical methods
Mixture of oil, water and emulsifier in Treatment 3 were pre-blended in an emulsitron blender. The sample of this homogeneous colloidal mixture was collected. The effect of emulsion stability was monitored on the separation by visual through emulsion stability test (WHO/M/13.R4, 1999). The impact of feed processing was measured based on the pellet mill energy throughput (kWh/T) and relative electricity consumption of pellet mill motor.
Electricity consumption, kW/(T/h) = (Amp × Vol × √3 × power factor)/(T/h ×1000)
Where T/h = pelleting production rate tonne p/hour Amp = average pellet mill motor ampere
Vol = feed mill voltage Power factor 0.93
Hot mash feed samples were collected from conditioner chamber, while hot pellet feed samples were collected at pellet mill, immediately after pellets were purged out from the pellet mill die holes. Temperature was measured by digital thermometer for both hot mash and hot pellet feed samples. The temperature difference between hot mash and hot pellet feed indicated the temperature created by the friction of pellet mill die hole. Composite feed samples from each treatment were collected from the mixer and cooler in seal plastics. All collected samples were analyzed for moisture content (AOAC, 2005). The same sets of samples were tested for water activity and starch gelatinization. Water activity was determined by obtaining the reading directly from AquaLab Water Activity Meter (Decagon, Series 3TE, US). Gelatinization of starch was determined from the degree of starch that underwent hydrolization by amyloglucosidase enzymatic reaction with specific condition as defined in the Luff-Schoorl method (ISI, 2002). The complete feed was collected from the cooler and was extracted
for a known quantity of oil/fat before proceeding for acid value (AOCS, 1999) and peroxide value (AOCS, 1999) evaluation. The chemical stability test on acid value and peroxide value were tested at an interval of 2 days for a period of 14 days. Biostability test on mold count (AOAC, 2005) expressed as cfu/g sample was tested on complete feed on the date of production and the subsequent 7 and 14 days. Physical properties on bulk density and pellet durability index were measured on complete feed which was collected at packing outlet. The bulk density was measured by obtaining the weight of material per liter (ASAE, 1998). Durability of pellet was determined by tumbling 500g of sieved sample for 10 min at 50 rpm, in a tumbling box device as described in ASAE S269.4 (1998). The percentage of feed powdery was determined by screening the 50kg complete feed through a wire sieve with opening size of 1mm and 2mm for starter crumble feed and grower pellet feed, respectively. All samples were analyzed in triplicate for each parameter.
Statistical Analysis
All data from the experiments were calculated using General Linear Model Procedure (GLM) of the Statistical Analysis System (SAS Institute, 2000). Significant differences were analyzed statistically using Least Significant Different (LSD). Treatment means were compared by Duncan’s Multiple Range Test using SAS program. Statement of statistical significance was based on probability p<0.05, and high significance at p<0.0001.
RESULTS
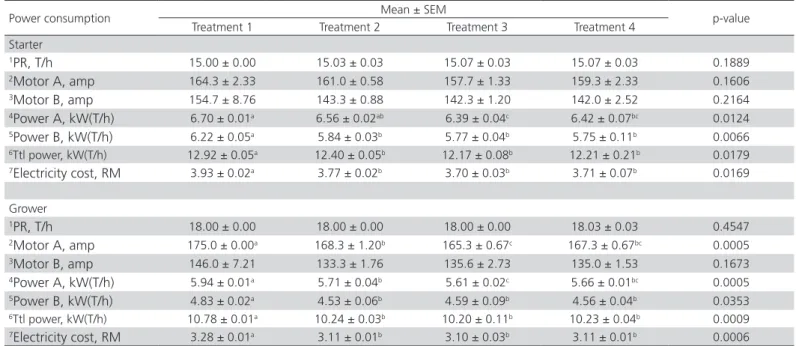
Energy consumption
Energy consumption in feed production for starter and grower feeds was represented in Table 3. Diet formulated with water and emulsifier affected the energy usage. Treatment 1 with no addition of water and emulsifier showed the highest (p<0.05) energy consumption with higher energy cost in pelleting process for starter diet. Similar finding was observed in grower feed production. However, inclusion of emulsifier in Treatment 3 and 4, somehow showed no statistical difference. And Treatment 3 with glyceryl polyethylene glycol ricinoleate showed the lowest power consumption and electricity cost compared with all other treatments.
Meal temperature
feeds. Treatment 1, with no addition of water and emulsifier, showed the lowest meal temperature of hot mash feed and the highest temperature of hot pellet feed, resulting in the highest (p<0.05) meal friction
temperature. Similar findings were observed in grower diet. However, no significant differences (p>0.05) in meal temperature were observed among Treatments 2, 3 and 4.
Table 3 – Influence of emulsifier on energy consumption in starter and grower feed production
Power consumption Mean ± SEM p-value
Treatment 1 Treatment 2 Treatment 3 Treatment 4
Starter
1PR, T/h 15.00 ± 0.00 15.03 ± 0.03 15.07 ± 0.03 15.07 ± 0.03 0.1889
2Motor A, amp 164.3 ± 2.33 161.0 ± 0.58 157.7 ± 1.33 159.3 ± 2.33 0.1606
3Motor B, amp 154.7 ± 8.76 143.3 ± 0.88 142.3 ± 1.20 142.0 ± 2.52 0.2164
4Power A, kW(T/h) 6.70 ± 0.01a 6.56 ± 0.02ab 6.39 ± 0.04c 6.42 ± 0.07bc 0.0124
5Power B, kW(T/h) 6.22 ± 0.05a 5.84 ± 0.03b 5.77 ± 0.04b 5.75 ± 0.11b 0.0066
6Ttl power, kW(T/h) 12.92 ± 0.05a 12.40 ± 0.05b 12.17 ± 0.08b 12.21 ± 0.21b 0.0179
7Electricity cost, RM 3.93 ± 0.02a 3.77 ± 0.02b 3.70 ± 0.03b 3.71 ± 0.07b 0.0169
Grower
1PR, T/h 18.00 ± 0.00 18.00 ± 0.00 18.00 ± 0.00 18.03 ± 0.03 0.4547
2Motor A, amp 175.0 ± 0.00a 168.3 ± 1.20b 165.3 ± 0.67c 167.3 ± 0.67bc 0.0005
3Motor B, amp 146.0 ± 7.21 133.3 ± 1.76 135.6 ± 2.73 135.0 ± 1.53 0.1673
4Power A, kW(T/h) 5.94 ± 0.01a 5.71 ± 0.04b 5.61 ± 0.02c 5.66 ± 0.01bc 0.0005
5Power B, kW(T/h) 4.83 ± 0.02a 4.53 ± 0.06b 4.59 ± 0.09b 4.56 ± 0.04b 0.0353
6Ttl power, kW(T/h) 10.78 ± 0.01a 10.24 ± 0.03b 10.20 ± 0.11b 10.23 ± 0.04b 0.0009
7Electricity cost, RM 3.28 ± 0.01a 3.11 ± 0.01b 3.10 ± 0.03b 3.11 ± 0.01b 0.0006
Treatment 1: Basal diet with 2% oil at mixer
Treatment 2: Basal diet with 2% oil at mixer + 1% water
Treatment 3: Basal diet with 2% oil at mixer + 1% water + synthetic emulsifier Treatment 4: Basal diet with 2% oil at mixer + 1% water + natural biosurfactant a-cMeans within a row with different superscripts differ significantly (p<0.05) SEM: Standard error of mean
1Production rate measured in total tonnage per hour 2Pellet mill motor ampere for unit no. A
3Pellet mill motor ampere for unit no. B
4Electricity consumption calculated in kilowatt ton per hour for pellet mill motor no. A 5Electricity consumption calculated in kilowatt ton per hour for pellet mill motor no. B 6Total electricity consumption = summation of 4 and 5
7Electricity cost = Total electricity consumption kW (T/h) times electricity unit cost RM0.304 Currency exchange rate: 1 USD = RM3.70 (as of the time of manuscript preparation)
Table 4 – Effect of emulsifier on meal temperature in the process of starter and grower feed
Temperature, °C Mean ± SEM p-value
Treatment 1 Treatment 2 Treatment 3 Treatment 4
Starter
1Hot mash feed 79.70 ± 0.40 80.73 ± 0.41 81.27 ± 0.22 80.40 ± 0.64 0.1829
2Hot pellet feed 85.50 ± 0.06 85.13 ± 0.18 85.50 ± 0.15 85.07 ± 0.32 0.0955
Friction temperature 6.13 ± 0.12a 4.40 ± 0.35b 4.30 ± 0.32b 4.67 ± 0.37b 0.0205
Grower
1Hot mash feed 81.17 ± 0.27 82.00 ± 0.42 82.77 ± 0.52 82.10 ± 0.06 0.0887
2Hot pellet feed 87.17 ± 0.52 86.80 ± 0.50 87.03 ± 0.67 86.87 ± 0.13 0.9561
Friction temperature 6.00 ± 0.26a 4.80 ± 0.20b 4.43 ± 0.33b 4.77 ± 0.09b 0.0273 Treatment 1: Basal diet with 2% oil at mixer
Treatment 2: Basal diet with 2% oil at mixer + 1% water
Treatment 3: Basal diet with 2% oil at mixer + 1% water + synthetic emulsifier Treatment 4: Basal diet with 2% oil at mixer + 1% water + natural biosurfactant a-bMeans within a row with different superscripts differ significantly (p<0.05) SEM: Standard error of mean
1Sample collected at conditioner chamber
Gelatinization of starch
Table 5 shows the effect of emulsifier on starch gelatinization for starter and grower feeds. An increase (p<0.0001) in starch gelatinization was observed in all treatment diets after the conditioning process. The highest gelatinization of starch were obtained in Treatments 3 and 4 (with water and emulsifier inclusion in the diet), followed by Treatment 2 (with water addition and no emulsifier in the diet), and the lowest in Treatment 1 (with no water and no emulsifier
in the diet). A similar finding was observed in grower feed. Treatment 3 with glyceryl polyethylene glycol ricinoleate showed the highest (p<0.0001) starch gelatinization after cooling process in grower feed compared to all other treatments.
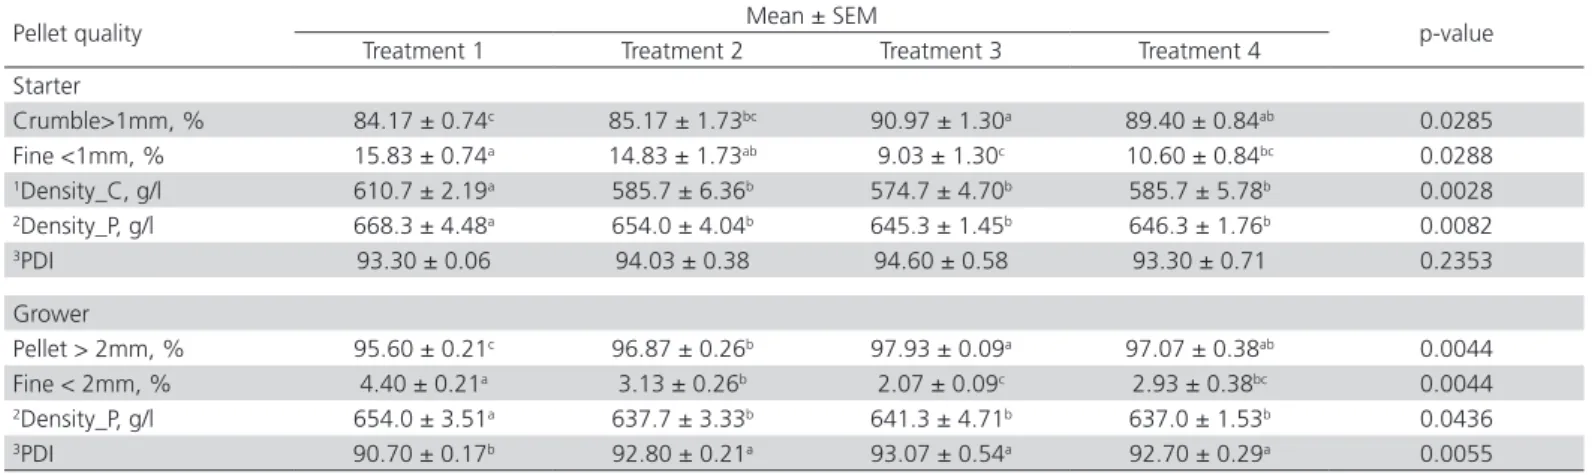
Pellet quality
As indicated in Table 6, Treatment 1 showed the highest (p<0.05) feed density compared to other treat-ment diets. However, no significant difference result
Table 5 – Starch gelatinization in processed meal of starter and grower feed
Starch gelatinization, % Mean ± SEM p-value
Treatment 1 Treatment 2 Treatment 3 Treatment 4
Starter
1Gelatinization_M 23.73 ± 2.00 23.47 ± 1.77 24.90 ± 1.70 25.67 ± 1.88 0.8700
2Gelatinization_C 30.50 ± 0.06c 34.77 ± 0.27b 45.57 ± 0.20a 45.10 ± 0.12a < .0001
3Gelatinization_D 36.30 ± 0.06c 36.50 ± 0.29c 48.20 ± 0.12a 45.20 ± 1.12b < .0001
4Gelatinization_P 36.87 ± 0.20c 39.63 ± 0.83b 48.77 ± 0.15a 47.77 ± 0.15a < .0001
Grower
1Gelatinization_M 21.63 ± 0.48 21.97 ± 0.84 22.60 ± 0.52 22.13 ± 0.80 0.8465
2Gelatinization_C 28.87 ± 0.09c 29.90 ± 0.06b 34.10 ± 0.12a 33.90 ± 0.06a < .0001
3Gelatinization_D 34.60 ± 0.06d 36.37 ± 0.26c 44.70 ± 0.12a 40.17 ± 0.15b < .0001
4Gelatinization_P 34.70 ± 0.12d 37.20 ± 0.17c 47.87 ± 0.09a 45.10 ± 0.06b < .0001
Treatment 1: Basal diet with 2% oil at mixer
Treatment 2: Basal diet with 2% oil at mixer + 1% water
Treatment 3: Basal diet with 2% oil at mixer + 1% water + synthetic emulsifier Treatment 4: Basal diet with 2% oil at mixer + 1% water + natural biosurfactant a-dMeans within a row with different superscripts differ significantly (p<0.05) SEM: Standard error of mean
1Sample collected at mixer
2Sample collected at conditioner chamber
3Sample collected immediately after pellet mill die holes 4Sample collected after cooler
Table 6 – Pellet quality on starter and grower feed supplemented with emulsifier
Pellet quality Mean ± SEM p-value
Treatment 1 Treatment 2 Treatment 3 Treatment 4
Starter
Crumble>1mm, % 84.17 ± 0.74c 85.17 ± 1.73bc 90.97 ± 1.30a 89.40 ± 0.84ab 0.0285
Fine <1mm, % 15.83 ± 0.74a 14.83 ± 1.73ab 9.03 ± 1.30c 10.60 ± 0.84bc 0.0288
1Density_C, g/l 610.7 ± 2.19a 585.7 ± 6.36b 574.7 ± 4.70b 585.7 ± 5.78b 0.0028
2Density_P, g/l 668.3 ± 4.48a 654.0 ± 4.04b 645.3 ± 1.45b 646.3 ± 1.76b 0.0082
3PDI 93.30 ± 0.06 94.03 ± 0.38 94.60 ± 0.58 93.30 ± 0.71 0.2353
Grower
Pellet > 2mm, % 95.60 ± 0.21c 96.87 ± 0.26b 97.93 ± 0.09a 97.07 ± 0.38ab 0.0044
Fine < 2mm, % 4.40 ± 0.21a 3.13 ± 0.26b 2.07 ± 0.09c 2.93 ± 0.38bc 0.0044
2Density_P, g/l 654.0 ± 3.51a 637.7 ± 3.33b 641.3 ± 4.71b 637.0 ± 1.53b 0.0436
3PDI 90.70 ± 0.17b 92.80 ± 0.21a 93.07 ± 0.54a 92.70 ± 0.29a 0.0055
Treatment 1: Basal diet with 2% oil at mixer
Treatment 2: Basal diet with 2% oil at mixer + 1% water
Treatment 3: Basal diet with 2% oil at mixer + 1% water + synthetic emulsifier Treatment 4: Basal diet with 2% oil at mixer + 1% water + natural biosurfactant a-cMeans within a row with different superscripts differ significantly (p<0.05) SEM: Standard error of mean
Table 7 – Effect of emulsifier on meal moisture and water activity in starter and grower feed
Water activity / Moisture, %
Mean ± SEM
p-value
Treatment 1 Treatment 2 Treatment 3 Treatment 4
Starter
1Aw_D 0.64 ± 0.00b 0.67 ± 0.00a 0.68 ± 0.00a 0.67 ± 0.00a < .0001
2Aw_P 0.64 ± 0.00b 0.67 ± 0.00a 0.68 ± 0.00a 0.67 ± 0.01a 0.0229
3Moisture_M 11.60 ± 0.01b 12.17 ± 0.10a 12.27 ± 0.06a 12.14 ± 0.08a 0.0026
4Moisture_C 13.87 ± 0.06c 14.56 ± 0.07b 15.04 ± 0.10a 14.82 ± 0.17ab 0.0011
5Moisture_D 12.84 ± 0.01b 14.42 ± 0.05a 14.23 ± 0.09a 13.90 ± 0.27a 0.0012
6Moisture_P 11.05 ± 0.04c 11.73 ± 0.06b 12.19 ± 0.15a 12.01 ± 0.16ab 0.0003
Grower
1Aw_D 0.64 ± 0.00c 0.69 ± 0.00a 0.68 ± 0.00b 0.68 ± 0.00b < .0001
2Aw_P 0.61 ± 0.00b 0.65 ± 0.00a 0.64 ± 0.00a 0.64 ± 0.00a 0.0013
3Moisture_M 11.65 ± 0.03b 12.65 ± 0.04a 12.66 ± 0.17a 12.52 ± 0.23a 0.0134
4Moisture_C 14.19 ± 0.04c 15.45 ± 0.11ab 15.92 ± 0.15a 15.26 ± 0.21b 0.0008
5Moisture_D 13.41 ± 0.02c 14.79 ± 0.19ab 15.00 ± 0.11a 14.40 ± 0.17b 0.0017
6Moisture_P 11.26 ± 0.04b 11.95 ± 0.06a 12.14 ± 0.18a 12.05 ± 0.07a 0.0020
Treatment 1: Basal diet with 2% oil at mixer
Treatment 2: Basal diet with 2% oil at mixer + 1% water
Treatment 3: Basal diet with 2% oil at mixer + 1% water + synthetic emulsifier Treatment 4: Basal diet with 2% oil at mixer + 1% water + natural biosurfactant a-cMeans within a row with different superscripts differ significantly (p<0.05) SEM: Standard error of mean
1Water activity for sample collected at mixer 2Water activity for sample collected after cooler 3Moisture content for sample collected at mixer
4Moisture contentfor sample collected at conditioner chamber
5Moisture content for sample collected immediately after pellet mill die holes 6Moisture content for sample collected after cooler
was found on diets supplemented with water and emulsifiers. Treatment 1 with the highest bulk densi-ty showed the lowest (p<0.05) pellet durabilidensi-ty index in grower feed. There was no significant difference (p>0.05) between emulsifier glyceryl polyethylene gly-col ricinoleate in Treatment 3 and lysophosphatidyl-choline in Treatment 4 on pellet quality.
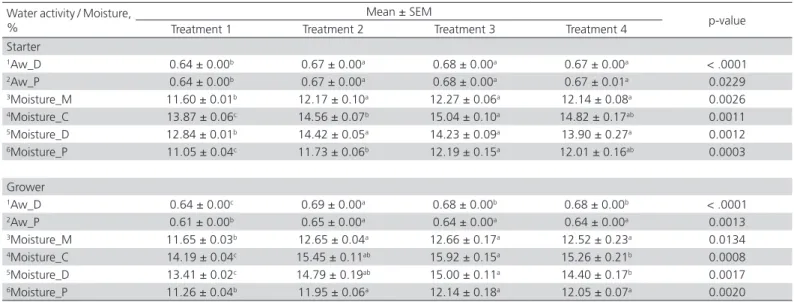
Moisture and water activity
Water activity (Aw) detected in all stages of experimental diets ranged from 0.61 to 0.69 (Table 7). Treatment 1 showed the lowest Aw in mash feed after mixing process (p<0.0001) and complete feed after cooling process (p<0.05). The effect of emulsifier on water activity was observed in Treatments 3 and 4 during mixing process for grower phase (p<0.05). Treatment 1 possessed the lowest (p<0.05) moisture content throughout the whole process. Water addition in the experimental diet increased the moisture content in mash feed. Emulsifier supplemented diet retained it´s high moisture content until the final cooler stage in starter diet (p<0.05) but not in grower diet. There was no significant difference (p>0.05) between synthetic emulsifier glyceryl polyethylene glycol ricinoleate in Treatments 3 and biosurfactant
lysophosphatidyl-choline in Treatment 4 on feed moisture and water activity.
Acid value
As summarized in Table 8, all the treatment diets showed an increased level of acid value after being kept for 14 days. However, the increased rate showed no significant difference (p>0.05) among the experimental diets. Similar findings were observed in grower feed.
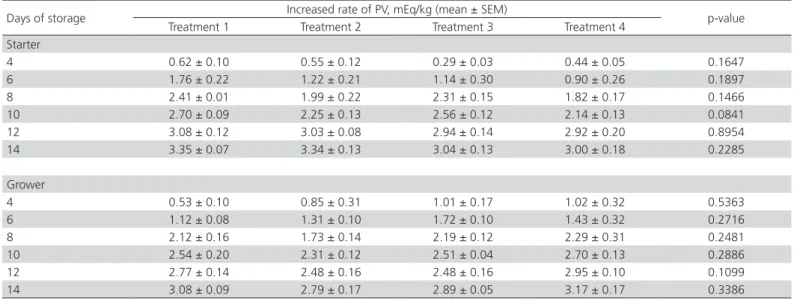
Peroxide value
Table 9 shows an increased level of peroxide value in all treatment diets after keeping for 14 days. No significant difference (p>0.05) was found among the experimental diets on the increased rate of peroxide value.
Biostability
Table 8 – Increased rate of acid value in starter and grower feed throughout 14 days of storage period
Days of storage Increased rate of AV, mg KOH/g (mean ± SEM) p-value
Treatment 1 Treatment 2 Treatment 3 Treatment 4
Starter
4 2.30 ± 0.13 1.97 ± 0.17 2.13 ± 0.11 2.01 ± 0.11 0.2742
6 3.02 ± 0.20 2.28 ± 0.07 2.83 ± 0.42 2.42 ± 0.14 0.0736
8 4.19 ± 0.38 4.13 ± 0.49 4.12 ± 0.51 3.28 ± 0.19 0.4930
10 5.80 ± 0.28 6.05 ± 0.34 6.94 ± 0.20 5.93 ± 0.46 0.1144
12 9.56 ± 0.38 8.34 ± 0.24 8.77 ± 0.16 9.42 ± 0.20 0.0811
14 10.50 ± 0.27 9.84 ± 0.42 10.46 ± 0.31 10.70 ± 0.38 0.4494
Grower
4 1.96 ± 0.26 1.68 ± 0.61 0.66 ± 0.08 2.14 ± 0.61 0.2557
6 3.43 ± 0.29 2.92 ± 0.35 3.16 ± 0.33 4.33 ± 0.26 0.0606
8 5.00 ± 0.84 4.69 ± 0.34 4.43 ± 0.39 6.03 ± 0.25 0.2629
10 6.68 ± 0.17 5.92 ± 0.25 5.96 ± 0.31 6.85 ± 0.31 0.1391
12 7.16 ± 0.41 7.08 ± 0.34 7.13 ± 0.52 8.99 ± 0.57 0.1178
14 8.48 ± 0.22 8.76 ± 0.86 8.63 ± 0.64 10.42 ± 0.13 0.2107
Treatment 1: Basal diet with 2% oil at mixer
Treatment 2: Basal diet with 2% oil at mixer + 1% water
Treatment 3: Basal diet with 2% oil at mixer + 1% water + synthetic emulsifier Treatment 4: Basal diet with 2% oil at mixer + 1% water + natural biosurfactant Means within a row with no superscripts has no significant difference (p<0.05) SEM: Standard error of mean
Table 9 – Changes of peroxide value in starter and grower feed throughout 14 days of storage period
Days of storage Increased rate of PV, mEq/kg (mean ± SEM) p-value
Treatment 1 Treatment 2 Treatment 3 Treatment 4
Starter
4 0.62 ± 0.10 0.55 ± 0.12 0.29 ± 0.03 0.44 ± 0.05 0.1647
6 1.76 ± 0.22 1.22 ± 0.21 1.14 ± 0.30 0.90 ± 0.26 0.1897
8 2.41 ± 0.01 1.99 ± 0.22 2.31 ± 0.15 1.82 ± 0.17 0.1466
10 2.70 ± 0.09 2.25 ± 0.13 2.56 ± 0.12 2.14 ± 0.13 0.0841
12 3.08 ± 0.12 3.03 ± 0.08 2.94 ± 0.14 2.92 ± 0.20 0.8954
14 3.35 ± 0.07 3.34 ± 0.13 3.04 ± 0.13 3.00 ± 0.18 0.2285
Grower
4 0.53 ± 0.10 0.85 ± 0.31 1.01 ± 0.17 1.02 ± 0.32 0.5363
6 1.12 ± 0.08 1.31 ± 0.10 1.72 ± 0.10 1.43 ± 0.32 0.2716
8 2.12 ± 0.16 1.73 ± 0.14 2.19 ± 0.12 2.29 ± 0.31 0.2481
10 2.54 ± 0.20 2.31 ± 0.12 2.51 ± 0.04 2.70 ± 0.13 0.2886
12 2.77 ± 0.14 2.48 ± 0.16 2.48 ± 0.16 2.95 ± 0.10 0.1099
14 3.08 ± 0.09 2.79 ± 0.17 2.89 ± 0.05 3.17 ± 0.17 0.3386
Treatment 1: Basal diet with 2% oil at mixer
Treatment 2: Basal diet with 2% oil at mixer + 1% water
Treatment 3: Basal diet with 2% oil at mixer + 1% water + synthetic emulsifier Treatment 4: Basal diet with 2% oil at mixer + 1% water + natural biosurfactant Means within a row with no superscripts has no significant difference (p<0.05) SEM: Standard error of mean
with lower motor ampere, resulting in lower pellet mill energy throughput and thus lower electricity cost.
Meal temperature
Low meal temperature of hot mash feed in Treatment 1 could be probably due to the incomplete steam penetration and heat transferred into the meal particle during the conditioning process (Moritz et al.,
DISCUSSION
Energy consumption
2003). Lubrication effect on the meal particle was not achieved, leading to high friction heat and shear force creation when moist meal passes through the pellet mill die holes. However, inclusion of water and emulsifier in Treatments 2, 3 and 4 have served as a transaction phase for heat absorption, whereby the effect of steam penetration was achieved, resulting in higher temperature of hot mash feed compared to Treatment 1. An endothermic reaction of gelatinization process in starch-lipid complex formation (Ali & Hasnain, 2013) could have taken place in Treatments 2, 3 and 4 after the conditioning process. The explanation was supported by the result of the high starch gelatinization (Table 5), and low meal temperature of hot pellet feed (Table 4), which has provided an indication for the endothermic reaction.
Gelatinization of starch
Improvement of starch gelatinization was observed in diets with water and emulsifier. This could be explained due to the emulsification effect of water and steam, which dispersed into the oil coated meal particle of the diet. The processed steam is capable to form a stable emulsion and reduced surface tension, which allows steam penetrating into the meal granules. As starch particles in the diet is heated in the presence of excessive water, in the form of steam in the conditioner chamber, starch granules start to gelatinize (Thomas & Poel, 1998), forming a mixture of fragments, swollen granules and colloidal starch (Olkku & Rha, 1978). In addition, during the gelatinization process, those swollen starch granules were fragile and could easily rupture under shear force, and therefore decreased the viscosity of meal mixture (Ahmadi-Abhari et al.,
2013). Addition of emulsifier can stabilize the swollen
starch granules from rupture (Azizi & Rau, 2005). The explanation could be due to the properties of the emulsifier, which is capable to delay the starch swelling effect in the amylose-lipid complex formation. The formation from the linear portion of amylose, and to some extent, the amylopectin chain has formed a helix coil around the lipid fatty acid, forming a stabilized layer of lipid film around the starch granules (Leloup
et al., 1992). In this study, synthetic emulsifier glyceryl
polyethylene glycol ricinoleate in Treatment 3 showed higher (p<0.0001) effect in starch gelatinization than natural biosurfactant lysophosphatidylcholine in Treatment 4 and other treatments during the pelleting process. The emulsification of fat as well as the thermo-mechanical friction, resulting from the pelleting process, would further enhance the gelatinization of starch (Stauffer, 1999). The formation of amorphous or crystalline structure in the amylose-lipid complex in gelatinization process, was reported to depends on the interactions between heating temperature, water content in the starch-lipid structure, and the extent of amylose leached out from the starch granule (Le Bail et al., 1999). The effect would be extended
to the complete feed after the cooling process. Lysophosphatidylcholine, a natural biosurfactant which targets to disperse oil droplet in the water environment at animal digestive gut, has somehow shown some degree of emulsifying effect in starch gelatinization during feed manufacturing (p<0.0001). The amphoteric characteristic of lysophosphatidylcholine that possesses anionic negative charge on hydroxyl group and cationic positive charge on nitrogen end, was capable to exhibit some dispersion effect on
water-oil and oil-water environment (Yamanaka et
al., 1997). Regardless of the electrostatic effect, both
Table 10 – Biostability on mold count in starter and grower feed supplemented with emulsifier
Days of storage Mold count, cfu/g (mean ± SEM) p-value
Treatment 1 Treatment 2 Treatment 3 Treatment 4
Starter
0 5.00 ± 2.89 10.00 ± 5.77 5.00 ± 2.89 6.67 ± 3.33 0.8112
7 11.67 ± 4.41 0.00 ± 0.00 6.67 ± 3.33 11.67 ± 1.67 0.0951
14 5.00 ± 2.89 3.33 ± 3.33 0.00 ± 0.00 10.00 ± 5.77 0.2271
Grower
0 5.00 ± 2.89 0.00 ± 0.00 0.00 ± 0.00 0.00 ± 0.00 0.1170
7 5.00 ± 2.89 0.00 ± 0.00 6.67 ± 3.33 6.67 ± 6.67 0.6697
14 8.33 ± 1.67 0.00 ± 0.00 3.33 ± 3.33 0.00 ± 0.00 0.0884
Treatment 1: Basal diet with 2% oil at mixer
Treatment 2: Basal diet with 2% oil at mixer + 1% water
ionic and non-ionic emulsifiers were reported have the same effect in starch-lipid complex-forming properties in gelatinization process (Nuessli et al., 2000).
Pellet quality
Results of the present experiment showed that diets with water possessed low feed density values. Pellet quality was noted to increase with the decrease of bulk density. In this experiment treatment, diets 2, 3 and 4 with low bulk density, showed high pellet durability index (PDI) in grower feed (p<0.05). This could be due to the confound moisture effect on bulk density, that created more intact pellet and better pellet quality (Moritz et al., 2002). Treatment 1, without water addition, was
observed to have the lowest physical quality in the final feed product as compared with other treatments. The improvement in physical quality was further enhanced on diets supplemented with water and emulsifier in Treatments 2, 3 and 4. Higher (p<0.05) intact form of crumble and pellet in starter and grower feeds were observed in emulsifier supplemented diet. This could be explained by greater meal moisture (Table 7), together with higher conditioner temperature and decreased frictional heat (Table 4), leading to better gelatinization of starch (Table 5), thus improved in pellet formation. In the presence of excessive water, crystalline starch granules absorb water through hydrogen bonding with their free hydroxyl group and swell. In the process of high temperature, starch molecules absorb energy, dissociate the double helices and form into amorphous. Starch granule losses it´s crystalline structure, losses in molecule order and increases in viscosity (Eliasson & Gudmundsson, 2006). This starch gelatinization process has contributed to the lubrication effect which allowed the pellet to be flashed off more efficiently from the die. The lubricant effect has minimized the friction and thus decreased the frictional heat (Table 4) in the pelleting process. After the cooling process, the gelatinized starch molecule was associated, re-crystallized and re-structured back to the double helical through the formation of non-covalent interactions of amylose molecules (Thomas & Atwell, 1999). The dispersed matrix of gelatinized starch forms a paste-like gel which functions as a binding agent. The pellet feed was formed by starchy gumming material within the meal particle, hardening the exterior pellet surface while leaving the interior mealy (Froestschner, 2007). The increase in starch gelatinization (Table 5) explained the improvement in pellet quality, increased of PDI, intact feed form and reduced powdery portion. The use of water and exogenous emulsifier resulted in better starch gumming effect, which functions as
an adhesive in pellet binding, thus aiding in durable pellet formation (Froetschner, 2007), and enabling us to create more intact pellet and little/minimum fines.
Moisture and water activity
The moisture content in the feed, determined the yield and confirmed the end point of dry weight. The shelf stability associated with the loss of water content is influenced by the water activity (Aw), the ratio of the vapor pressure (P) in a product and that of pure water at the same temperature (Po). Thus, the relationship between water activity and moisture content is correlated by the equilibrium of relative humidity (ERH) of the surrounding atmosphere (ERH = Aw x 100%), (Eskin & Robinson, 2001). Apparently, adding water in the diets increased the moisture content and water activity (Aw) in the processed meal. At a constant temperature and for each humidity value, the relationship between moisture content and water activity is indicated by the corresponding moisture sorption isotherm. The sorption behavior changes accordingly to the material composition and quality changes. Due to the complexity of product composition, theoretical prediction of isotherms cannot be determined by calculation. The complexity of sorption process somehow needs to be measured experimentally for individual material (Bell & Labuza, 2000). The moisture content and water activity obtained in this experiment, indicated the relationship of moisture sorption isotherm in the poultry feed, under the specific temperature and equilibrium of relative humidity with the surrounding atmosphere of the experimental environment. Treatment 1 possessed the lowest Aw compared with other treatments supplemented with water and emulsifier. A possible explanation is that the addition of water in the experimental diets in Treatments 2, 3 and 4, had increased the amount of free moisture, evident from the outcome on water activity (Table 7). This free water was driven off more efficiently from the pellet feed. Surface tension of free water was expected to be firmly bounded in the feedstuff granules in diets supplemented with emulsifier, which minimized the water migration, and increased the water retention in feed particle.
Acid value
level of acid value of the experiment diets throughout 14 days of storage period. The reaction could be catalyzed by lipase enzyme that might be present naturally in the plant oils or animal fats of the feed’s ingredients (Rossel, 1994). The rate of this enzymatic peroxidation was gradual, which could be due to the limitation of those natural existence enzymes. In this experiment, the suspension of aqueous droplet in oil medium, associated with the emulsifier molecules from the emulsification process, has reduced the surface tension between water and oil phases (Stauffer, 1999). However, this process somehow showed no significant deterioration rancidity effect on the treated diets.
Peroxide value
The elevated peroxide value caused by chemical reaction was measured as an indicator of oxidation
rancidity (Antolovich et al., 2002). This reaction
involved the addition of oxygen from the environment´s reaction to the unsaturated fatty acids. Degradation of lipids took place forming the initial hydro-peroxides. Auto-oxidation occurred in the subsequent free-radical mechanism resulting in hydrocarbon and several other compounds of epoxides and alcohol formation. The inclusion of water and emulsifier in this study showed no significant difference in lipid degradation of the experimental diets. Slow increased rate of peroxide formation in the diets after 14 days could be explained due to the inclusion of antioxidant in the poultry diet, which inhibits the reaction between antioxidant and free radicals that slow down the auto-oxidation or natural formation of peroxides from deteriorating (Gutteridge & Halliwell, 2010). The antioxidants could be partitioning into different phases of emulsion, either in oil phase, water phase or interface between these 2 phases with it´s respective efficacy to affect the oxidation rate (Sorensen et al., 2008).
Biostability
Generally microorganisms require optimum level of water activity and depend on other environment factors for growth. It has been reported that microorganisms require water as solution for cell contents, generally best grown between Aw 0.995 – 0.980 (Gibbs & Gekas, 1999). Although water and emulsifier were added in this experiment, the water activity in these treated diets was tested ranging from 0.61 to 0.69, which was far below the microbial growth range. The experimental diets were relative stable from propagation of air borne or water borne microbial and bacterial contamination. The level of mold count
remained stable for 14 days regardless of any of the treated diets. Emulsification showed no significant effect for the microbial response. Although some yeasts and molds might grow in the environment with water activity lower than 0.60, an inclusion of mold inhibitor in the diet does not interfere on the mold growth effect.
CONCLUSIONS
From this study, it is concluded that adding water and emulsifier to a corn-soy based broiler diet has no deteriorating effect in hydrolytic rancidity, oxidation rancidity and biostability of the pellet feed. Significant differences showed in moisture content, water activity and meal temperature has provided valuable information on the effect of water and emulsifier to the gelatinization of starch, which contributed to the physical properties of the pellet feed. The effect of different types of emulsifier did not improve electricity consumption. It is concluded that the effect of the emulsifier in economic savings was not found in this specific experimental design.
ACKNOWLEDGEMENTS
This research project was made possible by the support and facilities of Charoen Pokphand Holdings, Malaysia. This project was supported by Long-Term Research Grant Scheme (LRGS) from Ministry of Education of Malaysia.
REFERENCES
Ahmadi-Abhari S, Woortman AJJ, Hamer RJ, Oudhuis AACM, Loos K. Influence of lysophosphatidylcholine on the gelation of diluted wheat starch suspensions. Carbohydrate Polymers 2013;93:224-231.
Ali TM, Hasnain A. Effect of emulsifiers on complexation and retrogradation characteristics of native and chemically modified white sorghum (sorghum bicolor) starch. Thermochimica Acta 2013;552:46-53.
Antolovich M, Prenzler PD, Patsalides E, McDonald S, Robards K. Methods for testing antioxidant activity. Analyst 2002;127(1):183–198.
AOAC - Association of Official Analytical Chemists. 18th ed. Washington:
Official methods of Analysis; 2005.
AOCS - American Oil Chemists’ Society. Official methods and recommended practices of the american oil chemists. 3rd ed. Washington; 1999.
ASAE - American Society of Agricultural Engineers. Cubes, pellets, and crumbles: definitions and methods for determining density, durability, and moisture content [S269].St Joseph: ASAE; 1998.
Azizi MH, Rau VG. Effect of surfactant in pasting characteristics of various starches. Food Hydrocolloids 2005;19(4):739-743.
Bell LN, Labuza TP. Practical aspects of moisture sorption isotherm measurement and use. 2nd ed. St Paul: AACC Eagan Press; 2000.
Brill Feed FormulationTM System. Feed management systems. Brilliant
Alternatives; 2005. v.1, p.36.
Buchanan NP, Lilly KGS, Gehring CK, Moritz JS. The effects of altering diet formulation and manufacturing technique on pellet quality. Journal of Applied Poultry Research 2010;19:112-120.
Cavalcanti WB, Behnke KC. Effect of composition of feed model systems. On Pellet Quality. Cereal Chemistry 2005;82(4):462-467.
Cobb 500. Broiler performance and nutrition supplement. Siloam: Cobb-Vantress; 2015.
CPM - California Pellet Mill. Animal feed pelleting application. Crawfordsville: The Pelleting Process. p.1-33.
Eliasson AC, Gudmundsson M. Starch: physicochemical and functional aspects. Florida: CRC Press; 2006. p.391-486.
Eskin NAM, Robinson DS. Food shelf life stability. Chemical, biochemical and microbiological changes. Florida: CRC Press; 2001.
Froetschner JR. Micro-ingredient application and equipment: Issues and advances. Animal Feed Manufacturers’ Association 2007;16(2):12-19.
Gibbs P, Gekas V. Water activity and microbiological aspect of foods - a knowledge base. 1999. Available from: http://www.nelfood.com.
Gutteridge JMC, Halliwell B. Antioxidants: Molecules, medicines, andmyths. Biochemical and Biophysical Research Communications 2010;393(4):561–564.
Hasenhuettl GL, Hartel RW. Physicochemical aspects of an emulsifier functionality. 2nded. Food emulsifiers and their applications. New York:
Springer; 2008. p. 173-193.
ISI, 28-1e. Determination of reducing sugar, DE by Luff-Schoorl’s method, LT 1/9/1970, Rev LT 22/1;2002.
Le Bail P, Bizot H, Ollivon M, Keller G, Bourgaux C, Bule’on A. Monitoring the crystallization of amylose-lipid complexes during maize starch melting by synchrotron X-ray diffraction. Biopolymers 1999;50:99-110.
Leloup VM, Colonna P, Ring SG, Roberts K, Wells B. Microstructure of amylose gels. Carbohydrate polymers 1992;18(3):189-197.
Moritz JS, Cramer KR, Wilson KJ, Beyer RS. Effect of feed rations with graded levels of added moisture formulated to different energy densities on feed manufacturing, pellet quality, performance and energy metabolism of broilers during the growing period. Journal of Applied Poultry Research 2003;12:371-381.
Moritz JS, Wilson KJ, Cramer KR, Beyer RS, McKinney LJ, Cavalcanti WB,
et al. Effect of formulation density, moisture and surfactant on feed
manufacturing, pellet quality and broiler performance. Journal of Applied Poultry Research 2002;11:155-163.
Nuessli J, Handschin S, Conde-Petit B, Escher F. Rheology and structure of amylopectin potato starch dispersions without and with emulsifier addition, Starke 2000;52(1):22-27.
Olkku T, Rha C. Gelatinization of starch and wheat flour a review. Food Chemistry 1978;3:293-317
Rossell JB. Measurement of rancidity. 3rded. London: Chapman and
Hall;1994. p.22-53.
Ryu GH, Walker CE. Cell structure of wheat flour extrudates produced with various emulsifiers. Lebensmitte-Wissenchaft und-Technologie 1994;27:432-441.
SAS. User guide statistics. Cary: SAS Institute; 2000.
Sorensen ADM, Haahr AM, Becker EM, Skibsted LH, Bergenstahl B, Nilsson L, et al. Interactions between iron, phenolic compounds, emulsifiers and pH in omega-3 enriched oil-in-water emulsions. Journal of Agricultural and Food Chemistry 2008;56(5):1740–1750.
Stauffer CE. Emulsifiers. St Paul: Eagan Press; 1999.
Thomas DJ, Atwell WA. Starches. St Paul: Eagen Press; 1999.
Thomas M, van Vliet T, van der Poel AFB. Physical quality of pelleted animal feed 3. Contribution of feedstuff components. Animal Feed Science Technology 1998;70:59-78.
WHO - World Health Organization. Emulsion stability test specification [/M/13.R4]. Genebra;1999.
Yamanaka T, Ogihara N, Ohhori T, Hayashi H, Muramatsu T. Surface chemical properties of homologs and analogs of lysophosphatidylcholine and lysophosphatidylethanolamine in water. Chemistry and Physics of Lipids 1997;90:97-107.