Ricardo Lima Pereira
Licenciatura em Ciências da Engenharia Química e Bioquímica
Aptamers Binding to Bradykinin
Dissertação para obtenção do Grau de Mestre em Bioquímica para a Saúde
Orientador: Prof. Doutor Alexander Henning Ulrich, Instituto de Química da
Universidade de São Paulo
Ricardo Lima Pereira
Licenciatura em Engenharia Química e Bioquímica
Aptamers Binding to Bradykinin
Dissertação para obtenção do Grau de Mestre em Bioquímica para a Saúde
Orientador: Prof. Doutor Alexander Henning Ulrich, Instituto de Química da
Universidade de São Paulo
Elo de Ligação: Prof. Doutor Michel Kranendonk, Nova Medical School -
Universidade Nova de Lisboa
Júri:
Presidente: Prof. Doutora Maria Teresa Nunes Mangas Catarino
Arguente: Prof. Doutora Ana Luísa Ferreira Simplício Vogais: Prof. Doutora Ana Luísa Ferreira Simplício
Prof. Doutor Alexander Henning Ulrich
Faculdade de Ciências e Tecnologia da Universidade Nova de Lisboa
The work presented in this MSc dissertation was done at the Neurosciences Lab within the
III
V Acknowledgements / Agradecimentos
Em primeiro lugar, quero agradecer ao meu orientador- Professor Henning Ulrich- por ter apostado em mim. Ao abrir as portas do seu laboratório abriu-me, também, as portas da ciência e de um futuro novo e promissor, repleto de crescimento profissional e pessoal- um gesto que relembrei e tentei retribuir em cada passo deste projecto.
Um agradecimento, também, ao Professor Doutor Michel Kranendonk por ter feito a ponte entre as duas instituições- FCT-UNL e IQ-USP- e entre os dois países; um gesto que me permitiu
"trabalhar em casa fora de casa”.
Quero, também, agradecer aos meus colegas e amigos Arquimedes, Claudiana e Ana Paula, pelo companheirismo, pelo carinho e pelo esforço incansável durante todo o processo científico que levou à aprimoração deste trabalho- ele é tanto meu como vosso!
Agradeço, também, aos restantes colegas e amigos do laboratório pela amizade, pela receptividade e, acima de tudo, pela paciência para os meus devaneios!
Não podia deixar de agradecer ao IQ-USP por me aceitar como aluno e permitir a execução deste trabalho e à FCT-UNL; em particular, aos Professores Teresa Catarino, Sebastião Rodrigues, Pedro Matias e Ricardo Franco: a concepção deste mestrado foi uma iniciativa extraordinária e a proximidade com que acompanharam esta primeira “remessa” de alunos revelou um profissionalismo e dedicação exímios.
Agradeço, também, aos meus amigos (vocês sabem quem são!) que ficaram em terras lusas e que nunca deixaram de manifestar o seu apoio nesta grande mudança; assim como à “nova família” que encontrei no Brasil- Ana, Pedro e Cris (a força motriz!)- que todos os dias cimenta a convicção de que esta mudança foi para melhor.
Por último, mas não menos importante, quero agradecer às três pessoas mais importantes ao longo deste processo- aquelas que me deram e dão, dia após dia, a força para construir o dia seguinte:
- a minha namorada; amiga e companheira de todas as horas - a minha querida irmã; a outra metade de quem sou
Para o meu pai:
VII
Everything has been figured out, except how to live.
Abstract
Bradykinin is a peptide of the kinin group, involved in a number of receptor-mediated physiological actions, including inflammation and vasodilation, as well as neuromodulation, neuroprotection and promotion of neurogenesis.
Bradykinin is the main ligand of the B2 receptor- the main kinin receptor- which is involved in the cardiac and renal protective effects of kinins in diseases. Antibodies have been considered for a long time as promising therapeutic agents in various fields, especially cancer-related ones. Aptamers, on the other hand, have proven to be an excellent alterative, since they have similar properties to those of monoclonal antibodies, such a specificity of recognition and high-affinity binding. Plus, they are developed using in vitro selection procedures and can be
reproduced by enzymatic reactions. SELEX is a powerful tool for the development of both DNA and RNA aptamers. The main goal of this project was to design a method to select aptamers against bradykinin using capillary electrophoresis alongside the SELEX technique.
The selection was done by comparing the aptamers’ (ssDNA-target complex) electrophoretic mobility with that of the ssDNA and the target, which allowed us to define an appropriate collection window that took into consideration the analytes’ detection time, thus enabling the
collection of the desired oligonucleotides. After two selection rounds, the collected pool was
sequenced, the affinity was measured and the aptamers’ secondary structure was predicted. We concluded that with only two selection cycles, the original DNA library’s bulk affinity grew around 0.4%. The structural characterization of the aptamers, performed with the aid of the Mfold software, revealed that there are many repetitive motifs amongst them, indicating that the selection process was successful.
We have obtained 16 sequences of candidate aptamers as bradykinin ligands of similar sequences and secondary structures whose biological activity should be analyzed after synthesis; mainly in regard to their role as bradykinin inhibitors.
XI Resumo
A bradicinina é um péptido pertencente ao grupo das cininas que está envolvido em várias acções fisiológicas: desde inflamação e vasodilatação a processos de neuromodulação e neuroprotecção. É, também, o ligando principal do receptor B2- o receptor principal das quininas, que está envolvido nas suas acções protectoras em doenças renais e cardíacas.
Tanto os anticorpos monoclonais como os aptâmeros sintetizados através da química combinatória têm vindo a ser desenvolvidos como drogas de acção in situ. Durante muito
tempo, os anticorpos foram considerados ferramentas terapêuticas com um potencial elevadíssimo. Já os aptâmeros, por sua vez, têm-se vindo a revelar uma óptima alternativa, por possuírem maior especificidade e afinidade e serem simples de sintetizar, além de poderem ser desenvolvidos contra qualquer alvo. O SELEX é uma ferramenta poderosíssima no que toca ao desenvolvimento de aptâmeros. O objectivo principal deste projecto foi desenvolver um método de selecção de aptâmeros contra a bradicinina através do acoplamento da electroforese capilar à já conhecida técnica de SELEX.
A selecção dos aptâmeros foi efectuada por comparação das suas mobilidades electroforéticas (ou seja, da mobilidade electroforética do complexo ssDNA-alvo) com aquelas da biblioteca de DNA inicial e a do alvo. Esta comparação permitiu deifnir uma janela temporal adequada para colecta dos oligonucleótidos pretendidos. Depois de efectuados dois ciclos de selecção, a pool
seleccionada foi sequenciada e a sua afinidade pelo alvo foi medida. Concluímos que, com apenas dois ciclos de selecção, a afinidade dos oligonucleótidos aumentou em 0.4%. A análise da sua estrutura secundária através do programa Mfold permitiu identificar motivos muito semelhantes entre as sequências obtidas, o que demonstra uma selecção bem sucedida, na qual se obtiveram 16 sequências com constituição e estrutura semelhantes cuja actividade biológica face à inibição daquela da bradicinina deve ser analisada depois de sintetizados os aptâmeros.
Contents
Abstract ... VII Contents ... XIII Figures ... XVII Tables and Equations ... XIX Abbreviations ... XXI
Chapter 1 ... 1
Introduction ... 1
1.1. Aptamers and SELEX- Promising Tools in Treatment and Diagnostics ... 3
1.2. Capillary electrophoresis ... 6
1.3. The role of capillary electrophoresis in SELEX ... 9
1.4. Bradykinin ... 13
1.4.1. Bradykinin and kinins ... 13
1.4.2 Bradykinin and its receptors ... 14
1.4.3. Bradykinin and its classic therapeutic functions ... 15
1.4.4. Bradykinin’s role in neurodiferentiation and neuroregeneration ... 16
1.4.5. Other Possible Therapeutic Applications ... 17
1.5. The Goal of This Project ... 18
Chapter 2 ... 19
Results ... 19
2.1. Capillary electrophoresis assay (migration of bradykinin, DNA pool and bradykinin-bound DNA) and Determining the Kd ... 21
2.1.1. First Selection Cycle... 21
2.1.1.1 Bradykinin Photometric Analysis ... 21
2.1.1.2. Bradykinin CE Analysis ... 23
2.1.1.3. DNA and DNA-Target Complex ... 25
2.1.1.4. Defining the Collection window ... 28
2.1.2. Second Selection Cycle ... 29
2.1.2.1. Preparing the ssDNA ... 29
2.1.2.2. Re-Analyzing the Target ... 30
2.1.2.3. Analyzing the Selected Oligonucleotides ... 31
2.1.2.4. Analyzing the New DNA-Target Complex ... 32
2.2. Aptamer Sequencing and Structure Analysis ... 35
2.3. Aptamer Affinity Assay ... 40
2.3.1. Flow Through, Washing Procedures and Target ... 41
Chapter 3 ... 43
3.1. General Considerations ... 45
3.2. Preliminary Target Analysis ... 45
3.3. Capillary Electrophoresis- Method Development and Subsequent Analysis ... 46
3.3.1. Bk ... 46
3.3.2. ssDNA ... 47
3.3.3. DNA-Target Complex ... 49
3.3.4. Kd ... 51
3.4. DNA Sequencing ... 51
3.5. Affinity Assay ... 51
3.6. Final Remarks ... 52
Chapter 4 ... 53
Materials and Methods ... 53
4.1. Target analysis using FlexStation3 ... 55
4.2. Standard PCR for library amplification ... 55
4.3. Simple PAGE ... 56
4.4. DNA denaturation/strand separation ... 56
4.5. DNA Extraction/Purification with Phenol and Chloroform ... 57
4.6. ssDNA Folding and ssDNA-Target Complex Formation ... 57
4.7. Capillary electrophoresis (Bk, DNA and DNA-target complex) ... 58
4.8. Determining the Kd and the Collection Window ... 59
4.9. Aptamer sequencing ... 60
4.10. Affinity Assay ... 61
XVII Figures
Figure 1 - Schematic representation of the SELEX procedure used to obtain DNA aptamers. .... 4
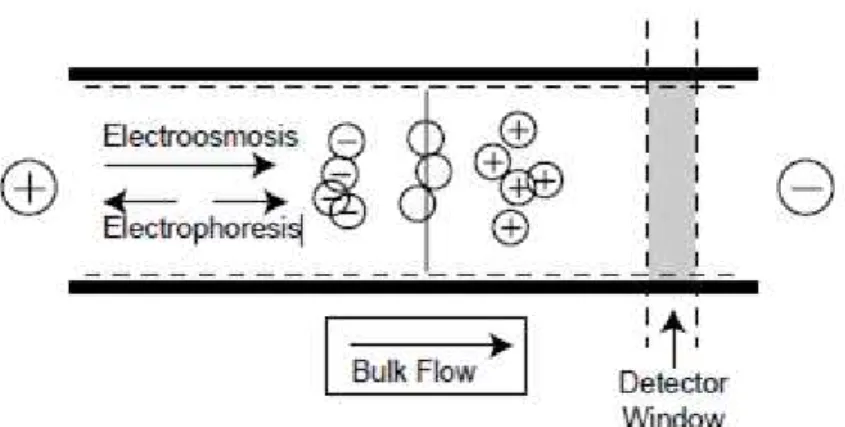
Figure 2 - Schematic of electrophoresis and electroosmosis in a separation of anionic, neutral, and cationic analytes. ... 7
Figure 3 - Schematic representation of aptamer selection using SELEX 42 ... 9
Figure 4 - Schematic representation of non-SELEX selection of aptamers. ... 10
Figure 5 - Schematic representation of NECEEM-based determination of DNA affinity to the target (T)... 11
Figure 6 - Choosing an aptamer-collection window ... 12
Figure 7 – Schematics of aptamer collection in different time windows. ... 12
Figure 8 – Schematic depiction of the bradykinin molecule. ... 13
Figure 9 – Bradykinin photometric analysis. ... 22
Figure 10 – Bradykinin analysis in capillary electrophoresis.. ... 24
Figure 11 – Buffer interference. ... 25
Figure 12 - Denaturizing PAGE for template amplification.. ... 26
Figure 13 – First three runs with the original ssDNA pool. ... 27
Figure 14 – Three overlaid runs of the DNA-target complex. ... 27
Figure 15 – Schematic depiction of the collection window used in the first selection round. .... 28
Figure 16 – Standard PAGE assay for evaluating the success of the collection process ... 29
Figure 17 - PCR series with varying number of cycles ... 30
Figure 18 - Bk analysis or the second cycle in different concentrations ... 31
Figure 19 - Three different runs for three different concentrations.. ... 32
Figure 20 - Fig. – Three different runs of the new aptamer-target complex ... 33
Figure 21 - Schematic representation of the collection window used in the second selection cycle. ... 33
Figure 22- Standard PAGE assay for evaluating the success of the collection process. ... 34
Figure 23 – PCR series with varying number of cycles ... 35
Figure 24 – Representation of the secondary structures of the sequences 1.2/3.1, 1.3/3.4 and 2.1/4.2/5.1... 37
Figure 25 - Comparison between the affinity results obtained with the original library and the selected aptamers.. ... 42
Figure 26 - Overlay of both the ssDNA and ssDNA-target complex peaks. ... 49
XIX Tables and Equations
Equation 1 - Migration rate………..pg. 6
XXI Abbreviations
Bk- bradykinin
CE- Capillary Electrophoresis
EOF- Electroosmotic flow Arg- Arginine Pro- Proline Gly- Glycine Phe- Phenilalanin Ser- Serine Des-Arg9- Des-Arginine-9
Bk 1-5- the 1-to-5 amino acid fragment of bradykinin (Arg-Pro-Pro-Gly-Phe) ACE- Angiotensin-Converting-Enzyme
B2BkR- B2 Bradykinin Receptor
HOE 140 (a Bk inhibitor also known as icatibant acetate, firazyr or JE 049)- D-Arg-L-Arg-L- Pro-L-Hyp-Gly-L-(2-thienyl)Ala-L-Ser-D-1,2,3,4-tetrahydro-3-isoquinolinecarbonyl-L-(2α,3β,7aβ)-octahydro-1H-indole-2-carbonyl-L-Arg
iPS- Induced Pluripotent Stem Cells CNS- Central Nervous System
SELEX- Systematic Evolution of Ligands by Exponencial Enrichment DNA- Deoxyribonucleic Acid
RNA- Ribonucleic Acid PEG- Polyethylene Glycol ATP- Adenosine Try-Phosphate
VEGF- Vascular Endothelium Growth Factor PCR- Polymerase Chain Reaction
HPLC- High Pressure Liquid Chromatography KCE- Kinetic Capillary Electrophoresis
NECEEM- Non-Equilibrium Capillary Electrophoresis of Equilibrium Mixtures CE-SELEX – Capillary Electrophoresis-SELEX
Chapter 1
3 1.1.Aptamers and SELEX- Promising Tools in Treatment and Diagnostics
Today, combinatorial chemistry is one of the most promising tools at the pharmaceutical
industry’s disposal, when it comes to discovering and developing new therapeutic molecules. In a glance, its use consists in three steps: synthesizing a new and random molecular library, selection against a specific target and finally and characterizing the newly formed ligand-target complex.
Nucleic acids are, definitely, compounds of interest in this field, because not only do they fold into well-defined secondary and tertiary structures but, also, are easy to synthesize1. With that in mind, in 1990, Tuerk, Gold, Ellington and Szostak developed a technique that allows the isolation of nucleic acid molecules from a library with over 1015 sequences. That technique was then called SELEX (Systematic Evolution of Ligands by EXponential
Enrichment) and those molecules, aptamers (from aptus, in latin, which means “on/snap”)2, 3.
SELEX can also be referred to as in vitro selection or in vitro evolution. It is a combinatorial
chemistry technique used to produce oligonucleotides of either RNA or single-stranded DNA that specifically bind to a particular target 2, 4.
This technique allows (and has been put to that use) the selection of aptamers with high specificity and selectivity for a variety of targets, including small molecules such as ATP5, adenosine6,7 and proteins such as prions8, as well as vascular endothelial growth factor (VEGF)9.
However, there is no common protocol selection to all targets. The design of the SELEX procedure depends on the target, the oligonucleotide library, the application as well as the type of aptamer one intends to create.
The starting point for the SELEX technique is the synthesis of a library of single-stranded DNA (ssDNA, single-stranded DNA) containing about 1015different sequences. Each sequence has a
random region with 16 to 75 positions flanked by two constant regions, where primer annealing occurs, as well as digestion with restriction enzymes.
This chemically synthesized DNA is then enzymatically amplified using the polymerase chain reaction (PCR). After this, the double-stranded reaction product generated is denatured to a pool of single-stranded DNA oligonucleotides (ssDNA). The ssDNa is then submitted to specific temperature variations in specific time-frames in order to adopt two- and three-dimensional arbitrary structures that take advantage of the complementarity between its base pairs. This process is called DNA folding, and is crucial to enable the interaction between the ssDNA and the target during incubation. After the folding process, the ssDNA is then exposed to its target in order to select the sequences that constitute the desired aptamers10.
4 It is, in its essence, an evolutionary process consisting in variation, selection and replication2. And also a lengthy one, since it can take up to 20 cycles to obtain the desired affinity11.
Figure 1 - Schematic representation of the SELEX procedure used to obtain DNA aptamers.
Since the inception of this technique, both DNA and RNA aptamers have been selected against various targets – ions, small molecules or even membrane receptors- and have demonstrated both affinity and specificity that pairs with that of monoclonal antibodies12, 13.
Both monoclonal antibodies and combinatorial synthesized aptamers are being developed as site-specific drugs to bind to specific proteins that reveal altered activities in disease states. Antibodies have been considered for a long time as promising therapeutic agents in various fields, especially cancer-related ones14.
Aptamers, however, have proven to be an excellent alternative, since they have similar properties to those of monoclonal antibodies, such a specificity of recognition and high-affinity binding. Plus, they are developed using in vitro selection procedures, can be developed
against almost every target, do not require in vivo selection during their development and can be
truncated to small biological-active sequences and modified for optimization10,9,15.
Aptamers are nucleic acid or peptide molecules that bind to a specific target molecule and living cells with high affinity and specificity, making them promising affinity ligands and distinct tools as affinity probes and analytical and therapeutic reagents16, 17, 18, 19
5 bind a small molecule, resulting in a change in production of the proteins that it encodes- autoregulated mRNA20, 21, 22) and can be used for both basic research and clinical purposes as macromolecular drugs. Also, they can be combined with ribozymes to self-cleave in the presence of their target molecule.
Aptamers are useful in biotechnological, therapeutic and/or diagnostic applications as they offer molecular recognition properties that rival that of the commonly used biomolecules- antibodies23, 9. In addition to their discriminative recognition, aptamers offer advantages over antibodies as they can be engineered completely in a test tube, are readily produced by chemical synthesis, possess desirable storage properties and elicit little or no immunogenicity in therapeutic applications.
Non-modified aptamers are cleared rapidly from the bloodstream, with a half-life of minutes to hours, mainly due to nuclease degradation and clearance from the body by the kidneys, a result of the aptamer's inherently low molecular weight15. Unmodified aptamer applications currently focus on treating transient conditions such as blood clotting, or treating organs such as the eye where local delivery is possible. This rapid clearance, alongside the already mentioned high selectivity and affinity, represent advantages in applications such as in vivo diagnostic imaging.
A good example is the tenascin-binding aptamer under development by Schering AG for cancer imaging.
Their high binding affinity and specificity, among other characteristics, has made them attractive diagnostic applications to target intra- and extracellular components of key signaling pathways24. One such example is the already known RNA aptamer against the epidermal growth factor receptor (EGFR), which allows detection and/or extent of glioblastoma multiforme24. Also, aptamers have been recently used as immobilized ligands or in homogeneous assays. Several important aspects have to be examined in details when using aptamers as immobilized ligands, such as the immobilization process25. Several findings demonstrated that aptamers could be differently susceptible to assay protocols and that optimal operating conditions could be different from one aptamer to another26.
If all these important aspects are taken into consideration, the application of aptamers as bio-components in diagnostic assays offers a multitude of advantages, such as the possibility of easily regenerating the function of immobilized aptamers and the possibility of using different detection methods due to easy labelling25.
6 They have also been successfully used in proteomics and development of bioanalytical assays32, inhibition of enzymes and receptors33, 34, development of ribozymes and aptazymes35, target validation and screening for drug candidates36, 37. In fact, their potential is so big that applications include gene therapy and drug delivery to therapeutic targets38. Their reputation grew immensely in the past years and they’re considered promising tools in the treatment of various pathologies39 and some are actually undergoing pre-clinical trials40.
1.2.Capillary electrophoresis
Electrophoresis is the process of separating charged molecules (analytes) under the influence of an electric field.
Capillary electrophoresis (CE) is a relatively new and powerful separation technique that has taken essential components from both HPLC and electrophoresis.
In CE methods, analytes migrate through electrolyte solutions under the influence of an electric field inside a capillary tubing and, during this process, they can be separated according to ionic mobility. This technique can be viewed as an instrumental approach to electrophoresis and is ideally suited for handling small amounts of sample material to be analyzed and/or separated
under the influence of such field.
The ability to analyze such small amounts of sample material is in high demand; a demand that becomes increasingly prominent in bioanalytical research, e.g., in biotechnology and in various
clinical, diagnostic and genetic applications.
Preceding modern CE, it is interesting to note that, as early as 1953, some experimenters recognized the importance of dealing with certain biological samples using the smallest apparatus available. For example, ribonucleotides could be identified in single cells using
“micro-electrophoresis” in fine silk fibers (Edstrom, 1953).
CE takes advantage of two types of driving forces- the force causing the electrophoretic migration and the force exerted by the electroosmotic flow (EOF) through the capillary.
7
Figure 2 - Depiction of electrophoresis and electroosmosis in a separation of anionic, neutral, and cationic analytes. The injection takes place in the far left side of the capillary and the outlet is on the far right41.
The analyte’s migration rate, or apparent mobility, depends on the applied electric field (V) and
its own specific mobility (µ), which is constant for a given set of conditions, as depicted in Equation 1 (where L is the length along which the voltage is applied and µ is the sum of the
analyte’s electroosmotic and electrophoretic mobility).
Equation 1 - Migration rate V=µ•(V/L)
Given the fact that the capillary has a high surface to volume ratio, the applied voltage is far higher than the one used in other electrophoretic techniques, however, there are limits to consider, given the fact that, even though the capillary can be cooled down, it still caves when submitted extremely to voltages.
With untreated fused silica tubing and an aqueous buffer such as NaOH, a negatively charged capillary surface is obtained. The magnitude of the EOF depends on various experimental factors, most notably the pH of the buffer solution. Capillary coatings can reverse, reduce, or even totally eliminate the EOF41. The type of buffer and both its ionic strength and pH can be varied and optimized for any particular separation problem.
With untreated fused-silica capillaries, the use of high-pH buffers generally produces fast separations due to high electroosmotic flow (EOF). At a low pH, peptides migrate primarily on the basis of their charge-to-mass characteristics and the EOF is diminished, whilst at high pH, the EOF increases. Borate, in particular, is a popular buffer in CE for a wide variety of applications, having a pH in the range of 7.5 to 10. This buffer has an inherently low
8 The efficiency of this technique is, typically, much higher than the efficiency of other separation techniques, such as HPLC. Unlike HPLC, in capillary electrophoresis there is no mass
transfer between phases 43.
Another important factor is that the EOF does not significantly contribute to band broadening as in pressure-driven chromatography. Capillary electrophoresis separations can have several hundred thousand theoretical plates 44 (N)- a stage in which two phases establish
an equilibrium with each other, mathematically expressed as presented in the equation below:
Equation 2 – Mathematical expression of the number of theoretical plates
N=µV/2Dm
Where µ represents the apparent mobility in the separation medium and Dm is the
analyte’s diffusion coefficient. According to this equation, the efficiency of separation is limited by diffusion and is proportional to strength of the electric field (V). In theory, unlike other types of electrophoretical assays, one could increase (dramatically, even) the voltage because the capillary has a high surface-to-volume ratio. However, in practice, the strength of the electric field is limited to several hundred volts per centimeter. If high potentials are applied, it may lead to capillary breakdown. Plus, at sufficiently high field strengths, the excessive heating becomes so strong, that radial temperature gradients can develop within the capillary. Since electrophoretic mobility of ions is generally dependent (due to both temperature-dependent ionization and solvent viscosity effects), a non-uniform temperature profile results in variation of electrophoretic mobility across the capillary, and a loss of resolution (R), which is mathematically expressed as shown below:
Equation 3 – Mathematical expression of resolution in CE
Rs= (1/4)[ µpN1/2/(µp+µo)]
According to this equation, maximum resolution is reached when the electrophoretic and electroosmotic mobility have opposite signs and similar magnitude. In addition, one can infer that high resolution requires lower velocity and, therefore, increased analysis time43 which can
be correlated to the path taken by the analytes, meaning, the capillary’s length.
9 Separative transport arises from the interaction between the molecules and their environment, and how it affects their free energy. The separation mechanism may be based on phase equilibria, such as adsorption or ion-exchange.
Regarding dispersive transport, or band broadening, is the total sum of processes of the dispersing zones about their gravity centers. Good examples of this are diffusion, convection and mass transfer45.
1.3. The role of capillary electrophoresis in SELEX
Despite aptamers’ great promise, as well as the significant effort put into their manufacture over
the last two decades or so, they have been selected against only approximately 100 protein targets46.
This slow progress is largely due to the limitations of conventional technologies used for aptamer development- SELEX.
As explained previously, SELEX involves repetitive rounds of two alternating processes- separating target-bound DNA (aptamers) from free DNA and amplification of aptamers by PCR (Figure 3).
Figure 3 - Schematic representation of aptamer selection using SELEX.47
Filtration and gel-electrophoresis are two examples of non-instrumental methods of partitioning that still dominate the area4,48,49.
As a result, SELEX based on conventional partitioning methods is not only a lengthy and resource-consuming process but, also, one that leads to DNA structures with low target-affinity or bind to the filters surface or chromatographic supports used in separation, thus compromising their viability.
Kinetic capillary electrophoresis (KCE) methods50 have established a new methodological platform for the partitioning of aptamers.
10 As a result, KCE methods decrease the number of rounds of SELEX from 20 (required by conventional partitioning techniques)11 to about half a dozen. Also, it has been proposed that one round might even be enough to obtain the desired aptamer, using only partitioning methods without intermediate amplification (Figure 4)- a process called non-SELEX selection of aptamers47.
Figure 4 - Schematic representation of non-SELEX selection of aptamers. With this technique, the aptamers can
be obtained without intermediate amplification of candidates 47
In addition, KCE methods can be equally used for selection of aptamers and for measurements of their binding parameters, such as the equilibrium dissociation constant (Kd)52, 53
Also, in a recent proof-of-principle work, Krylov et al. (2006)54 demonstrated the use of NECEEM-based non-SELEX for the selection of DNA aptamers against h-Ras protein54, HIV-1 transcriptase55 and selection of smart aptamers56, 57.
11
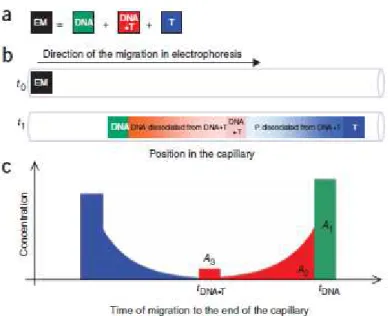
Figure 5 -Schematic representation of NECEEM-based determination of DNA affinity to the target (T). (a)
Components of the equilibrium mixture (EM): DNA, DNA–target complex (DNA•T) and target (T). (b)
NECEEM-based separation of DNA, T and DNA•T. A short plug of the EM is injected into a capillary at time t0. High voltage is then applied. It is assumed that T migrates faster than DNA; DNA•T typically has an intermediate mobility.
Equilibrium fractions of free DNA and T migrate as individual zones (green and blue rectangles), which do not
change in time. The equilibrium fraction of DNA•T continuously dissociates during separation, leaving smears of DNA (red) and T (blue). By time t1, only a fraction of DNA•T remains intact (red rectangle). (c) The parameters obtained from a single NECEEM electropherogram for the determination of Kd, areas A1–A3 and migration times of the complex (DNA•T) and free DNA (DNA) 47.
In the pre-selection steps, migration times of the target, naive DNA library and DNA–target complex (if detectable) are measured. These parameters are used to determine the time frame (or collection window) where aptamers must be collected47.
This is the key step in separating the aptamers from the rest of the DNA, when using this technique.
Determining this window requires several tests, in order to determine the optimal conditions in which the DNA, the target and the DNA–target complex migrate inside the capillary, and it can be done in two ways: if one has a well-defined complex peak, that’s where the focus goes to; if not, the collection window will go from the beginning of the target’s peak to the beginning of
12
Figure 6 – Determining an adequate aptamer-collection window.(a) A complex of DNA with the target (h-Ras
protein) is not detectable in the bulk-affinity assay. The top and bottom traces are electropherograms of h-Ras protein (UV detection at 280 nm), and the equilibrium mixture of h-Ras and naive DNA library (fluorescence detection), respectively. (b) A complex of DNA with the target (MutS protein) is detectable in a bulk-affinity assay. The top and bottom traces are electropherograms of MutS protein (UV detection at 280 nm), and the equilibrium mixture of MutS and DNA library (fluorescence detection), respectively 54.
The fractions to be collected from the output of the capillary in a time window depend of specific goals, as demonstrated in Figure 7:
Figure 7 – Schematics of aptamer collection: different time-frames for different fragment collections.
Positive selection corresponds to collecting the equilibrium fraction of target-bound DNA (red), which preferably contains DNA with high affinity for the target (Kd < [T]). Negative selection is the collection of the equilibrium fraction of free DNA (green), which preferably contains DNA with low affinity for the target (Kd > [T]). Adapted from Berezovski, M. et al. (2006) Nonequilibrium capillary electrophoresis of equilibrium mixtures: a universal tool for development of aptamers. Journal of the American Chemistry Society, 127, pp 3165–3171.
13 target-bound DNA. Negative selection from the equilibrium mixture that only contains the incubation buffer can be used to exclude from the library aptamers for buffer components Because the free DNA has its own electrophoretic pattern, the negative collection must be done in the same collection window as the aptamers in order to ensure that only the sequences with the most affinity are being selected.
This can be done more than once and an average of three to four rounds should be enough to obtain oligonucleotides with good affinity.
In the cloning and sequencing steps, individual sequences from the best pool are amplified by bacterial cloning and asymmetric PCR and, then, sequenced, in order to obtain the representative sequences. Those that appear to be the most repetitive are then synthesized. In the analysis steps all the collected DNA fractions are concurrently amplified by PCR using the optimized number of PCR cycles. The strands of double stranded PCR products are separated to obtain single-stranded aptamer pools and, finally, the bulk affinities of aptamer pools to the target are measured.
Once the sequenced product is available (that is, synthesized), this step should be repeated, in
order to allow an accurate measure of the aptamers’ affinities.
Finally, the Kd is to be obtained using the areas of the peaks obtained. This can be done with both the bulk product obtained and/or with the already synthesized aptamers, the latter giving more reliable results.
1.4. Bradykinin
1.4.1. Bradykinin and kinins
Bradykinin (Bk) is a physiologically and pharmacologically active peptide of the kinin-kallikrein system consisting of nine amino acids- Arg-Pro-Pro-Gly-Phe-Ser-Pro-Phe-Arg- and has a PI of approximately 11.31. This bioactive peptide was discovered in 1948 by Brazilian physiologists and pharmacologists working at the Instituto Biológico, in São Paulo, Brazil58.
14 Bradykinin, lysyl-bradykinin and their des-Arg9 metabolites are mammalian peptides, collectively called kinins, involved in a number of receptor-mediated physiological actions, including inflammation and vasodilation. Bradykinin is not only important for inflammation and blood pressure regulation, but is also involved in neuromodulation and neuroprotection as well as promotion of neurogenesis59.
A class of drugs called ACE inhibitors increase bradykinin levels (by inhibiting its degradation) further lowering blood pressure. Bradykinin works on blood vessels through the release of prostacyclin, nitric oxide, and Endothelium-Derived Hyperpolarizing Factor to promote vasodilation60.
1.4.2. Bradykinin and its receptors
Bradykinin’s biological activities are mediated by its specific receptors- B1 and B261.
The bradykinin receptors B1 and B2 (respectively, BkB1R and BkB2R or BKB1 receptor and BkB2 receptor) are G-protein coupled receptors leading to an increase in the cytosolic calcium
ion concentration.
The B2 receptor is the main kinin receptor and mediates most of the known physiological action of kinins, including endothelial activation. Contrary to the B1 receptor, BkB2R is constitutively synthesized in target organs, especially blood vessels, and recognizes bradykinin and lysyl-bradykinin as its agonists59.
Also, BkB2R is the main receptor involved in the cardiac and renal protective effects of kinins in diseases62.
On the other hand the B1 receptor seems to be mainly synthesized only in some pathological situations, like ischemia or bacterial infection and release of bacterial toxins. Moreover, this receptor recognizes Des-arg9 kinins, produced from bradykinin and lysylbradykinin under the influence of carboxypeptidases, rather than native kinins.
15 1.4.3. Bradykinin and its classic therapeutic functions
Stimulation of the bradykinin B2 receptor (BkB2R or BkB2 receptor) by kinins is associated with pathophysiological as well as pronounced beneficial effects. Consequently, interference with B2 receptors by either antagonists or agonists offers promising therapeutic approaches regarding treatment of various human diseases. BkB2 receptor antagonists may prove useful for the treatment of pathological situations caused by excessively increased local kinin concentrations, such as inflammation, tissue injury and pain. Also, beneficial effects of peptide BkB2 receptor antagonists in perennial rhinitis, asthma and brain edema have already been demonstrated in clinical trials63. On the other hand, kinins have also been identified as potent vasodilators and organ-protective peptides. Therefore, BkB2 receptor agonists may have the potential to become valuable therapeutic tools in the treatment of cardiovascular diseases such as hypertension, myocardial hypertrophy, myocardial infarction and arrhythmias64. This could be achieved via the use of adequate aptamers. More specifically, these receptors’ roles in
pathological situations could be enhanced through the use of aptamers against bradykinin- ones that promote its pharmacological effects by preventing its degradation and, therefore, stimulate the aforementioned receptor.
Murphey LJ et al. (2001)65 conducted a study that determined a stable metabolite of bradykinin
in the systemic circulation of humans where
infused bradykinin was rapidly degraded, such
that no exogenous bradykinin was detected in venous plasma sampled during infusion.
Bk 1-5 (Arg-Pro-Pro-Gly-Phe), the 1-to-5 amino acid fragment of bradykinin, was
identified as a major stable plasma metabolite of bradykinin.
In humans, bradykinin is rapidly degraded in vivo to Bk 1-5, a stable metabolite.
Measurement of this metabolite could prove to be a useful a tool to assess
pathophysiologic and pharmacologic alterations in systemic bradykinin generation
associated with human disease
65. Also, it has been hypothesized that this peptide affects
vasodilation, fibrinolysis and platelet aggregation in humans
66.
Interestingly, in a different study, Dr. Juerg Nussberger MD et al. (1998)67 conducted an assay that allowed to correlate bradykinin plasma concentrations and both hereditary and acquired angioedema: bradykinin is believed to be the main mediator of symptoms in hereditary (HA) and acquired (AA) angioedema due to C1-esterase inhibitor deficiency, as well as in angioedema that complicates treatment with inhibitors of angiotensin-converting enzyme (ACE). Dr. Juerg’s team was able to follow bradykinin concentrations during attacks and during remission in HA and in AA and, also, in a patient treated with an ACE-inhibitor.
16 captopril were also studied. Among the healthy volunteers, plasma bradykinin concentration was inversely proportional to age. During acute attacks of edema, in both HA and AA, plasma bradykinin rose to values between 2 to 12 times the upper limit of normal. Infusion of C1-esterase inhibitor (the deficient factor in both HA and AA) immediately lowered bradykinin concentrations. In the patient receiving the ACE-inhibitor captopril, bradykinin concentration was very high during an acute attack of angioedema, but normal in remission after withdrawal of the drug.
This study shows that concentrations of this peptide decrease with age in healthy people. Although the differences between patients in remission and healthy controls did not reach statistical significance, there were substantial rises in plasma bradykinin during acute attacks of hereditary, acquired, or captopril-induced angioedema67.
This study also shows that aptamers as Bk ligands could be used as diagnostic tools for pathologies to which Bk is related to. For example, a diagnostic kit could be created, using these aptamers, to measure Bk concentrations in allegedly healthy individuals of a certain age and infer about the possibility of developing angioedema. Also, these very same aptamers could be used as an alternative to ACE-inhibitors, as well as other Bk degradation inhibitors- these act on enzymes that degrade Bk, however, the aptamer would act on the target itself, therefore, making it harder to be degraded regardless of the enzyme.
However, still in regard to ACE-inhibitors, aptamers as Bk ligands also pose a viable alternative due to the fact that ACE is known to convert Aβ42 to Aβ40, the first one being a highly toxic form of beta amyloid, associated with dementia68,69.
1.4.4. Bradykinin’s role in neurodiferentiation and neuroregeneration
Recent studies point at functions of bradykinin in the central nervous system (CNS), including neuromodulation and neuroprotection59. Dr. Ulrich’s team has worked previously in this subject, having reported novel functions for bradykinin in phenotype determination whether a neural progenitor cell (NPC) differentiates into a neuron or a glial cell59.
Three in vitro differentiation models, P19 mouse embryonal carcinoma cells, rat NPCs, and
17 expression in BkB2Rknock-out embryos. Altogether, these results indicate a novel function of Bk in the determination of cell fate in the process of neural differentiation.
In the presence of the BkB2R antagonist Hoe 14070 during rat neurosphere differentiation, neuron-specific β3-tubulin and enolase expression was reduced together with an increase in glial protein expression, indicating that bradykinin-induced receptor activity contributes to neurogenesis. In agreement, Hoe 140 equally affected the expression levels of neural markers during neural differentiation of murine P19 and human iPS cells.
As an underlying transcriptional mechanism for neural fate determination, Hoe 140 induced up-regulation of Notch1 and Stat3 gene expression. Since cell viability and proliferation weren’t
affected during treatment, the group concluded that bradykinin-induced signaling provides a switch for neural fate determination and specification of neurotransmitter receptor expression59.
In regard to Bk’s role in neuroregeneration, Dr. Ulrich’s group is, at the present moment, conducting an animal study in which the preliminary results indicate that Bk may be able to induce mobilization of endogenous stem-cells.
1.4.5. Other Possible Therapeutic Applications for Bradykinin
There is compelling evidence that exogenously applied or endogenously generated kinins, via stimulation of kinin-B2 receptors, activate sensory nerve terminals producing pain and hyperalgesia71 (an increased sensitivity to pain caused by damage to nociceptors or peripheral nerves), and induce the release of proinflammatory and hyperalgesic mediators such as neuropeptides and metabolites derived from arachidonic acid pathways like leukotrienes and cytokines, which also largely contribute to their proinflammatory and nociceptive properties72. Bk produces short-term hyperalgesia while Des-Arg9-Bk (its active metabolite that stimulates B1 receptors), causes long-term hyperalgesia. Therefore, most B2 receptor antagonists have
partial agonist activity and fail to produce antinociception73. In the light of this information, it becomes clear that aptamers against Bk would be important tools in easing the pain of patients by inhibiting its degradation and, therefore, impairing the production of Des-Arg9-Bk whilst aptamers against this metabolite could allow for an adequate diagnostic.
18 diseases like edema, rhinitis, asthma, arthritis and pain74. These diseases might be promising target indications for the development of kinin-B2 receptor antagonists and compounds preventing bradykinin-binding to the receptor, such as aptamers.
1.5. The Goal of This Project
The main goal of this project was to develop aptamers against Bk, using capillary electrophoresis as the standard technique for selection, to be used as a diagnostic tool regarding
this target’s concentration in the human body. Given its role in physiological actions such as inflammation and vasodilation, its role in the CNS and the role some of its metabolites’ play in conditions such as hyperalgesia, fibrinolysis and platelet aggregation, it seems rather reasonable to state that these aptamers would prove to be powerful tools in the medical field.
As stated previously, even though their efficiency has been proved and considering the time that
has passed since their introduction in the scientific community, there aren’t that many aptamers
out there. And even less have been selected using CE- a technique that has also proved to be rather useful in the field.
Chapter 2
21 The project was conducted in three parts:
1. Capillary electrophoresis assay design - migration of bradykinin, DNA pool and bradykinin-bound DNA - and determining the aptamers’ Kd;
2. Isolation of aptamers by DNA sequencing and inferring about their structure; 3. Determining aptamers’ affinity to bradykinin.
2.1. Capillary electrophoresis assay (migration of bradykinin, DNA pool and
bradykinin-bound DNA) and Determining the Kd
2.1.1. First Selection Cycle
2.1.1.1 Bradykinin Photometric Analysis
In order to provide a general oversight of the peptide, a photometric analysis was conducted, using the FlexStation 3 apparatus. At this point, the peptide and its buffer were analyzed in three different assays- one with only the buffer (blank), another with the peptide (1mM) and the buffer and a third with the peptide (in water) in a fairly high concentration (50mM). This assay allowed not only to guarantee the target’s viability but, also, to determine an appropriate wavelength for analysis. The ideal wavelength would be one that showed high absorption and little to no interference.
The photometric analysis was conducted in the typical range for this kind of peptide: 200-400nm.
22
Figure 9 – Bradykinin photometric analysis. Results obtained when performing the spectral analysis of Bk, which
were all quite similar. All showed major absorption at 214nm and a progressive descent along the scale; however, the blank assay only showed absorption at 214nm: a) Blank: Tris-HCl 10mM, MgCl2 4mM, NaCl 150mM, pH 7.4. Major absorption at 214nm. b) Bk 1mM, Tris-HCl 10mM, MgCl2 4mM, NaCl 150mM, pH 7.4. Major absorption ataround 230nm. Some absorption at 260nm can also be seen. c) Bk 50mM in water. Major absorption at 214, 230 and 260nm, the latter being the one displayed.
a
b
23 2.1.1.2. Bradykinin CE Analysis
The results to be shown from here on now were not obtained at once; rather, all required multiple attempts in different settingsa.
These attempts involved, mainly, the use of different buffers in order to establish the appropriate conditions for the ssDNA to fold and bind with the target and, more importantly, to establish an appropriate collection window.
In all assays, the areas of the peaks were calculated (automatically, in the equipment), which allowed not only to obtain the Kd for each selection cycle but, also, to understand the consequences of varying the concentration of the same analyte under the same conditions and understand if there was a correlation between these two variables. The electropherograms obtained in this analysis are presented below.
The first plot shows the first run performed with the target (Figure 10 a). After that, the target was analyzed again in two different concentrations (Figure 10 b).
We have observed that, in these conditions specifically, Bk shows a detection time of around 2min and that the plot area variation is proportional to that of the concentration. Some noise was also detected.
24
Figure 10 – Bradykinin analysis by capillary electrophoresis. a) First run with Bk: Bk 150uM in Tris-HCl 10mM,
MgCl2 4mM, NaCl 150mM, pH 7.4. Capillary: 60cm total length, 75µm ID, 375µm OD. Separation buffer: borate 25mM, pH 9.3. 214nm wavelength. Capillary temperature: 25ºC b) Overlay of the first run with three others. Same conditions with varying Bk concentrations. The areas, obtained with the equipment, have been normalized in order to analyze the linearity between the peaks and the concentration- an average value was calculated using all values for each observable peak.
Interestingly, there’s a peak on the far right that does not quite seem to agree with what was expected.
In order to understand what it might be, a blank assay was performed (Figure 11 a), revealing that that peak can be attributed to the electroosmotic flow (EOF). After that, in order to guarantee that the conclusion is reliable, the results obtained with bradykinin were compared to those obtained with CD73 (Figure 11 b) - a protein that converts AMP to adenosine and phosphate, which, in turn, activates specific receptors on the membranes of the immune
system’s cells - which was being studied by Dr. Arquimedes Cheffer who intends to develop a
25 aptamers against it. We have observed that that same peak is also present, which means that, indeed, there is EOF to be considered in these assays.
Figure 11 – Buffer interference. a) Blank assay: Tris-HCl 10mM, MgCl2 4mM, NaCl 150mM, pH 7.4. Capillary: 60cm total length, 75um ID, 375um OD, 214nm wavelength. b) Bk 150uM overlaid with CD73 500nM and CD73 500nM. Separation buffer: borate 25mM, pH 9.3. The overlaid peaks are quite noticeable, representing the interaction between the buffer and the sample buffer in both cases.
2.1.1.3. DNA and DNA-Target Complex
In regard to the original DNA pool (a random DNA pool purchased from Life Technologies, containing 70bp), it was amplified using a standard PCR procedure, so that more product could be used and, then, submitted to a denaturizing gel electrophoresis assay, since the DNA is required to be single stranded.
The result obtained was quite satisfactory, as it allowed the experiment to continue. a
26
Figure 12 - Denaturizing PAGE after template amplification. All four wells contain the original DNA library. The
arrows point to both strands after separation. The one on top contains the primer marked with PolyA, whereas the one on the bottom contains the primer marked with FitC.
After amplification and strand separation, the DNA was submitted to the standardized folding procedureb.
After this, the DNA pool was analyzed with the CE apparatus, using the same method as described before for the peptide with the LIF detector mounted. Again, multiple runs were performed, using different DNA concentrations- 100, 150 and 200nM- all in the same buffer- tris-HCl 10mM, MgCl2 4mM, NaCl 150mM, pH 7.4. As with other plots presented here,
varying the concentration allows to infer about the linearity of the assays performed and peak identification. The ssDNA presented an average migration time of around 10min, and considerable fluorescence, even with a concentration of 100nM (Figure 13). As seen when
analyzing bradykinin, the area variation of the plots is proportional to that of the analyte’s
concentration.
27
Figure 13 – First three runs with the original ssDNA pool. Three different concentrations were used- 100nM,
150nM and 200nM- all in tris-HCl 10mM, MgCl2 4mM, NaCl 150mM, pH 7.4. Capillary: 60cm total length, 75µm ID, 375µm OD. Separation buffer: borate 25mM, pH 9.3. The areas, obtained with the equipment, have been normalized in order to analyze the linearity between the peaks and the concentration- an average value was calculated using all values for each observable peak.
After this, a new sample of the same ssDNA was appropriately prepared and incubated with the target, in order to be analyzed. This assay was performed three times, under the same conditions as the ssDNA, revealing fluorescence values in the same order. The complex was detected at around 7.5min.
28 2.1.1.4. Defining the Collection window
Once these assays were concluded, one had to define an appropriate collection window. In order to do this, one has to consider both the total length of the capillary (Ltotal) and the length from the injection point to the detection window (Ldetector) have to be taken into consideration47. These values allowed us to determinate the correction factor, which will, then, be multiplied by the starting and ending points of the window, on the horizontal axis. This is crucial, since it allowed us to understand at what point the sample we’re observing on screen is ejected to the output vial. In other words, it is the actual time it takes for the sample to run through the whole capillary.
Since the ssDNA-target complex did not present a specific peak, the collection window was defined considering the detection times of the target and the ssDNA. More specifically, it begins when the target starts to show up and stops right before the ssDNA starts to show up, thus guaranteeing that any genetic material collected corresponds to the aptamers.
Figure 15 – Schematic depiction of the collection window used in the first selection round. The window was defined considering that the complex peak is quite similar to that of the ssDNa47. Two collections have been made- negative and positive. The plots presented have been showed previously.
The fraction collection was performed 10 times for both the positive and negative controlsc. Both DNA pools were then submitted to 15 cycles of PCR, in order to allow adequate manipulation.
The Kd47 obtained for this cycle was 73µMd.
29 2.1.2. Second Selection Cycle
2.1.2.1. Preparing the ssDNA
The start of a new selection cycle resembles that of the previous one- it begins with a standard PCR reaction, strand separation and CE analysis, ending with yet another DNA fraction collection.
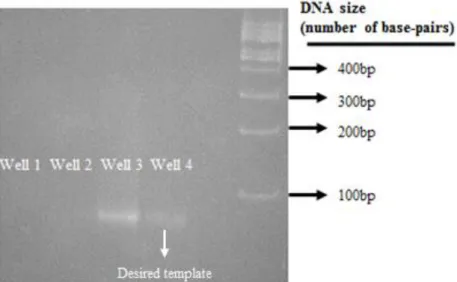
Both controls were submitted to 15 cycles of PCR (the lab’s standard procedure)e, in order to allow adequate manipulation. After this, a PAGE assay was performedf, in order to confirm the results. Five wells were used in total, containing a blank assay (water as template), the negative control (negative collection), a positive control (the original library), the template (positive collection) and a 100bp ladder as marker. The results revealed that the collection was a success, since no unspecified genetic material was amplified (meaning it had not been collected) whereas the aptamers had. Also, there was no primer self-replication. Figure 16
Figure 16 – Standard PAGE assay for evaluating the success of the collection process. From left to right (well 1 through well 4): blank, negative collection, positive control and positive collection. The 100bp ladder is on the far right. Well 1 indicates that there was no amplification of non-specified template, well 2 indicates that the collection window is adequate and that no free ssDNA is being collected. The DNA ladder is on the far right, along with the base-pairs sizes for each band.
After the first set of cycles, a series of PCRs with a different number of cycles was done. The assay was performed using the protocol described earlier. In this case, a total of 7 wells was used- 100bp ladder in the first and the samples, with the appropriate template, in all the others.
d Refer to chapter 4, section 4.8, for further reference on how this value was obtained.
30 Each sample was subjected to a different number of cycles- 2, 5, 8, 11, 13, 15. The results obtained revealed that 8 cycles was ideal. This was done to guarantee maximum amplification of the desired template and no amplification of non-specific genetic material, which is crucial to guarantee that the oligonucleotide sequences remain unaltered.
Figure 17 - PCR series with varying number of cycles. Six reactions with varying number of cycles were done- 2,
5, 8, 11, 13 and 15- in all 6 wells (W1 through W6, respectively). All wells contained the same original template, varying only in amount of amplified product, due to the different number of PCR cycles. Only the last 4 wells showed signs of amplification. The far left well contains the 100bp ladder.
After establishing an adequate number of cycles, a new PCR was madeg (using that number of cycles) with enough template for thirty reactions, yielding a total of 3ml. After this, the
aforementioned solution’s DNA was precipitated and underwent a strand separation procedureh. After that, the typical DNA extraction protocol was appliedi. Once the ssDNA had been extracted and appropriately diluted in water, the new selection round began.
2.1.2.2. Re-Analyzing the Target
First, the target was analyzed (as it had been previously) in the CE apparatus, with a 30cm capillary and, because its length was reduced in half, the same happened to the voltage used in the particle separation- a total of 9kV were used. Both the separation and sample buffers, however, remained the same
In these specific conditions, the target’s detection time was and bradykinin was detectable almost from the start (0min). In regard to the area variations, the proportion between these and
31 the concentration remained unaltered. The peaks’ shapes were considerably different, which can be attributed to the capillary’s length being reduced.
Figure 18 - Bk analysis or the second cycle in different concentrations. Three concentrations were used- 150, 200 and 300µM- in tris-HCl 10mM, MgCl2 4mM, NaCl 150mM, pH 7.4. Capillary: 30cm total length, 75um ID, 375um OD, 214nm wavelength. Separation buffer: borate 25mM, pH 9.3. The lack of resolution can be attributed to the short length of the capillary which, in itself, demanded a re-adjustment of the scale used during the data processing. The areas have been normalized- an average value was calculated using all value for each observable peak. Then, all values obtained were divided by the smallest one.
2.1.2.3. Analyzing the Selected Oligonucleotides
As before, after the analyzing the target, the ssDNA that resulted from the previous selection cycle was analyzed.
32
Figure 19 - Three different runs for three different concentrations. Three different concentrations of the
oligonucleotide sequences selected in the previous cycle were used- 100, 150 and 200nM- all in tris-HCl 10mM, MgCl2 4mM, NaCl 150mM, pH 7.4. Capillary: 30cm total length, 75µm ID, 375µm OD. Separation buffer: borate 25mM, pH 9.3.The areas have been normalized- an average value was calculated using all values for each observable peak. Then, all values obtained were divided by the smallest one.
2.1.2.4. Analyzing the New DNA-Target Complex
After that, the DNA was foldedj and incubated with the target. Three runs were made, with varying concentrations of target and ssDNA. In these conditions, the detection time of the aptamer-target complex was of approximately 10min and, as with the previous cycle, the peaks’ shapes were pretty similar to that of the ssDNA, as were the fluorescence levels (when considering the same concentrations of ssDNA and target).
33
Figure 20 - Fig. – Three different runs of the new aptamer-target complex. All samples in tris-HCl 10mM, MgCl2 4mM, NaCl 150mM, pH 7.4. Capillary: 30cm total length, 75µm ID, 375µm OD. Separation buffer: borate 25mM, pH 9.3). The values marked A1 through A5 represent the areas of each observable peak, from left to right. The areas, obtained with the equipment, have been normalized in order to analyze the linearity between the peaks and the concentration- an average value was calculated using all values for each observable peak.
2.1.2.5. Defining the New Collection Window
The new collection window was defined in a similar way to that of the first (as depicted in Figure 21), which means that it started in the same moment that the target shows up (0min, in this particular case) and stops right before the ssDNA starts to show up (7min).
Figure 21 - Schematic representation of the collection window used in the second selection cycle. Two
34 After this, the product obtained was submitted to a 15 cycle PCR reactionk. As was done in the previous cycle, in order to confirm that the collection window is adequate, a simple PAGEl assay was done. Figure 22 shows the results obtained: the first well, which contained all reagents necessary for amplification except for the template, reveals that there was no amplification of any kind (including primer self-replication); the second well, which contained the negative collection and had no amplification reveals that that collection contained no oligonucleotides whatsoever; the last two wells contained, respectively, a positive control and the positive collection, both showing signs of amplification, thus indicating that the procedure was a success.
Figure 22- Standard PAGE assay for evaluating the success of the collection process. From left to right: blank, negative collection, positive collection, positive control. The first well indicates that there was no amplification of non-specified template. The second one indicates that the collection window is adequate and that no free ssDNA is being collected (which is why the well is empty). The third well contains the collected aptamers and the fourth contains a positive control.
As before, another series of PCRsm were performed, in order to evaluate the optimum number of cycles that allowed aptamer amplification with no unspecified product. 4 reactions were made, with 3, 5, 8 and 11 cycles. When performing a simple PAGE assayn, we verified that 8 cycles was the optimum number.
35
Figure 23 – PCR series with varying number of cycles. Series of PCR assays using different number of cyckes- 3,
5, 8 and 11- in all 4 wells. All wells contained the same original template, varying only in amount of amplified product, due to the different number of PCR cycles to which they were submitted. The far-left well contains the 100bp ladder.
After this, a considerable amount of this product was subjected to this very same number of cycles, in the exact same conditions. The material obtained was then used in parts 2.2 and 2.3 of this project. The Kdo obtained in this cycle was 54µMp.
2.2. Aptamer Sequencing and Structure Analysis
100 colonies were used to sequence the aptamersq, yielding 80 valid sequences. After manual selection, in which a great deal of sequences were discarded due to lack of similarities between them and/or gaps, the selected ones were grouped, considering their repetitive motifs. This analysis was done using the MEME-suite software (developed and maintained by the University of Queensland, the University of Washington and the National Center for Research Resources, among a few others).
A total of 6 motifs were found, present in 16 sequences. Each motif was assigned to a group, which may contain anywhere from 2 to 4 sequences. Sequences 1.2 and 1.3 both have 2 motifs and sequence 2.1 has 3 motifs. Table 1 depicts these results.
o Refer to Figure 7- chapter 1, section 1.5- for further reference on both positive and negative controls regarding this technique.
36
Table 1 – Selected sequences grouped according to the repetitive motifs. Conserved regions within individual
classes of aptamers are underlined. All sequences start and end with the primers GGGAGACAAGAATAAGCG and AGGAGGCTCACAACAGG, respectively. The sequences in bold are present in more than one group (e.g. 3.1 is the same as 1.2, 3.4 is the same as 1.3, 5.1 is the same as 4.2 and 2.1). Each motif defines a specific group. Sequences are numbered considering the group they correspond to and the order by which they were depicted.
Group Number
and Motif
Sequences Sequence
Number
1 TTGAGCCCGGG
5’ GCACGCGCCCGCACCACGCCTTTGAGCCCGGGGA 3’ 5’ GCACGCGACGGTCCGCACGCGCTTGAGCCCGGGA 3’
5’ GCACAGGACGGGCCGCACCGCTTGAGCCCGGGGA 3’
1.1
1.2
1.3
2 AAAGGGA
5’ CCACCACGAGGTGCTACCTTAGCGGCAAAGGGAA 3’
5’ CCACCACGAGGTGTACTAGCGGCAAAGGGAAAGG 3’
5’ ACAATTGTGTGACGAGGTAGCAAAGGGAATCTGA 3’
2.1 2.2 2.3
3 ACGGGCCGGA
5’ GCACGCGACGGGCCGGACGCGCTTGAGCCCGAGA 3’
5’ GGCGGACGGGCCGGACGTGACGTGAGCGCGCGAA 3’ 5’ GGGCAGCGAGCAAGAACGGGCCGGACATCGCTGC 3’
5’ GCACAGGACGGGCCGGACCGCTTGAGCCCGGGGA 3’
3.1 3.2 3.3 3.4 4 TGCTACCTT
5’ GCTTTAAGACGATGCTACCTTGATTTGCTTTATC 3’ 5’ CCACCACGAGGTGCTACCTTAGCGGCAAAGGGAA 3’
4.1
4.2
5 ACCACGAGG
5’ CCACCACGAGGTGCTACCTTAGCGGCAAAGGGAA 3’ 5’ CCACCACGAGGTGTACTAGCGGCAAAGGGAAAGG 3’
5.1
5.2
6 ACTGCT
5’ CCAGCAGACGGTACTGCTCGCACTGGACGTGCAC 3’
5’ GTGCGTCCCGTACTGCTAGGCCTAAGCGTGTGCG 3’
6.1 6.2
These sequences were, then, analyzed using the Mfold software (designed by the RNA Institute, College of Arts and Sciences, State University of New York, Albany), thus providing a prediction of the structural arrangement of the aptamers. This step provided information