José Pedro Malanho da Silva
Degree in Biochemistry
Expression and purification of proteins involved in the
mitochondrial electron transport chain
Biophysical characterization of a novel membrane
mimicking system
Dissertation to obtain the Master degree in Biochemistry for Health
Supervisor: Dra. Manuela M. Pereira
Co-Supervisor: Dr. Afonso Duarte
Jury:
President: Doutor Pedro Matias Opponent: Doutor Pedro Lamosa Members of the jury: Doutora Margarida Archer
Instituto de Tecnologia Química e Biológica, António Xavier
iii Expression and purification of proteins involved in the mitochondrial electron transport chain; Biophysical characterization of a novel membrane mimicking system
Copyright © José Pedro Malanho da Silva, Instituto de Tecnologia Química e Biológica, Universidade Nova de Lisboa.
v Agradecimentos
Agradeço a todas as pessoas envolvidas na realização do trabalho experimental e da escrita desta tese.
Agradeço em particular aos meus orientadores Dra. Manuela Pereira e Dr. Afonso Duarte por me terem acolhido no laboratório, pelas trocas de ideias, motivação e apoio durante a elaboração desta tese.
Agradeço também ao apoio incondicional dos meus pais, mana, namorada e família na concretização desta tese. Desde já peço desculpa pela minha ausência à família e namorada.
vii Abstract
NADH: ubiquinone oxidoredutase is one of the most intricate enzymes. It is part of the respiratory chains and is present in several organisms. This enzyme couples the transfer of two electron, from NADH to ubiquinone, and translocate ions across the membrane establishing a transmembrane difference of electrochemical potential. In this work, we present the initial experimental steps to express and purify a subunit from this intricate enzyme, which is directly related with the translocation of ions (i.e. NuoL). The objective was to characterize the subunit reconstituted in membrane-mimicking nanoparticles called nanodiscs using solution Nuclear Magnetic Resonance spectroscopy.
Nanodiscs are discoidal nanoparticles composed of lipids delimited by an amphipathic helical protein that stabilizes the lipidic hydrophobic chains.
In this work, we characterize nanodiscs composed by two types of lipids: POPC and E. coli lipids. The
obtained Nanodiscs were studied at different temperatures using several techniques to determine the stability of Nanodiscs at high temperatures.
It was observed that with the increase of temperature, the amphipathic protein lose its secondary structure while the Nanodiscs increases in diameter. However, cooling the Nanodiscs to room temperature restores the membrane environment, as shown by 31P-NMR spectroscopy. In this work, we show that the Nanodiscs are a suitable membrane platform, which can be used to characterize reconstituted protein in a wide range of temperatures.
Key words: NADH: ubiquinone oxidoredutase; Nanodiscs; circular dichroism; dynamic light
ix Resumo
NADH: ubiquinona oxidorredutase é umas das enzimas mais complexas da cadeia respiratória e está presente em vários organismos. Esta enzima acopla a transferência de dois eletrões, do NADH para a ubiquinona, e transloca protões através da membrana estabelecendo uma diferença de potencial eletroquímico transmembranar. Neste trabalho, são apresentados os passos experimentais iniciais para expressar e purificar uma subunidade desta enzima, que está diretamente relacionada com a translocação de iões (i.e. NuoL). O objetivo seria caraterizar a subunidade reconstituída num ambiente que mimetiza as membranas, i.e. nanodiscos, utilizando a espectroscopia de Ressonância Magnética Nuclear em solução.
Os nanodiscos são nanopartículas discoides compostas por lípidos e delimitadas por hélices anfipáticas que estabilizam as cadeias hidrofóbicas dos lípidos.
Neste trabalho foram caracterizados nanodiscos compostos por dois tipos de lípidos: POPC e lípidos de
E. coli. O nanodiscos obtidos foram estudados a diferentes temperaturas usando diversas técnicas para
determinar a estabilidade dos nanodiscos a altas temperaturas.
Foi observado que com o aumento de temperatura que a proteína anfipática perde a sua estrutura secundária, enquanto os Nanodiscos aumentam de tamanho. No entanto, após o arrefecimento para a temperatura ambiente os Nanodiscos recuperam o seu ambiente membranar, como é mostrado por espectroscopia de 31P-RMN. Neste trabalho mostramos que os Nanodiscos são uma plataforma membrana capaz de ser usada para caracterizar proteínas reconstituídas numa ampla gama de temperaturas.
Palavras-chave: NADH: ubiquinona oxedorredutase; Nanodiscos; Espetroscopia de Ressonância
xi Contents
I. Figure Index ... xiii
II.Table Index ... xv
III. List of abbreviations ... xvii
1 Aims and motivations ... 1
1.1 Introduction ... 1
1.2 NADH: quinone oxidoreductase ... 2
1.2.1 NADH: ubiquinone oxidoreductase - NuoL Subunit ... 4
1.2.2 Diseases in humans ... 7
1.2.3 Nanodiscs ... 7
2 Material and Methods ... 12
2.1 NuoL antiporter like subunit: expression and purification ... 12
2.1.1 Competent cells ... 12
2.1.2 Transformation and expression of NuoL constructs ... 12
2.1.3 Purification of NuoL antiporter domains ... 13
2.1.3.1 Protein purification by affinity chromatography ... 14
2.1.3.2 Protein purification by hydroxyapatite column ... 14
2.1.3.3 Western Blot ... 15
2.2 Nanodiscs: Assembly process ... 15
2.2.1 Expression of MSP1E1 ... 15
2.2.2 Purification of MSP1E1 by affinity chromatography... 16
2.2.3 Nanodiscs setup ... 16
2.2.4 Nanodiscs’ purification protocol ... 17
2.3 Biophysical characterization of Nanodiscs ... 17
2.3.1 Fluorescence spectroscopy ... 17
2.3.2 Circular Dichroism ... 18
2.3.3 Dynamic Light Scattering ... 18
2.3.4 UV-Visible spectroscopy ... 18
2.3.5 Stokes’ radius and molecular mass determination ... 19
2.3.6 NMR spectroscopy experiments ... 19
3 Results and discussion ... 20
3.1 NuoL expression and purification ... 20
3.2 Characterization of Nanodiscs ... 25
3.2.1 Expression and purification of MSP1E1 ... 25
3.2.2 Purification of Nanodiscs ... 27
3.3 Biophysical characterization of Nanodiscs ... 28
xii
3.3.2 Fluorescence spectroscopy ... 30
3.3.3 Circular dichroism ... 33
3.3.4 Dynamic Light Scattering ... 35
3.3.5 UV-Visible spectroscopy ... 36
3.3.6 Nuclear Magnetic Resonance spectroscopy ... 37
3.3.6.1 NMR of MSP1E1 ... 37
3.3.6.2 1H-13C HSQC NMR experiments of NDs... 39
3.3.6.3 31P NMR spectroscopy of Nanodiscs ... 43
4 Conclusions ... 49
5 References ... iii
xiii
I. Figure Index
Figure 1.1:Schematic representation of the electron transport chain from E. coli. 2
Figure 1.2: Cartoon representing bacterial Complex I. 4
Figure 1.3: NuoL subunit from NADH: ubiquinone oxidoreductase. 5
Figure 1.4: Representation of TM1-15 of NuoL of Complex I and topology diagram of NuoL. 5
Figure 1.5: NuoL’s putative ion channels. 6
Figure 1.6: Representation of NDs from different perspectives. 8
Figure 1.7: Structure representation of lipids. 9
Figure 1.8: Structure of lipids E. coli Total extract. 10
Figure 2.1: Schematic representation of IMAC chromatography elution gradient with buffer B. 14 Figure 2.2: Schematic representation of HTP chromatography elution gradient with buffer D. 14 Figure 2.3: Schematic representation of IMAC chromatography elution gradient with buffer F. 16 Figure 3.1: Fluorescence spectra of aliquots retrieved during cell culture growth. 20
Figure 3.2: IMAC’s chromatogram of solubilized membranes. 21
Figure 3.3: SDS-PAG and WB of the obtained IMAC’s fractions. 22
Figure 3.4: HTP chromatogram of fractions III and IV of IMAC’s chromatogram. 23
Figure 3.5: SDS-PAG and WB of obtained HTP’s fractions. 23
Figure 3.6: Example of a growth curve of E. coli BL21-DE3 (GOLD) expressing MSP1E1 and SDS-PAG of
aliquots collected during E. coli cell growth 25
Figure 3.7: IMAC’s chromatogram of MSP1E1 26
Figure 3.8: SDS-PAG of the different fractions from the IMAC chromatography. 26
Figure 3.9: S-200 SEC’s chromatogram and SDS-PAG of ND_P. 27
Figure 3.10: S-200 SEC’s chromatogram and SDS-PAG of ND_E. 27
Figure 3.11: Normalized elution profiles of ND_P and ND_E in a 24 mL S-200 SEC column. 28 Figure 3.12: Calibration curves for the determination of Stokes’ radius and molecular mass of the NDs. 29 Figure 3.13: Normalized elution profile of the different proteins used for the determination of molecular mass
and Stokes’ radius of NDs. 29
Figure 3.14: Fluorescence emission spectra of ND_P at different temperatures. 30 Figure 3.15: Fluorescence emission spectra of ND_E at different temperatures. 30 Figure 3.16: Fluorescence emission spectra of isolated MSP1E1 at different temperatures. 31 Figure 3.17: Normalized fluorescence intensity at 340 nm for the different NDs and for MSP1E1 in solution
as a function of temperature. 31
Figure 3.18: Circular dichroism spectra of ND_P at different temperatures. 32 Figure 3.19: Circular dichroism spectra of ND_E at different temperatures. 33 Figure 3.20: Circular dichroism spectra of MSP1E1 at different temperatures. 33 Figure 3.21: Circular dichroism ellipticity at 222 nm for the different NDs and for MSP1E1 in solution as a
function of temperature. 34
Figure 3.22: Diameter of the different NDs as a function of temperature obtained by dynamic light scattering. 35 Figure 3.23: UV-Visible absorbance values at 280 nm for MSP1E1 and the different types of NDs plotted as
xiv Figure 3.24: 1H NMR spectrum of MSP1E1 at 15 °C. The inset shows the region from 6 to 9 ppm. 37
Figure 3.25: 1H-13C HSQC NMR spectrum of MSP1E1 and 1H –15N HSQC spectrum of 15N labeled MSP1E1.
38
Figure 3.26: 1H-13C HSQC spectrum of ND_P at 15 °C. 39
Figure 3.27: Schematic representation of POPC lipid. 39
Figure 3.28: 1H-13C HSQC spectrum of ND_E at 15 °C. 41
Figure 3.29: 31P NMR spectra of ND_P obtained at different temperatures. 43
Figure 3.30: Representation of normalized linewidth and normalized integral of POPC’s resonance as a
function of temperature. 44
Figure 3.31: 31P NMR spectra of ND_P obtained at different temperatures (stability test). 45
Figure 3.32: 31P NMR spectrum of ND_E obtained at 15 °C. 45
Figure 3.33: 31P NMR spectra of ND_E obtained at different temperatures. 46
Figure 3.34: 31P NMR spectra of ND_E obtained at different temperatures (different representation). 47
Figure 3.35: 31P NMR spectra of ND_E obtained (stability test). 47
Figure 4.1: Schematic representation of Nanodiscs’ behavior with changes of temperature. 50 Figure 6.1: 1H-13C HSQC prediction spectrum of PG. (From http://www.nmrdb.org/). 58
Figure 6.2: 1H-13C HSQC prediction spectrum of PE. (From http://www.nmrdb.org/). 58
xv
II.Table Index
Table 1-1: Comparison of Complex I core subunits from E. coli and Bos Taurus. ... 3
Table 1-2: Advantages and disadvantages of different membrane mimicking environments. ... 8
Table 1-3: Size of Nanodiscs composed by different MSP, independent from lipid composition. ... 10
Table 1-4: Lipid to MSP stoichiometry of different lipids and MSP (mol/mol), per each leaflet. ... 10
Table 1-5: E. coli Total extract phospholipid profile from Avanti. ... 10
Table 3-1: Optical density measurements at 600 nm at different time points during a period of 24 h, after inoculation... 20
Table 3-2: 1H and 13C chemical shifts of ND_P at 15 °C. Peak assignment of ND_P was based on published assignment for POPC51 NDs and in 1H-13C HSQC MSP1E1 NMR spectra. ... 40
Table 3-3: 1H and 13C chemical shifts of ND_E at 15 °C. Peak assignment of ND_E was based on published assignment for POPC51 and in 1H-13C HSQC MSP1E1 spectra. ... 42
Table 4-1: Physical characteristics of POPC and E. coli lipid Nanodiscs determined by size exclusion chromatography. ... 49
xvii
III. List of abbreviations
ATP - Adenosine triphosphate CA - Cardiolipin
CD – Circular Dichroism CV - Column Volume
DLS – Dynamic Light Scattering
DMPC - 1,2-dimyristoyl-sn-glycero-3-phosphocholine DPPC - dipalmitoylphosphatidylcholine
Fe-S - Iron-sulfur centers FID - Free Induction Decay FMN - Flavin mononucleotide GFP – Green Fluorescence Protein HL – Long Helix
HSQC - Heteronuclear Single Quantum Coherence Spectroscopy HTP - Hydroxyapatite
IMAC - Immobilized Metal Affinity Chromatography MSP – Membrane scaffold protein
MRP - Multiple resistance to pH NMR – Nuclear Magnetic Resonance NAD - Nicotinamide adenine dinucleotide ND – Nanodisc
ND_E –E. coli lipid nanodiscs
ND_P – POPC lipid nanodiscs Nqo - NADH quinone oxidoreductase Nuo - NADH ubiquinone oxidoreductase PE - L-α-phosphatidylethanolamine PG - L-α-phosphatidylglycerol
POPC - 1-palmitoyl-2-oleoyl-sn-glycero-3-phosphocholine Q - Quinone
QH2 - Quinol RF - Radiofrequency
SAXS – Small Angle X-ray Scattering TBS - Tris buffered saline
1 1Aims and motivations
In the framework of the course “Biochemistry for Health”, this thesis aimed at investigating ion
translocation by respiratory Complex I. This complex couples the NADH:quinone oxidoreduction to ion translocation, contributing in this way to the establishment of a transmembrane difference on the electrochemical potential. Its mechanism of action is not understood. Complex I is present in the respiratory chain, from the mitochondria, and is related to several diseases such as Parkinson, Alzheimer and cancer. Bacterial Complex I is a suitable model for the study of mitochondrial Complex I since it is
simpler and constituted by subunits composing the minimal functional “core” of eukaryotic Complex I.
Specifically, one of the objectives of this work was the identification of the ion transport pathways in membrane subunits of Complex I. We also aimed to study these subunits in a membrane environment suitable to solution NMR characterization. For this, Nanodiscs were the membrane-mimicking environment elected whose characterization constituted another goal of the project.
1.1 Introduction
Bioenergetics is a field of biochemistry and biology that explores the processes related to energy conversion1 and the intervening molecules, such as enzymes. Without energy, there is no life and nature developed enzymes capable of converting energy from different sources such as the sun or chemical compounds. The enzymes present in the respiratory chain are responsible for the conversion of energy from substrates to an electrochemical potential across the membrane.
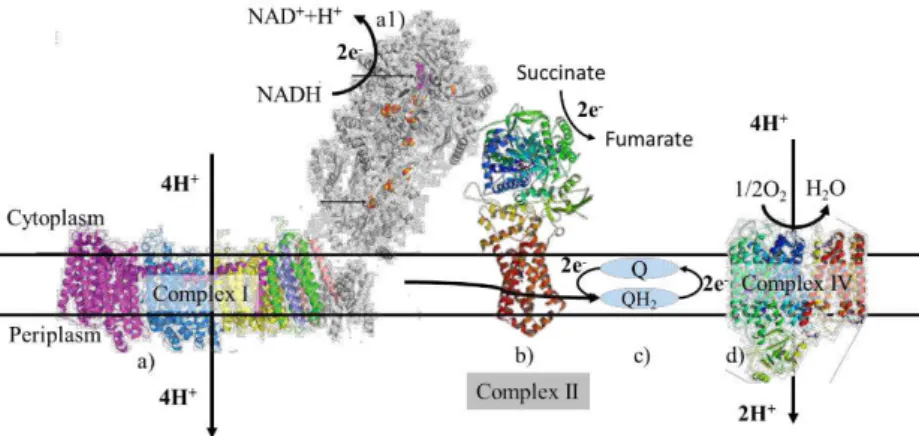
The respiratory chain is present in the membrane of mitochondria, in eukaryotic organisms, and in the cytoplasmatic membrane, in prokaryotes. Figure 1.1 shows a schematic representation of the aerobic respiratory chain from Escherichia coli. This respiratory chain includes the membrane complexes:
NADH: ubiquinone oxidoreductase;Succinate: quinone oxidoreductase and Ubiquinol oxidoreductase. This respiratory chain is fed with electrons from nicotinamide adenine dinucleotide (NADH) and succinate to NADH: ubiquinone oxidoreductase and to Succinate: quinone oxidoreductase, respectively. These two enzymes transfer the electrons from the respective substrates to ubiquinone reducing it to ubiquinol. Then ubiquinol diffuses through the membrane to Ubiquinol oxidoreductase, which oxidizes ubiquinol back to ubiquinone and reduces oxygen to water. The difference in reduction potentials between NADH and ubiquinone and ubiquinol and oxygen is high enough to allow the establishment of a transmembrane electrochemical potential, by translocating charges across the membrane.
2 Figure 1.1:Schematic representation of the electron transport chain from E. coli with the known structures (adapted from1). a) NADH: ubiquinone oxidoreductase (membrane domain from E. coli and hydrophilic domain from
Thermus Thermophilus 3); b) succinate: quinone oxidoreductase (PDBID:2WDV); c) Q (Quinone) and QH2 (Quinol); d) Ubiquinol oxidoreductase (PDBID: 1FFT).
1.2 NADH: quinone oxidoreductase
NADH: quinone oxidoreductase, from the respiratory chain, is a membrane protein that is present in both prokaryotes and eukaryotes. For eukaryotes, this enzyme is called Complex I, it is present in the mitochondria, and is more intricate than the prokaryotes due to the extra subunits.
Complex I has an L-shape and is composed by two domains: one hydrophilic and one hydrophobic. The bacterial Complex I has a total of 550kDa and the mammalian has 980kDa. The hydrophilic domain is responsible for electron transfer and the membrane domain is responsible for the ion translocation3–5. The mechanism that allows the energy transfer, from the redox reaction, from the hydrophilic domain to the hydrophobic domain in order to establish a transmembrane difference of electrochemical potential, it is not clear.
NADH: ubiquinone oxidoreductase in E. coli (E.C.1.6.5.3) is composed of 13 subunits (two fused)
where seven are hydrophilic and the other six are hydrophobic. These subunits, which are conserved in mitochondrial Complex I6,7,constitute the called “core” subunits from a total of 44-45 3,8, of eukaryotic Complex I. The remaining subunits are called supernumerary and the function of these subunits can be regulatory, stability and assisting in the assembly of Complex I9. Since the “core” subunits are considered the minimal functional unit then the catalytic and translocation mechanisms are similar in the prokaryotic and eukaryotic enzymes.
Table 1-1 shows the subunits from E. coli and the corresponding “core” subunits in the mitochondrial
3 Table 1-1: Comparison of Complex I core subunits from E. coli and Bos Taurus (adapted from 10)
E. coli Bovine Prosthetic group
Size 550kDa 980kDa Number of subunits 13 45
Hydrophilic domain
Subunits NuoF 51kDa FMN, N3
NuoE 24kDa N1a
NuoG 75kDa N1b, N4, N5 and some species N7 NuoDC 49kDa
NuoDC 30kDa
NuoB PSST N2
NuoI TYKY N6a, N6b
Hydrophobic Domain
NuoA ND3
NuoH ND1
NuoJ ND6
NuoK ND4L
NuoL ND5
NuoM ND4
NuoN ND2
The resolution of the crystallographic structure of Complex I was a major breakthrough to the field because it allowed the investigation of the catalytic and translocation mechanisms, including the putative ion channels. The published crystallographic structures, until now, are from E. coli (membrane
domain)3, Thermus Thermophilus6 (whole enzyme) and Yarrowia lipolytica11 (whole enzyme). A structure of Complex I from Bovine12, using cryo-electron microscopy, was also obtained.
In this work, we focus on the respiratory Complex I of Escherichia coli because the subunits of this
enzyme are conserved in the mitochondrial Complex I 6,7, making the NADH: ubiquinone oxidoreductase, from E. coli, a suitable model to characterize the translocation mechanism. The
4 NADH: ubiquinone oxidoreductase has: 8-10 iron-sulfur centers [Fe-S] (Figure 1.2 in orange and red), where at least two iron-sulfur centers are binuclear [2Fe-2S](+2/+1) and at least six iron-sulfur centers are tetranuclear [4Fe-4S](+2/+1)21. This enzyme also contains one flavin mononucleotide (FMN) (Figure 1.2 in purple), a NADH/NAD+ binding site, near FMN in the soluble part, and a quinone binding site in the interface of membrane and soluble domains.
Figure 1.2: Cartoon representing bacterial Complex I. This structure was assembled with membrane domain from E. coli and hydrophilic domain from Thermus Thermophilus. In the hydrophilic domain is represented in purple the FMN and in orange and red the Fe-S clusters. Q represents the quinone binding site and N2 the last Fe-S that transfers the electrons to the quinone. (adapted from 3)
The subunits of NADH: ubiquinone oxidoreductase from E. coli’s are called Nuo and range from
NuoA to NuoN22. The membrane domain is composed by the subunits L, M, N, A, J, K and H, making a total of 222kDa3, with 55 transmembrane helixes. Sequence and structural analyzes show that three subunits NuoL, M and N are homologous to each3. It also shows that they are homologous to subunits of multiple resistance to pH (Mrp) which are Na+/H+ antiporters6,23 suggesting that Complex I also may act as a Na+/H+ antiporter. In fact, a study that uses 23Na NMR spectroscopy proves that Complex I is an antiporter and translocates sodium.22
1.2.1
NADH: ubiquinone oxidoreductase - NuoL Subunit
NuoL subunit is a membrane protein that has composed of sixteen transmembrane (TM) helixes and a
5 Figure 1.3: NuoL subunit from NADH: ubiquinone oxidoreductase (PDBID 3RKO chain L), from the cytoplasmatic view, with numbered helixes, β-hairpin and HL. In dark grey it is represented the surface of NuoM (PDBID 3RKO chain M) and in light gray it is represented the surface of NuoN (PDBID 3RKO chain N).
TM1, 2 and 14 are in the opposite side of HL and are the least conserved TMs (Figure 1.3) (The degree of conservation was calculated with an alignment of 30 sequences of Complex I subunits from representative organisms from all kingdoms of life)24. The polipeptidic chain between TM2-3 forms a
β-hairpin at the periplasm surface and contributes to intersubunit interactions10. TMs 4-13 are the most conserved and form the core of subunit NuoL3. TM4-8 and TM9-13 have an internal symmetry and can be superimposed by performing a 180° rotation, along the membrane plane3. This kind of pattern in sequence and structure is what can be called structural repeats. With this and with the physical arrangement of TM4-8 and TM9-13 these are called inverted repeats.
Figure 1.4: a) Representation of TM1-15 of NuoL of Complex I, from cytoplasmatic side. Inside the circles in color green (TM4-8) and in red (TM9-13) are represented the inverted repeats, b) topology diagram NuoL showing the different repeats (triangles and helices in green and orange), kinks in TM7 and TM12 and conserved residues (TM5 (E144), TM7 (K299) and TM12 (K399)) and in blue are the least conserved TMs.
6 conserved proline residues, one in each TM helix. A kink and a polar residue in the middle of the membrane are energetically unfavorable meaning this structural feature is relevant in ion translocation. This structural characteristic is also present in other transporters. This type of discontinuity gives flexibility which is necessary for transport25.
The translocation pathway of the ions, in NADH: ubiquinone oxidoreductase, is still under debate. This is due to the lack of a clear pathway in the crystallographic structures. However, some residues involved in the ion transport were identified by mutations and activity assays26–28. Efremov and Sazanov3 propose a putative pathway (Figure 1.5) composed by two highly conserved half-channel. However, the crystallographic structure and by bioinformatics studies whose programs search cavities in proteins, show that these channels are not connected neither to the cytoplasm or periplasm24.
These half channels are composed of polar and charged residues3 (Figure 1.5 region I and II in green). The first half-channel comprising the residues H100; T120; S150 and K299 has a cavity with 70Å3. In this cavity, there is a conserved lysine residue present TM7 (K299) and a glutamate residue in TM5 (E144), which electrostatically interacts with each other. This half-channel connects with the cytoplasm3. Mutations in those two residues led to a loss of dNADH oxidase activity and proton translocation 27,28, and also decreases the amount of assembled complex27. In Figure 1.5, it is also schematized an alternative channel in black (R115; E144; Y151; R155; T174; D178 and Y199), which is between subunits L and M24. The second half-channel is composed by polar and charged residues (T257; S311; Q315; T318; H334; H338; K342; K399; D400; T425; Y428; T429; E494 and S497) and has a cavity with 20nm. In this cavity, there is a conserved lysine in TM12 (K399), which is in a position symmetrically similar to K299. This half channel connects with the periplasm3. Mutations in K399 also lead to a decrease of assembled complex and dNADH oxidase activity27. The connection between these two half channels is established through polar and charged residues (H254; A255 and T312), with the exception of A255, which is apolar3.
7 Another structural element of NuoL subunit is the long amphipathic helix HL that is 110 Å long. HL has polar residues that interact with the cytoplasm and apolar residues which interact with the membrane and with the subunits NuoM and N (via backbone and side chains)3. This is an indication that helix HL rests at the surface membrane. This amphipathic helix starts at the end of TM15, from NuoL, and ends at the beginning of TM16, which is anchored to NuoN, J and K. HL stabilizes the complex and interacts with conserved residues (Lys173, Asp246 and Tyr317) and a semi-conserved (His241) (66% conservation) of NuoM (conservation is in relation with these three subunits)3. Since this structural element connects with NuoM and NuoN it was suggested that helix HL could be a coupling element between the released energy from the redox reaction and the translocation of ions across the membrane9.
1.2.2
Diseases in humans
In humans, several diseases have been associated with Complex I.
Complex I related diseases can have different origins caused either by mutations29–31 or by the disassembly of Complex I30. Mutations can occur in the mitochondrial DNA or in the nuclear DNA, in supernumerary or core subunits29 and in conserved or non-conserved residues8. In addition, these mutations can lead to a deficiency of Complex I where its activity is impaired29–31. Other mutations are not present in genes coding for Complex I but in genes coding assembly factors, which lead to an improper assembly32.
Diseases related to Complex I are: Leber's hereditary optic neuropathy (LHON); Leigh syndrome;
leukodystrophy; Parkinson’s disease; Alzheimer’s disease; Mitochondrial encephalomyopathy, lactic acidosis, and stroke-like episodes (MELAS); cardiomyopathy and even cause development delay29,31,33. Complex I31,34 and Complex III31 are responsible for the production of reactive oxygen species (ROS). These reactive species can damage lipids, proteins, DNA, leading to diseases, such as lactic acidosis and cardiomyopathy31.
1.2.3
Nanodiscs
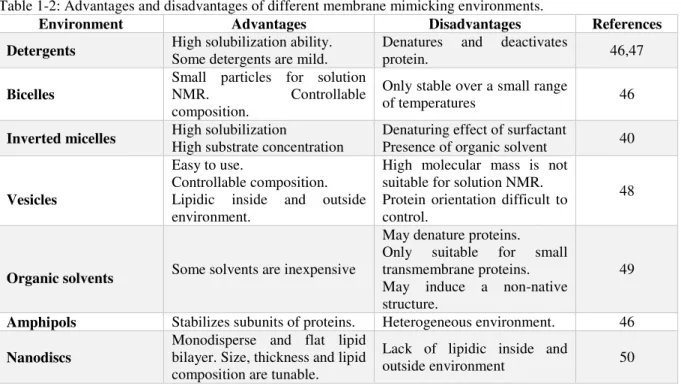
8 Table 1-2: Advantages and disadvantages of different membrane mimicking environments.
Environment Advantages Disadvantages References
Detergents High solubilization ability. Some detergents are mild. Denatures and deactivates protein. 46,47
Bicelles
Small particles for solution
NMR. Controllable
composition.
Only stable over a small range
of temperatures 46
Inverted micelles High solubilization High substrate concentration Denaturing effect of surfactant Presence of organic solvent 40
Vesicles
Easy to use.
Controllable composition. Lipidic inside and outside environment.
High molecular mass is not suitable for solution NMR. Protein orientation difficult to control.
48
Organic solvents Some solvents are inexpensive
May denature proteins. Only suitable for small transmembrane proteins. May induce a non-native structure.
49
Amphipols Stabilizes subunits of proteins. Heterogeneous environment. 46 Nanodiscs
Monodisperse and flat lipid bilayer. Size, thickness and lipid composition are tunable.
Lack of lipidic inside and
outside environment 50
We address protein reconstitution in the membrane by using the Nanodisc technology, because it allows a characterization of the reconstituted protein in a free detergent environment using solution Nuclear Magnetic Resonance spectroscopy. Nanodiscs are easy to implement, easy to manipulate and provide a native like environment, without detergents. This lipidic nanoparticle allows a biophysical characterization of the reconstituted protein by several methodologies such as circular dichroism and fluorescence spectroscopy besides Nuclear Magnetic Resonance spectroscopy51,52. Furthermore, the size of Nanodiscs, lipid and number of lipid composition is controllable. Table 1-2 shows that the Nanodiscs have a disadvantage, however it depends on type of the planned experiment. For this work, there is not a need for a compartmentalization, because the objective is to identify the transport pathway.
Nanodiscs (ND) are discoidal nanoparticles composed of an assembled bilayer of phospholipids and by amphipathic helical proteins termed membrane scaffold proteins (MSP)43 (Figure 1.6) . Nanodiscs are formed by a process of self-assembly, which relies on the correct stoichiometry between phospholipids and MSP50 to ensure a monodisperse solution of Nanodiscs with the expected size43.
9 MSPs are engineered proteins containing approximately 200 amino acid residues from the C-terminal of the human apolipoprotein A1, which is present in high-density lipoproteins. MSPs are composed of
several amphipathic helixes, which interact with the lipids’ aliphatic chain and with the buffer. The
number of amphipathic helixes determines the different ND sizes. A longer MSP originates a larger ND. Similarly, the size of the NDs decreases if the MSP is shorter. The section of the MSP that is truncated is fundamental for this changing, for example the first 20 amino acids in N-Terminal have no role in the self-assembly of NDs, so if we remove them, it does not affect the size of the ND44. The MSP1E refers to an extension (E) of the MSP1 by inserting a repeat of a helix and MSP1D it is a deletion (D) in the MSP144.
There are several examples of different lipids used to produce a variety of NDs. For example dipalmitoylphosphatidylcholine (DPPC), 1-palmitoyl-2-oleoyl-sn-glycero-3-phosphocholine (POPC)44 and1,2-dimyristoyl-sn-glycero-3-phosphocholine (DMPC) (Figure 1.7) can be found in literature.
Figure 1.7: Structure representation of the most used lipids in NDs. a) 1-palmitoyl-2-oleoyl-sn-glycero-3-phosphocholine (POPC); b) dipalmitoylphosphatidylcholine (DPPC) and c) 1,2-dimyristoyl-sn-glycero-3-phosphocholine (DMPC).
The process of self-assembly of the NDs requires lipids and MSP in solution, in a defined stoichiometry. The process is initialized by detergent removal, using dialysis or porous polystyrene beads.
The lipids determine the thickness and the MSP determines the size of NDs. Table 1-3 shows the different sizes of NDs composed of different MSP, measured by small angle X-ray scattering (SAXS) and by the retention time in a size exclusion chromatography (Stokes’ diameter). The Stokes’ diameter
is obtained by analyzing the elution profile of a sample and comparing the elution volume with those of
standard proteins with a known Stokes’ diameter.
10 Table 1-3: Size of Nanodiscs composed by different MSP, independent from lipid composition. (* Literature did not allow an estimation of the standard deviation)
MSP1 MSP1E1 MSP1E2 MSP1E3 References
Stokes’ diameter (nm) 9.38±0.56 10.3±0.31 11.03±0.36 12.07±0.08 44,55 SAXS (radius) (nm) 4.3±0.50 4.60±0.40 5.15±0.35 5.45±0.53 44,55,56 SAXS (diameter) (nm) 9.75±0.05 10.6* 11.9* 12.9* 44
Table 1-4: Lipid to MSP stoichiometry of different lipids and MSP (mol/mol), per each leaflet. MSP1 MSP1E1 MSP1E2 MSP1E3 Incubation
temperature
References
POPC 62±9 79±7 103±7 126±17 4°C 44
DPPC 84±7 106±1.5 134±3.3 167.8±8.7 37°C 44 DMPC 77±2 102.5±10 122±3 147.5±2 25°C 44,56 The study of heterogeneous composition of lipids in nanodiscs57 is also described, as for more complex Nanodiscs that are composed by E. coli lipids58-59. According to Avanti, these are: L-α
-phosphatidylethanolamine (PE); L-α-phosphatidylglycerol (PG); cardiolipin (CA) and some unknown lipids (see Table 1-5 for Avanti’s E. coli lipid composition and Figure 1.8 for molecular structure of
Avanti’s E. coli lipids).
Table 1-5: E. coli Total extract phospholipid profile from Avanti.
E. coli Total extract phospholipid profile
Component wt/wt (%)
PE 54.5
PG 15.1
CA 9.8
Unknown 17.6
Total 100
12
2
Material and Methods
2.1 NuoL antiporter like subunit: expression and purification
2.1.1
Competent cells
E. coli C43 (DE3) (Lucigen Inc. USA) cells were inoculated in Lucia Broth (LB) medium and incubated
overnight (37 °C, 150 rpm). One percent of the overnight growth was inoculated in Super Optimal Broth (SOB)69 medium, supplemented with Mg2+, and incubated at 37 °C, 150 rpm. When growth reached a cell density corresponding to OD600nm of 0.6, the cell culture growth was stopped by placing it on ice for at least 10 min. Cells were harvested by centrifugation (2100 g, 10 min, 4 °C). Supernatant was discarded and cells were resuspended in 8 mL buffer (10 mM HEPES, 15 mM CaCl2, 250 mM KCl, 55 mM MnCl2 pH 6.7), incubated for 10 min on ice and centrifuged at 2100 g, 10 min, 4 °C. Supernatant was discarded and cells were resuspended in 2 mL buffer (10 mM HEPES, 15 mM CaCl2, 250 mM KCl, 55 mM MnCl2 pH 6.7). DMSO (from a 100 % stock) was added to the cells to a final concentration of 7 % and these cells were incubated on ice for 10 min. Cell aliquots of 100 µL were flash frozen with liquid nitrogen and stored at -80 °C.
2.1.2
Transformation and expression of NuoL constructs
The expression of the recombinant protein was achieved using E. coli C43 (DE3) cells in combination
13 in a 50 mM Tris-HCl, 300mM NaCl, pH 8 buffer supplemented with protein inhibitors (Roche Inc., USA) and stored at -20 °C.
To assess protein expression during cell growth, culture aliquots were collected from the inoculation point to the end of the culture growth. Cell disruption was achieved via freezing and thawing and disrupted cells were analyzed by fluorescence spectroscopy to detect the presence of Green Fluorescent Protein (GFP) by exciting the sample at 410 nm and measuring the emission spectra from 450 nm to 600 nm. GFP presents an emission maximum at 515 nm.
2.1.3
Purification of NuoL antiporter domains
E. coli C43 (DE3) cells previously harvested and stored at -20 °C were disrupted using a French press
(10000 psi) apparatus or an APV-1000 (8000 psi) equipment. Disrupted cells were centrifuged (12000 rpm, 10 min, 4 °C) and the supernatant was ultracentrifuged (42000 rpm, 2 h, 4 °C), to separate the soluble fraction from the membranes. The supernatant was discarded and membranes were resuspended, using a Potter-Elvehjem homogenizer, in 50 mM Tris-HCl, 2 M NaCl pH 8. High ionic strength allows removing of proteins that interact weakly with the membrane. The membrane fraction was ultracentrifuged (42000 rpm, 2 h, 4 °C), the supernatant was discarded and the membranes were washed with 50 mM Tris-HCl pH 8 buffer to decrease the ionic strength to 500 mM NaCl.
14
2.1.3.1 Protein purification by affinity chromatography
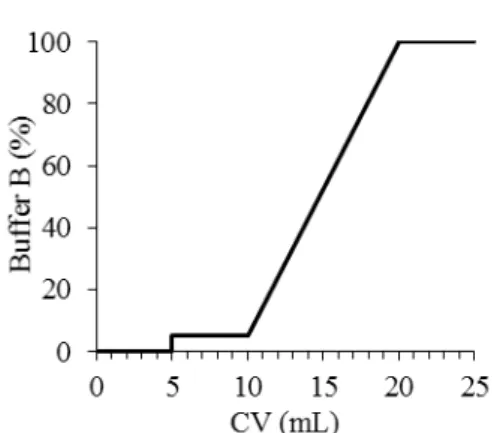
Immobilized Metal Affinity Chromatography (IMAC) column with a total volume of 26 mL and connected to an AKTA Purifier (GE Healthcare) was used to purify the NuoL repeat. The column was activated with NiSO4, followed by equilibration with buffer A (50 mM Tris-HCl, 500 mM NaCl, 0.05 % DDM pH 8).
The sample containing the solubilized membranes with NuoL repeat was injected in the column and it was eluted using a gradient of buffer B (buffer A with 500 mM imidazole) as described in Figure 2.1. Initially the column was washed with buffer A until absorbance at 280 nm stabilized, this allowed
an initial removal of proteins that do not interact with the resin. A 5 % buffer B step was performed for 5 CV to elute proteins that interact weakly with the resin. The next step in elution was performed from 5 % to 100 % buffer B for 10 CV. Finally, the column was washed for 5 CV with 100 % of buffer B. During the elution, a flow rate of 3 mL/min and a maximum pressure of 0.4 MPa were used.
The collected fractions were analyzed by: a) Fluorescence spectroscopy (to assess GFP content using Varian Cary Eclipse Fluorescence Spectrophotometer); b) UV-Visible spectroscopy (to assess cytochrome contamination and GFP presence using Shimadzu UV-1700), c) SDS-PAGE (to assess number of contaminants) and d) Western Blot (WB) (to confirm the presence of GFP and/or His-tag). Fractions with same spectral UV-Visible profile were combined, concentrated and stored at 4 °C for further purification.
2.1.3.2 Protein purification by hydroxyapatite column
Hydroxyapatite (HTP) column with a total volume of 22 mL and connected to an AKTA Purifier 10 (GE Healthcare) was equilibrated with buffer C (20 mM potassium phosphate, 0.05 % DDM, pH 7.6) was used to purify the NuoL construct. The fractions obtained in the IMAC chromatography were buffer exchanged to 20 mM potassium phosphate, 0.05 % DDM, pH 7.6, as the gradient in the HTP column was performed with phosphate buffer to 1 M of potassium phosphate. The elution gradient used in the HTP as described in Figure 2.2.
After sample injection, the column was washed with 5 CV of
buffer C to elute the proteins that do not interact with the resin. Following this step, a phosphate gradient was performed for 10 CV from 0 % to 100 % with buffer D (1 M potassium phosphate, 0.05 % DDM, Figure 2.1: Schematic representation of IMAC chromatography elution gradient with buffer B (50 mM Tris-HCl, 500 mM NaCl, 500 mM Imidazole, 0.05 % DDM pH 8 at 4 °C).
15 pH 7.6). Finally, the column was washed with 5 CV of 100 % Buffer D. The elution steps were performed with a flow rate of 3 mL/min with a maximum pressure of 5 MPa. Collected fractions were analyzed by: a) Fluorescence spectroscopy, b) UV-Visible spectroscopy, c) SDS-PAGE and d) Western Blot.
2.1.3.3 Western Blot
An initial SDS-PAGE containing the samples under the study and the molecular mass markers (NZIColourProtein Marker II) was performed at 180 V, 400 mA and 100 W for 1 h. SDS-PAG was soaked in transfer buffer (100 mM Tris-HCl, 100 mM NaCl, 5 mM MgCl2 pH 9.5) and placed in a Western Blot (WB) device (Transfer Blot SD Semi dry transfer blot (Bio-Rad)) with filter paper and with a nitrocellulose membrane. Proteins were transferred to the nitrocellulose membrane for 30 min at 15 V.
After protein transfer, the nitrocellulose membrane was soaked with 5 % (m/V) skim milk, in Tris Buffered Saline (TBS) (20 mM Tris-HCl, 100 mM NaCl, pH 7.6) for 30 min. Proteins in the nitrocellulose membrane were incubated with primary antibody against GFP (rabbit) with a dilution of 1:10000 in 5 % skim milk in TBS. The nitrocellulose membrane was washed three times with Tween20 in TBS for 10 min to remove the excess of primary antibody. The membrane was incubated with secondary antibody against rabbit (goat) with a dilution of 1:7500 in TBS and 5 % skim milk. In order to remove the excess of secondary antibody, a second washing procedure was performed. The detection of the GFP was achieved by adding a solution of BCPiP+NBT (Roche) to the nitrocellulose membrane, which was incubated for 15 min. The reaction was stopped with bidistilled water and by discarding the detection solution.
2.2 Nanodiscs: Assembly process
2.2.1
Expression of MSP1E1
For the expression of MSP1E1, E. coli (BL21-DE3 (GOLD)) cells stored at -80 °C and containing the
plasmid pET 28a plasmid (supplied by Novagen) with the coding sequence of MSP1E1, were used. The cells stock was inoculated in 50 mL LB medium, supplemented with kanamycin (50 µg/mL), and incubated overnight at 37 °C, 180 rpm.
16 When needed,cells were disrupted using either a French Press (10000 psi) apparatus or an APV-1000 (8000 psi) equipment. Intact cells were separated from centrifugation (8000 rpm, 10 min, 4 °C) and the supernatant, containing the lysed cells, was ultracentrifuged (42000 rpm, 2 h, 4 °C) in order to separate soluble fraction from membranes. Membranes were discarded and the supernatant was stored at 4 °C, for further procedures.
Expression of labelled 15N-MSP1E1 followed the same protocol except that instead of LB medium M9 minimal69 (15NH
4Cl) medium was used.
2.2.2
Purification of MSP1E1 by affinity chromatography
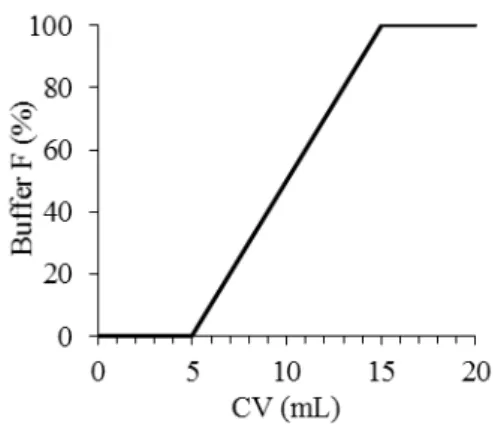
IMAC column with a total volume of 26 mL and connected to an AKTA Purifier (GE Healthcare) was used to purify the MSP1E1. The column was activated with NiSO4, followed by equilibration with buffer E (40 mM Tris-HCl, 300 mM NaCl pH 8).
Previously stored soluble fraction was injected in the equilibrated IMAC column and the protein was eluted using a gradient as schematized in Figure 2.3. Initially the column was washed with buffer E until absorbance at 280 nm stabilized, this allowed an initial wash of proteins that do not interact with the resin.
Then, a gradient for 10 CV from 0 % to 100 % of buffer F (buffer E with 500 mM imidazole) was performed. Finally, the column was washed for 5 CV with 100% of Buffer F. During the elution a flow rate of 3 mL/min and with a maximum pressure of 0.4 MPa were used.
Collected fractions were analyzed by SDS-PAGE. The fractions that presented the same SDS-PAGE profile were combined, concentrated and stored at 4 °C.
2.2.3
Nanodiscs setup
The POPC (Avanti Inc. USA) or E. coli lipid extract (Avanti Inc. USA) were dissolved in chloroform
and stored at −20 °C in a glass vial. A lipid solution corresponding to 25 mg of lipids was dispensed to a round glass flask for chloroform evaporation in a rotary evaporator (Buchi) during 20 min. Reconstitution buffer (50 mM Tris-HCl, 300 mM NaCl, pH 8) with 250 mM sodium cholate was added to the lipids in a 1:2 proportion (lipid/sodium cholate (mol/mol)). Then the MSP was added to the mixture in the desired amount. For Nanodiscs with POPC the ratio MSP1E1:lipid was 1:80 (mol/mol) and for those containing E. coli lipids the ratio was 1:100 (mol/mol). The reconstitution mixture was
diluted to a final concentration of cholate of 14 - 40 mM and it was incubated at a specific temperature depending on the used lipids (4 °C for POPC and 37 °C for E. coli lipids).
17 After incubation, hydrated Biobeads were added to the mixture (500-800 mg for each 1 mL of mixture volume) for detergent removal, in order to initiate the process of self-assembly. Then the solution was incubated for the desired amount of time at room temperature with shaking (4 h for POPC and 2 h for the remaining lipids). Afterwards, Biobeads were removed and washed with reconstitution buffer. Obtained Nanodiscs were stored at 4 °C for the next purification step.
2.2.4
Nanodiscs’
purification protocol
A 24 mL Superdex 200 10/300 GL column connected to an AKTA Purifier 10 (GE Healthcare) was equilibrated with reconstitution buffer (50 mM Tris-HCl, 300 mM NaCl pH 8 at 4 °C). The previously prepared Nanodiscs were concentrated and injected in the column. An elution with reconstitution buffer was performed for 1.2 CV. The elution was performed with a flow rate of 0.5 mL/min with a maximum pressure of 1.5 MPa. Alternatively, a 290 mL Superdex 200 column was used, with a 0.5 mL/min with a maximum pressure of 0.5 MPa.
Collected fractions were analyzed by PAGE. Fractions were combined according to the SDS-PAGE profile and to the elution volume and concentrated to a final volume of 450 µL.
2.3 Biophysical characterization of Nanodiscs
2.3.1
Fluorescence spectroscopy
18
2.3.2
Circular Dichroism
Circular Dichroism spectra were measured with a Jasco J-815 Circular Dichroism Spectropolarimeter equipped with a Peltier temperature controller. For all samples, the measured absorbance spectra ranged from 200-260 nm. Samples were prepared in 50 mM Tris-HCl, 300 mM NaCl pH 8 at 4 °C.
Purified MSP1E1 sample was diluted to 6.15 µM and absorbance spectra were acquired with 100 scans at a scan rate of 100 nm/min. A temperature dependent experiment was performed from 10 to 80 °C with 10 °C increments with 5 min of temperature equilibration prior to acquisition.
Purified Nanodiscs were diluted to 1 µM and incubated at room temperature for 5 min and another 5 min at the required temperature, prior to analysis. Absorbance spectra of independent Nanodiscs solutions were acquired with 50 scans at a rate of 50 nm/min and from 10 °C to 80 °C.
2.3.3
Dynamic Light Scattering
Dynamic light scattering was used to determine the size of Nanodiscs using a ZETASIZER Nano series (Malvern) equipped with a Peltier temperature controller. Samples were prepared in 50 mM Tris-HCl, 300 mM NaCl pH 8 at 4 °C. Purified Nanodiscs solutions were filtered with a 22 µm filter and diluted to 10 µM. Prior to measurement, the samples were incubated 5 min at room temperature and another 5 min at the required temperature.
Temperature dependence experiments were performed with independent samples, from 10 °C to 80 °C, 120 scans and 10 seconds/scan in a quartz cuvette. Quadruplicates measurements for each temperature were acquired.
2.3.4
UV-Visible spectroscopy
The UV-Visible absorbance spectra were measured using a Shimadzu spectrophotometer and the temperature was controlled using a Thermopar and Thermomixer. For all measurements, the absorbance was measured between 250-700 nm. Samples were prepared in 50 mM Tris-HCl, 300 mM NaCl pH 8 at 4 °C.
19
2.3.5
Stokes’ radius and molecular mas
s determination
To determine the Stokes’ radius and the molecular mass of Nanodiscs samples a Superdex 200 10/300 GL column with a total volume of 24 mL was used. The column was connected to an AKTA Purifier 10 (GE Healthcare) and equilibrated with Nanodiscs reconstitution buffer (50 mM Tris-HCl, 300 mM NaCl pH 8 at 4 °C). The previously purified Nanodiscs were concentrated, injected in the column and eluted for 1.2 CV with reconstitution buffer. The elution was performed with a flow rate of 0.5 mL/min with a maximum pressure of 1.5 MPa.
Two calibration curves were constructed to determine the molecular mass and the Stokes’ radius of
Nanodiscs. The calibration curves were calculated using: Apoferritin (440 kDa and 6.1 nm)70; Catalase (221 kDa and 5.22 nm)71; Glucose Oxidase (186 kDa and 5.2 nm)70; Aldolase (158 kDa and 4.81 nm)71; Conalbumin (77 kDa and 3.6 nm)72 and Ovalbumin (44 kDa and 3.05 nm)71. The Stokes’ radius and molecular mass of the Nanodiscs were assessed by combining the elution profiles and the Stokes’ radius
or molecular mass from protein standards. To determine the Stokes’ an initial estimation of KAV
(partitions’ constant) is made via eq. 1.1.
KAV=(Ve-Vo)/(Vt-Vo) (eq. 1.1)
Where Ve is the elution volume, V0 is the void volume of the column and Vt is total volume of the column.
With KAV a chart can be plotted, where (-log KAV)1/2 as function of Stokes radius for standard proteins.
2.3.6
NMR spectroscopy experiments
All NMR spectroscopy experiments were performed at the ITQB magnetic resonance center, CERMAX using standard Bruker pulse programs73.
Purified MSP1E1, 15N-MSP1E1, POPC Nanodiscs (ND_P) and E. coli lipid Nanodiscs (ND_E) samples were prepared in 10 % D2O/ 90 % buffer. Buffer composition changed according to the experience and it was titrated to work at 4 °C. Two-dimensional 1H-15N and 1H-13C HSQC NMR spectra were collected at 25 °C on a Bruker Avance III 800 spectrometer (Bruker, Rheinstetten, Germany) with a TXI probe. 1H-13C HSQC spectra were collected for MSP1E1 sample (10 % D
2O/ 90 % 50 mM NaH2PO4, 300 mM NaCl pH 8) using “hsqcetgpsisp” pulse program with a delay (P1) of 9.58 µs. 1H-15N HSQC spectra were collected for 15N-MSP1E1 sample (10 % D
2O/ 90 % 50 mM NaH2PO4, 300 mM NaCl pH 8) using
a “hsqcetf3gpsi” pulse program with a delay (P1) of 9.53 µs. 1H-13C HSQC spectra were collected for ND_P sample (10 % D2O/ 90 % 50 mM NaH2PO4, 200 mM NaCl, pH 7.5) using “hsqcetgpsisp” pulse program with a delay (P1) of 10.15 µs. 1H-13C HSQC spectra were collected for ND_E (10 % D
2O/ 90 % 40 mM NaH2PO4, 200 mM NaCl, pH 7.5) using “hsqcetgpsisp” pulse program with a delay (P1) of 9.63 µs. One dimensional 31P NMR spectra were collected at different temperatures on a Bruker Avance III 500 spectrometer (Bruker, Rheinstetten, Germany) with a 31P SEX P-H-D probe using a “zgprde”
20
3
Results and discussion
3.1 NuoL expression and purification
One of the objectives of this thesis was to identify the amino acid residues involved in the ion translocation by NuoL subunit of Complex I from E. coli. To approach this objective several protein
constructs were designed. In this thesis, we present the work developed with the construct spanning the TM9-13 region, which corresponds to the second repeat of NuoL. This construct also contains two tags: a GFP and histidine residues that are located at the C-terminal and N-terminal respectively. The six-histidine residue tag was introduced to improve the purification processes, while the GFP tag was included to facilitate the expression of the protein, to assist on the folding74 of the protein and to allow monitoring the protein expression by fluorescence spectroscopy.
The expression of the second repeat construct was performed as described in the Material and Methods.
Table 3-1: Optical density measurements at 600 nm at different time points during a period of 24 h, after inoculation.
Time (h:min) OD600 nm Observations
1 0.08 -
2:45 0.4 -
3:15 0.77 Induction with 0.7 mM IPTG
23:45 3.52 -
The cell growth was monitored over time and Table 3-1 shows the optical density of transformed E. coli
C43 (DE3) cells grown in LB medium at 37 °C for 24 h. At the end of the growth, the cell culture presented a cell density approximately of OD600 nm of 3.5.
By SDS-PAGE no protein band with a higher intensity, possibly indicating the protein expression was detected. To confirm whether the construct was expressed, the fluorescence of the GFP was measured at different time points of the growth (before induction and at the end of the cell culture growth).
21 The fluorescence spectrum of the sample collected before the induction did not present a band with a maximum at 515 nm (see Figure 3.1 dark grey). This means that there was no basal expression of the construct, prior to protein expression induction. The fluorescence spectrum of the final point of the cell growth presented a band with a maximum at 515 nm, suggesting that GFP and consequently the rest of the construct were expressed (see Figure 3.1 light grey).
After confirmation of the expression of the NuoL construct, cells were disrupted and solubilized membranes were obtained as described in Material and Methods. The solubilized membranes were subjected to two chromatographic steps.
Figure 3.2: IMAC’s (26 mL) chromatogram of solubilized membranes in 50 mM Tris-HCl, 500 mM NaCl, 0.05 % DDM, pH 8. The black trace represents the absorbance at 280 nm and the grey line the percentage of buffer B (50 mM Tris-HCl, 500 mM NaCl, 500 mM imidazole, 0.05 % DDM, pH 8). The boxes refer to the obtained fractions.
The first step was performed in an IMAC column. The chromatogram (Figure 3.2) shows the elution profile indicating that several proteins eluted at different percentages of buffer B. At 0 % buffer B, the proteins that did not interact with the resin were eluted. Increasing buffer B to 5 % lead to further elution of weakly interacting proteins. When a gradient from 5 % to 100 % of buffer B was performed, two bands, corresponding to proteins that strongly interact with resin were obtained. The construct strongly interacts with the resin due to the presence of his tag thus the elution of the construct is expected to take place in the imidazole gradient step. From 420 mL and forward, the absorbance linearly increases with the increase in concentration of imidazole. UV-Visible spectroscopy confirmed that imidazole absorbs at 280 nm and this could imply that from 420 mL and forward there was no elution of proteins. To study the presence of the construct, fluorescence and UV-Visible spectroscopies were used to detect the presence of the GFP tag. Fluorescence spectroscopy showed that there is a band with a maximum at 515 nm in every fraction with UV-Visible absorbance at 280 nm. This suggests the construct’s presence
of in every fraction that has absorbance at 280 nm, i.e. in fraction I to IV.
22 follow: fraction I (0 % imidazole), fraction II (5% imidazole), fraction III and IV (UV- Visible spectra). For fraction III, the UV-Visible spectra revealed that cytochrome was present, as maximum characteristic peaks of these proteins were observed at 530 nm and 560 nm. This suggests that the cytochrome can strongly interact with the resin or it may interact with the construct. UV-Visible spectrum from fraction’s IV measured absorbance at 280 nm and near 403 nm (which is characteristic of GFP).
To confirm the presence of the construct, a Western Blot (WB) analysis was made using a specific antibody that interacts with GFP.
Figure 3.3: SDS-PAG (left) and WB (right) of the obtained IMAC’s fractions (Figure 3.2). M – molecular mass marker; roman numerals correspond to the fraction of previous chromatogram (see Figure 3.2).
23 Figure 3.4: HTP chromatogram of fractions III (a) and IV (b) of IMAC’s chromatogram. In black is represented the absorbance at 280 nm and in grey the percentage of buffer D (1 M potassium phosphate, 0.05 % DDM, pH 7.6). The boxes represent the fractions represent in which the chromatograms’ fractions were divided.
Chromatograms from HTP column, of fractions III and IV from the IMAC, are represented in Figure 3.4 a) and b) respectively. Both chromatograms show different proteins elute at different percentages of buffer D. Fluorescence spectroscopy revealed the presence of a band with a maximum at 515 nm in all fractions. Visible spectroscopy showed that fraction IV from Figure 3.4 a) had a characteristic UV-Visible spectrum of cytochrome Based on this information, the criteria for the separation of fractions was the elution volumes represent as blue boxes in Figure 3.4.
Figure 3.5: a) SDS-PAG (left) and WB (left). M- High molecular mass marker and roman numerals correspond to the fraction of previous chromatogram; b) SDS-PAG (left) and WB (left). M- High molecular mass marker and roman numerals correspond to the fraction of previous chromatogram.
In order to confirm where the construct eluted, SDS-PAGE and WB were performed (see Figure 3.5). SDS-PAG of the fractions from HTP chromatography presents several bands in each lane, demonstrating that the construct is not pure. WB shows that fractions from HTP have the same pattern as the fractions from IMAC, indicating that the construct is eluted in every fraction.
Due to the small amount of protein recovered in the last purification step, no further chromatographic methods were tested.
25
3.2 Characterization of Nanodiscs
3.2.1
Expression and purification of MSP1E1
One objective of this thesis was to characterize the Nanodiscs membrane-mimicking environment. The Nanodiscs are constituted by lipids and held together by the membrane scaffold proteins (MSPs). In this work, the MSP used was the MSP1E1 and it was expressed using E. coli BL21-DE3 (GOLD) system.
The expression of the protein was performed as described in the Materials and Methods.
Figure 3.6: Example of a growth curve of E. coli BL21-DE3 (GOLD) expressing MSP1E1. The black arrow indicates the time of addition of 0.5 mM IPTG to promote the induction of protein expression, black dots indicate the measured optical density of the cells and the dashed line is a visual guideline. b) SDS-PAG of aliquots collected during E. coli cell growth (M –Low molecular mass marker; 1- before induction; 2- 1 hour after induction; 3- 2 hours after induction; 4- 3 hours after induction; 5- 4 hours after induction; 6- 5 hours after induction; 7- Overnight culture.
The growth of the cell culture was monitored (Figure 3.6a)) in time, and the growth profile of the transformed E. coli BL21-DE3 (GOLD) growing in LB medium at 37 °C was followed. The protein
expression was assessed by SDS-PAGE, a protein band with higher intensity was observed, in lanes 3 to 7, which migrated close to the 30 kDa marker (Figure 3.6b)), corresponding to the expected molecular mass of the MSP1E1. The MSP1E1 band intensity remains constant after four hours of expression, suggesting that 4 hours of expression are enough to obtain MSP1E1.
After confirmation of MSP1E1’s expression, cells were disrupted and the soluble fraction was obtained
26 Figure 3.7: IMAC’s chromatogram of MSP1E1. The black trace represents the absorbance at 280 nm and the grey line the concentration of buffer F (40 mM Tris-HCl, 300 mM NaCl, 500 mM imidazole, pH 8).
Figure 3.8: SDS-PAG of the different fractions from the IMAC chromatography. a) SDS-PAG of fraction I, M- Low molecular mass marker; 2-14 sequential tubes from fraction I. b) SDS-PAGE of fraction II 15-18 sequential tubes from fraction II, M-Low molecular mass marker.
The purification of the MSP1E1 was performed in an IMAC column. The chromatogram in Figure 3.8 shows several proteins eluting at different percentages of buffer F: at 0 % buffer F, the proteins that did not interact with the resin were eluted; increasing buffer F to 5 % lead to further elution of weakly interacting proteins; when an elution gradient from 5 % to 60 % was performed, several proteins eluted. These, correspond to proteins that strongly interacted with the resin. The presence of his tag is expected to increase the interactions with the resin, thus the elution of the MSP1E1 is expected to take place in the imidazole gradient step.
27 The expression and the purification of MSP1E1 and 15N-MSP1E1 were successful allowing the process of assembly of NDs and posterior characterization studies.
3.2.2
Purification of Nanodiscs
Nanodiscs were obtained by following the procedures for self-assembly as described in Materials and Methods section 2.2.3. In this thesis, two types of Nanodiscs of different lipid composition were used. One type was composed of MSP1E1 and pure POPC lipids (ND_P) and the other constituted by MSP1E1 and E. coli lipid (ND_E). The correctly assembled Nanodiscs were separated by one
chromatographic step shown in Figure 3.10 (for POPC lipids) and Figure 3.11 (for the E. coli lipids).
Figure 3.9: S-200 SEC’s chromatogram and SDS-PAG of ND_P. In the SDS-PAG: M-Low Molecular Mass Marker; 1 – Empty lane; 2 – Before injection in S-200; 3 – Filtrate of injected sample; 4 – Empty; 5 – Fraction I; 6 – Fraction II and 7- Fraction III.
Figure 3.10: S-200 SEC’s chromatogram and SDS-PAG of ND_E. In the SDS-PAG: M-Low Molecular Mass Marker; 1 – Empty lane; 2 – Before injection in S-200; 3 – Filtrate of injected sample; 4 – Empty; 5 – Fraction I; 6 – Fraction II.
Both chromatograms show the elution of different proteins complexes at different retention volumes. The SDS-PAGs represented next to the chromatograms show an intense band, which migrated close to the 30 kDa marker, confirming the presence of the MSP1E1.
28 expected diameter of those NDs (see Table 1-3) and to a molecular mass near 175 kDa. The peaks present in both chromatograms are well resolved, which indicates that the separation process was efficient.
In both chromatograms, a peak at 8 mL of elution was observed, as this elution volume corresponds to the void volume of the column it was assigned to particles that have a higher molecular mass.
After the successful purification step, the NDs stored at 4 °C for further characterizations.
3.3 Biophysical characterization of Nanodiscs
Nanodiscs (ND_P and ND_E) and free MSP1E1 protein were studied by several techniques: fluorescence spectroscopy, circular dichroism, dynamic light scattering, size exclusion chromatography, UV-Visible and NMR spectroscopies.
3.3.1
Determination of the Stokes’ radius and molecular mass
A size exclusion chromatography can be used to determine the hydrodynamic radius (Stokes’ radius) and the molecular mass of the purified NDs, using calibration curves with standards of known Stokes’ radius and molecular mass. The procedures for the determination of the Stokes’ radius and for the
molecular mass are described in the Material and Methods.
Figure 3.11: Normalized elution profiles of ND_P and ND_E in a 24 mL S-200 SEC column. The Stokes’ radius, of protein standards, are also indicated above the graph.
The S-200 SEC chromatograms of ND_P and ND_E are represented in Figure 3.11 and the elution volume of both NDs was near 12.5 mL, meaning they have similar volume and molecular mass.
The Stokes’ radius and molecular mass of the Nanodiscs were assessed by combining the information
29 Figure 3.12: Calibration curves for the determination of: a) Stokes’ radius and b) molecular mass of the NDs. The colors red and orange refer to ND_P and ND_E, respectively.
Figure 3.13: Normalized elution profile of the different proteins used for the determination of molecular mass and Stokes’ radius of NDs. The standards are: Aldolase (blue), Catalase (green), Conalbumin (blue), Dextran blue (green for calibration reference), Ferritin (red), Glucose Oxidase (purple) and Ovalbumin (red).
The chromatograms represented in Figure 3.12 are the second purification of the NDs (ND_P and ND_E), therefore the identified populations of NDs will be present during the biophysical characterization.
The elution profile of ND_P (Figure 3.12 dark grey) showed the NDs elute at 12.9 mL with a small shoulder at lower elution volumes. According to literature44, this small shoulder should correspond to NDs with different lipid/protein ratios. However, these slightly bigger NDs should not affect the further characterization of the NDs because they are present in low amount. An elution volume of 12.9 mL, according to the calibration curves (Figure 3.13) corresponds to a 4.83 nm radius and to a 175.59 kDa. These values are in agreement with the predicted molecular mass (175.34 kDa) and diameter (10.3 nm of diameter Table 1-3) for the MSP1E1 NDs.
30 ND_P and ND_E have similar retention volumes, consequently similar Stokes’ radius and molecular mass. Both types of NDs were assembled at the same time and ND_E presents a small peak at 8 mL that corresponds to aggregates suggesting that the ND_E is less stable and tend to aggregate faster than ND_P.
These results show that the assembled NDs (ND_P and ND_E) have the expected characteristics thus further biophysical characterization can be performed.
3.3.2
Fluorescence spectroscopy
Fluorescence spectroscopy is a technique that can study the intrinsic fluorescence of proteins. The amino acids residues that exhibit fluorescence are tryptophan, phenylalanine, and tyrosine75. Using fluorescence spectroscopy it is possible to study the environment75 (e.g. polar or apolar) in which these residues are embedded. Tryptophan residues absorb more than the other two amino acid residues, thus this residue dominates the fluorescence emission spectrum75.
The fluorescence of the tryptophans was determined at room temperature aiming to investigate their environment when reconstituted in the NDs. The maximum intensity of fluorescence was close to 340 nm for all studied samples (Figure 3.15, Figure 3.16 and Figure 3.17). According to literature72, this
wavelength suggests the tryptophan’s environment is polar, in this case, the tryptophans are exposed to the buffer.
31 Figure 3.15: a) Fluorescence emission spectra, with of excitation at 280 nm, of ND_E from 10 °C to 80 °C and b) Fluorescence emission spectra of ND_E at 25 °C (before and after being 80 °C exposure) and at 80 °C. The spectrum obtained at 80 °C is shown for comparison. Samples were prepared in 50 mM Tris-HCl, 300 mM NaCl pH 8.
Figure 3.16: Fluorescence emission spectra of isolated MSP1E1, with excitation at 280 nm, from 20 °C to 80 °C. Samples were prepared in 50 mM Tris-HCl, 300 mM NaCl pH 8.
Fluorescence emission spectra obtained at different temperatures for NDs and of MSP1E1 (Figure 3.14 a), Figure 3.15 a) and Figure 3.16) show that the band maximum wavelength remains at 340 nm. This indicates that the tryptophans do not change their environment (i.e. polar) at the studied temperatures. With increasing temperature, it was also observed the decrease of fluorescence intensity. This occurs
due to the decrease of the tryptophans’ excitation lifetime, where the energy from tryptophans’ excited
state is transferred to the solvent76.
A thermal stability test was made to assess the behavior of NDs after exposure to 80 °C as described in the Materials and methods. Figure 3.14b) and Figure 3.15b) show the spectra for both types of NDs at 20 °C, before and after exposure to 80 °C, and at 80 °C. The NDs present similar spectra before and after exposure to 80 °C, suggesting the fluorescence intensity recovers and that NDs are stable at the studied temperatures.