www.ccarevista.ufc.br ISSN 1806-6690
A mixed model applied to joint analysis in experiments with coffee
blends using the least squares method
1Modelo misto aplicado à análise conjunta em experimentos com blends de café
utilizando o método de mínimos quadrados
Allana Lívia Beserra Paulino2*, Marcelo Angelo Cirillo3, Diego Egídio Ribeiro4, Flávio Meira Borém4 and
Gabriel Carvalho Matias5
ABSTRACT - The aim of the present study was to propose a mixed model for a sensory analysis of four experiments with
blends of different standards of quality, including the species Coffea Arabica L. and Coffea Canephora. Each experiment differed in the proportions used to formulate the blends and the concentrations used in preparing the beverages, these being 7% and 10% coffee powder for each 100 ml of water. The response variables under analysis were the sensory characteristics of the beverage found in an assessment made by a group of trained tasters, considering taste, bitterness and a final score. Each description followed a numerical rating scale of intensity that ranged from 0 to 10. The model was implemented using the least squares method; this led to the conclusion that including random parameters in the model, represented by the experiments, made it possible to compare the effect of each component simultaneously for each of the experiments.
Key words: Processing. Quality. Arabica. Conillon.
RESUMO - O presente estudo tem por objetivo propor um modelo misto em uma análise sensorial de quatro experimentos
de blendscom diferentes padrões de qualidade envolvendo as espécies Coffea Arabica L. e Coffea Canephora. Cada experimento foi diferenciado em função das proporções utilizadas na formulação dos blendse das concentrações utilizadas no preparo dabebida, sendo elas 7% e 10% de pó de café para cada 100 ml de água.As variáveis respostas analisadas foram características sensoriais encontradas na bebida do café a partir de avaliação feita por grupo de provadores treinados. As características consideradas foram o sabor, o amargor e a nota final. Cada descrição respeitou uma escala numérica de avaliação da intensidade que variou de 0 até 10. A implementação do modelo foi através do método de mínimos quadrados, possibilitando concluir que a inclusão dos parâmetros aleatórios no modelo, representados pelos experimentos permitiu comparar o efeito de cada componente, simultaneamente a todos os experimentos.
Palavras-chave: Processamento. Qualidade. Arábica. Conillon.
DOI: 10.5935/1806-6690.20190041 *Author for correspondence
Received for publication 19/03/2018; approved on 14/08/2018
1Parte da Dissertação de Mestrado do primeiro autor apresentada ao programa de Pós-Graduação em Estatística e Experimentação Agropecuária
da Universidade Federal de Lavras/UFLA
2Departamento de Estatística/DES, Universidade Federal de Lavras/UFLA, Campus Universitário, Lavras-MG, Brasil, [email protected] (ORCID
ID 0000-0001-9937-5555)
3Departamento de Estatística/DES, Universidade Federal de Lavras/UFLA, Campus Universitário, Lavras-MG, Brasil, [email protected] (ORCID
ID 0000-0003-2026-6802)
4Departamento de Engenharia Agrícola/DEA, Universidade Federal de Lavras/UFLA, Campus Universitário, Lavras-MG, Brasil, [email protected]
(ORCID ID 0000-0002-1145-8661), [email protected] (ORCID ID 0000-0002-6560-8792)
5Graduando em Engenharia Agrícola, Universidade Federal de Lavras/UFLA, Lavras-MG, Brasil, [email protected] (ORCID ID
INTRODUCTION
Quality is the main factor in describing a coffee as different or special. This characteristic is mainly determined by the flavour and aroma formed during roasting from compounds found in the raw beans that are considered the precursors of quality (FARAH et al., 2005; RIBEIRO et al., 2016). However, these compounds vary depending on geographical origin, on species and/ or variety, and on the method of processing, drying, improvement and storage (BORÉM et al., 2008; BORÉM et al., 2013; ISQUIERDO et al., 2011; RIBEIRO et al., 2011). Brighenti and Cirillo (2018) state that the demand for high quality coffee has become a well-established criterion for achieving better prices. This has been the object of research for evaluating coffee beans by size and by the number of defects in a sample.
In the search to standardise the quality of the final product, the coffee industry employs the use of blends. This is a strategic action that allows access to different markets and alters the selling price (FERNANDES et al., 2003; RIBEIRO et al., 2014).
A blend may be understood as a mixture of two or more types of coffee, which may or may not be of the same species. They may also have different geographical origins or even be from different harvests (FERNANDES et al., 2003; RIBEIRO et al., 2014).
In addition to acceptance by the end consumer, formulating blends also represents an important mechanism of market competitiveness for the coffee industry, by providing a means of reducing production costs and increasing yield (IVOGLO et al., 2008).
In analyses involving the mixture of different components into coffee blends, it is found that a change in one of the components alters the composition of the others, so that the most suitable statistical technique is to plan experiments employing different mixtures (VILLAFRANCA, 1999) that include process variables such as temperature, which have no part in the composition of the blend but which affect its characteristics (CIRILLO, 2015).
As such, when it comes to the sensory analysis of blends, there is a definite change in the chemical composition of the beverage. This complicates the experimental sensory analysis of blends formulated with coffees of different species and differing quality.
In commercial terms, formulating blends may be a more affordable alternative for consumers in relation to the price of speciality coffees, to which the low-income population generally has no access. Due to the range of coffee prices on the market, formulating blends of speciality C. Arabica with C. Canephora can result in
products with qualities that add sensory characteristics which can be perceived by the consumer.
Based on the above, the aim here is to add a new methodological proposal for comparing experiments of blends formulated with coffees with different standards of quality and evaluated from different concentrations of the beverage. This work was carried out with the aim of proposing a mixed model that considers the experimental parameters as random effects.
In a didactic approach, the methodology presented for estimating the parameters of the model is verified in the approach given by the method of least squares, which is little used in constructing mixed models, but can be easily understood by the researcher for use in other implementations, since the method consists of minimising the residual sum of squares without presupposing any statistical distribution for the response variable.
MATERIAL AND METHODS
Coffees with different standards of quality were used to formulate the blends, considering proportions of the speciality varieties of Arabica coffee, Bourbon Yellow (BSC) and Acaia (ASC), as well as Conilon coffee (CC) and a commercial brand of roasted coffee (RC).
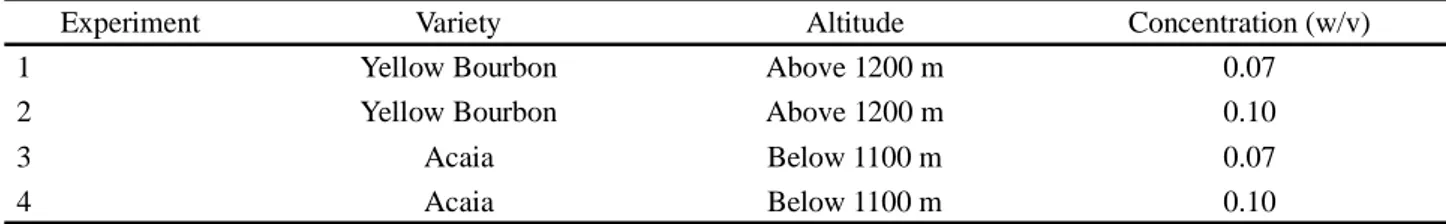
The samples of the speciality coffees were produced in the district of Carmo de Minas, located in the Mantiqueira de Minas region of the State of Minas Gerais, Brazil, recognised worldwide for the production of speciality coffees (RIBEIRO et al., 2016). The sample of Conilon coffee represents a mixture of batches produced in the State of Espírito Santo, Brazil. The commercial roasted coffee represents a brand marketed on the domestic market, commonly consumed in the southern region of the State of Minas Gerais. Four experiments were carried out considering the speciality coffees, in addition to the percentage concentrations of 0.07 and 0.10 (w/v) to characterise blends of different concentrations. A brief description of the experiments can be found in Table 1.
The samples were prepared at the above concentrations using drinking water at 93 °C; no sugar was added. Extraction time was 4 minutes, using the filtration method of preparation. In this way, any risks related to allergic reactions or to increases in the glucose levels of the individual testers, taken from a sample of ordinary consumers, were avoided, respecting the standards of hygiene imposed by the ethics committee under CAAE protocol 14959413.1.0000.5148.
With the aim of deducing the effect of the percentage concentrations of the beverage - defined as 0.07 and 0.10 w/v (35g/500 ml), where 0.07 (w/v) refers
Table 1 - Characterisation of the treatments used in the composition of the dry-processed blends
Experiment Variety Altitude Concentration (w/v)
1 Yellow Bourbon Above 1200 m 0.07
2 Yellow Bourbon Above 1200 m 0.10
3 Acaia Below 1100 m 0.07
4 Acaia Below 1100 m 0.10
to 7 grams of coffee powder (w for weight) for each 100 ml of water (v for volume), with the same for 0.10 - the experiments were evaluated together, considering the compositions described in (Table 2). The blends were identified in the joint analysis using coded samples (k = 1, ..., 36), which referred to the blends analysed in experiments 1, 2, 3 and 4. The blends included a commercial product, coffee from the species Canephora, henceforth referred to as Conilon, as shown by the description in Table 2 for process type.
Each experiment was carried out in a separate session at intervals of 24 hours due to the excessive
Table 2 - Composition of the blends made from Bourbon (BSC), Commercial roasted (RC), Conilon (CC) and Acaia (ASC) coffees
Sample (K) Experimento 1 Experimento 3
BSC RC CC ASC Sample (K) BSC RC CC ASC
1 1.000 0.000 0.000 0.000 19 1.000 0.000 0.000 0.000 2 0.670 0.330 0.000 0.000 20 0.670 0.330 0.000 0.000 3 0.340 0.330 0.330 0.000 21 0.340 0.330 0.330 0.000 4 0.500 0.500 0.000 0.000 22 0.500 0.500 0.000 0.000 5 0.500 0.000 0.500 0.000 23 0.500 0.000 0.500 0.000 6 0.340 0.660 0.000 0.000 24 0.340 0.660 0.000 0.000 7 0.340 0.000 0.660 0.000 25 0.340 0.000 0.660 0.000 8 0.000 1.000 0.000 0.000 26 0.000 1.000 0.000 0.000 9 0.000 0.000 1.000 0.000 27 0.000 0.000 1.000 0.000
Sample (K) Experiment 2 Experiment 4
BSC RC CC ASC Sample (K) BSC RC CC ASC
10 0.000 0.000 0.000 1.000 28 0.000 0.000 0.000 1.000 11 0.000 0.330 0.000 0.670 29 0.000 0.330 0.000 0.670 12 0.000 0.330 0.330 0.340 30 0.000 0.330 0.330 0.340 13 0.000 0.500 0.000 0.500 31 0.000 0.500 0.000 0.500 14 0.000 0.000 0.500 0.500 32 0.000 0.000 0.500 0.500 15 0.000 0.660 0.000 0.340 33 0.000 0.660 0.000 0.340 16 0.000 0.000 0.660 0.340 34 0.000 0.000 0.660 0.340 17 0.000 1.000 0.000 0.000 35 0.000 1.000 0.000 0.000 18 0.000 0.000 1.000 0.000 36 0.000 0.000 1.000 0.000
number of evaluations. The group of potential tasters had previously been selected by testing to see whether they were able to differentiate the samples used in the sensory experiments. After selection, the final group consisted of five qualified tasters. For the sensory analysis, each taster sampled around 20 ml of beverage prepared from the formulated blends at a temperature of around 65 oC, served in disposable cups on individual worktops.
After tasting each blend, the taster recorded his evaluation on special cards. When evaluated, the blends received a score ranging from 0 to 10 for the qualitative characteristics of the beverage: flavour and bitterness, and
a final score that represented the overall impression of quality described by the testers. It should be noted that the Gaussian model was used for these variables based on the responses being obtained on a continuous scale.
For the purposes of the method, when setting up the mixed model, the components were numbered X1, X2, X3 and X4 respectively.
Setting up the mixed model
Estimation of the mixed model was carried out using the least squares method, following the procedure suggested by Kalirajan (1990). Initial data entry is first performed for each experiment, indexed as t = 1, ..., 4 and r = 1, 2 referring respectively to the concentrations established for the tth experiment.
Following these specifications, X1, ..., X4 correspond to the variables of the mixtures (Table 2); the variables Z1, ..., Z4 correspond to the incidence matrix, given in (2), which identify the experiments as parameters in the model.
(1)
(2)
The ordinary least square estimates of Yi (i = 1,2 and 3) were then obtained, representing the responses associated with the attributes taste, bitterness and score, as per expression (3).
(3) where: (S’tSt)- is the generalised inverse formed from the matrix partition given below.
(4)
where: S22
t is the information matrix corresponding to the random effects associated with the design matrix, in turn associated with the Z-matrix. Joint estimates of the model parameters were made following the procedure adopted by Swamy (1971), so as to consider the parametric constraints in relation to the covariance matrix of the parameters and information of the random effects; the generalised least squares estimates are thus obtained by (5)
(5) where,
(6) In (6) is shown the variance for each experiment, defined in (7), where n is the total number of experimental points, p is the number of fixed-effect covariates and q the number of random variables.
The initial estimates for σ2 and ∆ were given respectively by
(7) and the global covariance matrix of the parameters of the estimated model by (8)
(8) Note that the first term refers to the covariance of the estimated model parameters adjusted for each experiment (t = 1, ..., 4), and the second term to the information of the random effects, with Ȭ presented by (9)
(9) However, as per the recommendations of Kalirajan (1990), the weight matrix was corrected, applying the singular value decomposition theorem,
(10) so that if M is a matrix of orthogonal vectors, and a diagonal matrix composed of eigenvalues, then V is redefined by (11)
and substituted in expression (5), the mixed model is then given by the equation
(12) specifying the Xjth component (j = 1,...,4) in the rth concentration (R = 1,2) to characterise the fixed effects, the parameters of the random effects were represented by
γi (t =1,...,4) and εijrt the random effect distributed with .
Based on the predicted values, the graph of the experimental profiles was then constructed for each component, where the effect of the process variable was given as a covariate. To carry out the analysis, scripts were designed in the R software (R CORE TEAM, 2017), available in the BLENDSTAT package.
RESULTS AND DISCUSSION
It should be emphasised that, in general, sensory evaluation is a science that uses the human senses of vision, smell, touch, taste and hearing to evaluate the characteristics or attributes of a product, and is a tool intensively used by the food, beverage, cosmetic, perfume, cleaning-product and automobile industries, among others. In this study, the sensory experiments were directed towards analysing the quality of coffee blends. The discussion is given below.
In analysing the experiments and their effects relative to the non-speciality coffees which are better-known to consumers, the results described below correspond to the experimental analysis of blends of Conilon (CC) and roasted and ground coffee (RC).
Another point is explained by Ferreira et al. (2016), and refers to the fact that untrained consumers have a high probability of not discriminating the quality of speciality coffees. That study is corroborated by using distributions of extreme values which consider the effect of discrepant observations. Liska et al. (2015) proved by means of
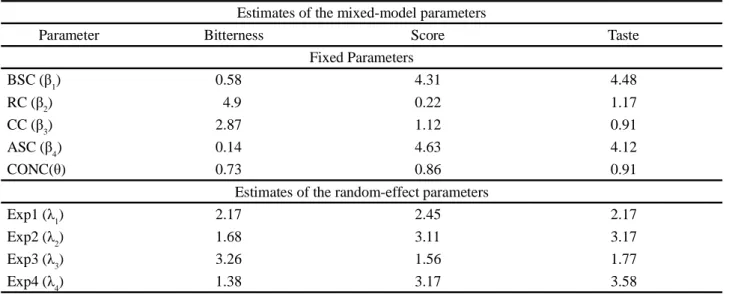
Table 3 - Estimates of the mixed-model parameters for the dry-processed blends
Estimates of the mixed-model parameters
Parameter Bitterness Score Taste
Fixed Parameters BSC (β1) 0.58 4.31 4.48 RC (β2) 4.9 0.22 1.17 CC (β3) 2.87 1.12 0.91 ASC (β4) 0.14 4.63 4.12 CONC(θ) 0.73 0.86 0.91
Estimates of the random-effect parameters
Exp1 (λ1) 2.17 2.45 2.17
Exp2 (λ2) 1.68 3.11 3.17
Exp3 (λ3) 3.26 1.56 1.77
Exp4 (λ4) 1.38 3.17 3.58
the boosting method applied to sensory analysis, that untrained consumers do in fact have a low rate of success in differentiating the quality of speciality coffees.
The results, shown initially in Table 3, were then compared in the same way as the estimates of the mixed-model parameters, which was adjusted for the attributes Bitterness, Score and Taste, considering the composition of the blends.
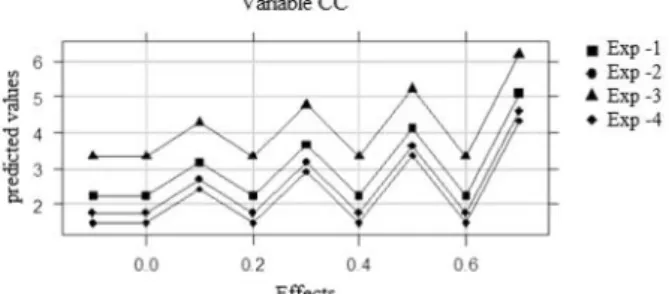
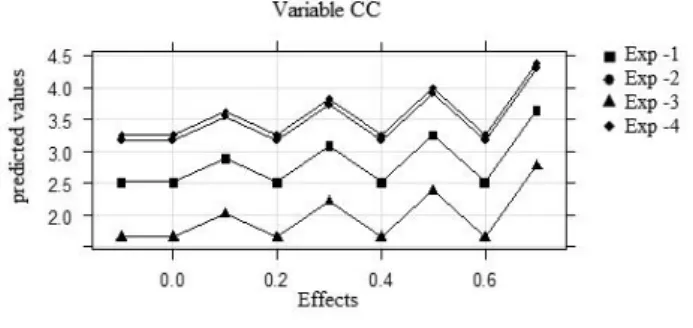
In the case of the attribute Bitterness, given the CC component (Conilon), it could be seen from Figure 1 that experiment 3, with the specifications of the Acaia variety produced at an altitude below 1100 m and formulated at a low concentration, proved to be heterogeneous in relation to the other blends characterised in experiments (2) - (4). Similarly, this characteristic was also seen in relation to the RC (Roasted Coffee) component, when observing the results shown in Figure 2, showing agreement of the experimental results for this attribute.
Comparing these results with those seen in relation to the same components and attribute for the dry-processed coffees, a difference can be seen in the heterogeneity of the experiments. Ribeiro et al. (2014) mention that for pure coffees this difference should not be attributed solely to the method of processing, but also to the occurrence of unwanted fermentation. In general, even considering the model parameters, such as the experiments described by random effects, oscillations naturally occur among the predicted values.
For the sensory attribute Taste, the curves plotted in Figures 3 and 4 show that the different speciality coffees were not discriminated in the experiments, since the results show that the experiments with the Acaia
Figure 1 - Trace plot of the experiments for the attribute
Bitterness in the dry-processed blends, for the CC (Conilon) variable
Figure 2 - Trace plot of the experiments for the attribute
Bitterness in the dry-processed blends, for the RC (Roasted Coffee) variable
and Bourbon varieties had similar responses. The small differences seen in discriminating these groups corroborate the results of Ossani et al. (2017) when carrying out a quality analysis of pure speciality coffees, in which the authors state that the similarity between Acaias and/or Bourbons can supposedly be explained by the chemical composition of the coffee beans, and may be influenced by genetic and environmental factors, and by pre- and post-harvest management conditions. In addition, to detect this similarity, the different altitudes and concentrations were considered.
As regards the sensory score, the results for the CC (Conilon) component shown in Figure 5, showed similar behaviour between experiments (2) and (4). This confirms the same characteristics seen in relation to the RC (Roasted Coffee) component; there is therefore evidence that the score, representing an overall impression, was influenced by the effect of the attribute bitterness, since the speciality coffees were not discriminated for this attribute.
Another result which should be emphasised comes from comparing the attributes evaluated in this work in relation to the RC (Roasted Coffee) component, since the experiments showed different types of behaviour, with the same characteristic of similarity between experiments as
Figure 3 - Trace plot of the experiments for the attribute Taste in
the dry-processed blends, for the CC (Conilon) variable
Figure 4 - Trace plot of the experiments for the attribute Taste in
the dry-processed blends, for the RC (Roasted Coffee) variable
seen in relation to the CC component (Figure 5). From this perspective, the results can supposedly be explained by Monteiro et al. (2010), who argue that the type of roast (light, medium or dark) greatly interferes with the intensity of the sensory characteristics of the beverage, such as flavour and final score, overall impression, and acceptance by the consumer.
The results were thus consistent with those of Ramos et al. (2016), using a process of data mining, more specifically, decision trees constructed using the CHAID method, in which the authors concluded that the sensory characteristics of the beverage from pure arabica coffee are associated with altitudes bands, with less influence from processing methods.
As noted, there are antagonistic effects seen in relation to the predicted responses, originating with the model that included random effects in the experiments (Figure 6).
From that point of view, there are reports in the literature, discussed by Moura et al. (2007), of a linear model with fixed effects, where the influence of roasting time and temperature on the sensory characteristics of pure arabica coffee, e.g. a linear increase in time and temperature, have a significant negative effect on taste and a significant effect on bitterness.
Figure 5 - Trace plot of the experiments for the attribute Score in
the dry-processed blends, for the CC (Conilon) variable
Due to the above, some care should be taken when extending this conclusion to the coffee blends formulated from these components, since in this study, different times and temperatures were not contemplated in the statistical model.
CONCLUSIONS
1. The inclusion of random parameters in the model, represented by the experiments, allowed the effect of each component to be compared in relation to each of the experiments;
2. The results showed that a preference for the blends that included the different speciality coffees reflected a more discriminated response to the CC (Conilon) and RC (Roasted Coffee) components.
ACKNOWLEDGEMENTS
The authors would like to thank CAPES and CNPq for their scientific and financial support.
REFERENCES
BORÉM, F. M. et al.Evaluation of the sensory and color quality of coffee beans stored in hermetic packaging. Journal of Stored
Products Research, v. 52, p. 1-6, 2013.
BORÉM, F. M. et al. Qualidade do café natural e despolpado após secagem em terreiro e com altas tempestades. Ciência e
Agrotecnologia, v. 32, n. 5, p. 1609-1615, 2008.
BRIGHENTI, C. R. G.; CIRILLO, M. A. Analysis of defects in coffee beans compared to biplots for simultaneous tables.
Revista Ciência Agronômica, v. 49, n. 1, p. 62-69, 2018.
CIRILLO, M. A. Otimização na experimentação: aplicações nas engenharias e ciências agrárias. Lavras: Editora UFLA, 2015. 226 p.
Figure 6 - Trace plot of the experiments for the attribute Score in
the dry-processed blends, for the RC (Roasted Coffee) variable
FARAH, A. et al. Effect of roasting on the formation of chlorogenicacid lactones in coffee. Journal of Agricultural and
Food Chemistry, v. 53, n. 5, p. 1105-1113, 2005.
FERNANDES, S. M. et al.Constituintes químicos e teor de extrato aquoso de cafés Arábia (Coffeaarabica L.) e conollon (Coffeacanephora Pierre) torrados. Ciência e Agrotecnologia, v. 27, n. 5, p. 1076-1081, 2003.
FERREIRA, H. A. et al. Selecting aprobabilistic model applied to the sensory analysis of specialty coffees performed with consumer. IEEE Latin America Transactions, v. 14, n. 3, 2016.
ISQUIERDO, E. P. et al. Qualidade do café cereja desmucilado submetido ao parcelamento da secagem. Coffee Science, v. 6, n. 1, p. 83-90, 2011.
IVOGLO, M. G et al. Divergência genética entre progênies de café robusta. Bragantia, v. 67, n. 4, p. 823-831, 2008.
KALIRAJAN, K. P. On the estimation of a regression model with fixed and random coefficients. Journal of Applied
Statistics, v. 17, n. 2, p. 237-244, 1990.
LISKA, G. R. et al. Evaluation of sensory panels of consumers of specialty coffee beverages using the boosting method in discriminant analysis. Semina: Ciências Agrárias, v. 36, n. 6, p. 3671-3680, 2015.
MONTEIRO, M. A. M. et al. Influência da torra sobre a aceitação da bebida café. Revista Ceres, v. 57, n. 2, p. 145-150, 2010. MOURA, S. C. S. R. et al. Influência dos parâmetros de torração nas características físicas, químicas e sensoriais do café Arábia puro. Brazilian Journal of Food Technology, v. 10, n. 1, p. 17-25, 2007.
OSSANI, P. C. et al. Qualidade de cafés especiais: uma avaliação sensorial feita com consumidores utilizando a técnica MFACT.
Revista Ciência Agronômica, v. 48, n. 1, p. 92-100, 2017.
R CORE TEAM. R: a language and environment for statistical computing. Vienna, Austria: R Foundation for StatisticalComputing, 2017. Disponível em:<http://www.R-project.org.>. Acesso em: 14/04/2018.
RAMOS, M. F. et al. Discrimination of the sensory quality of the Coffeaarabica L. (cv. Yellow Bourbon) produced in different altitudes using decision trees obtained by the CHAID method.
Journal of the Science of Food and Agriculture, v. 96, n. 10,
p. 3543-3551, 2016.
RIBEIRO, B. B. et al. Aceitação química e sensorial de blends de Coffeacanephora Pierre e Coffeea Arábica L. Coffea
Science, v. 9, n. 2, p. 178-186, 2014.
RIBEIRO, D. E. et al. Interaction of genotype, environment and processing in the chemical composition expression and sensorial quality of Arabica coffee. African Journal of Agricultural
Research, v. 11, n. 27, p. 2412-2422, 2016.
RIBEIRO, F. C. et al. Storage of green coffee in hermetic packaging injected with CO 2. Journal of Stored Products
Research, v. 47, n. 4, p. 341-348, 2011.
SWAMY, P. A. V. B. Statistical inference in random coefficient
regression models.Amsterdam: Springer Science & Business
Media, 1971. 209 p.
VILLAFRANCA, R. R. Diseño de experimentos para
laoptimización de mezclas. Castellon: ATC, 1999.