Revista Brasileira de
Engenharia Agrícola e Ambiental
Campina Grande, PB, UAEA/UFCG – http://www.agriambi.com.br
v.22, n.9, p.622-627, 2018
Stress index, water potentials and leaf succulence
in cauliflower cultivated hydroponically with brackish water
DOI: http://dx.doi.org/10.1590/1807-1929/agriambi.v22n9p622-627
Adiel F. da S. Cruz
1, Gerônimo F. da Silva
2, Ênio F. de F. e Silva
2,
Hammady R. e Soares
1, Jenyffer da S. G. Santos
3& Raquele M. de Lira
4A B S T R A C T
The tolerance of crops to salinity is greater in hydroponic systems due to the low contribution of the matric potential to the total potential of the water. The objective of this study was to evaluate the use of brackish water, to prepare the nutrient solution and replace the evapotranspired volume, and rates of application of this solution on the water stress index, water potential, leaf succulence and water consumption of cauliflower cv. ‘Piracicaba Precoce’. The experimental design was completely randomized in a 6 x 2 factorial scheme, with six salinity levels used to prepare the nutrient solutions (0.2, 1.5, 2.5, 3.5, 4.5 and 5.5 dS m-1) and
two application rates of these solutions (1.5 and 2.5 L min-1), with four replicates. Water stress
index (WSI), water and osmotic leaf potentials, leaf succulence (LS) and water consumption were analyzed. The increase in water salinity reduced LS and increased WSI. Water salinity reduced the water and osmotic leaf potentials and water consumption of the crop; however, the effects were more pronounced at the rate of 2.5 L min-1. Application rate of 2.5 L min-1
led to the highest WSI and lowest LS.
Índice de estresse, potenciais de água e suculência foliar
em couve-flor cultivado hidroponicamente
com águas salobras
R E S U M O
A tolerância das culturas à salinidade é maior em sistemas hidropônicos devido a pouca contribuição do potencial mátrico sobre o potencial total da água. Objetivou-se com este trabalho avaliar o uso de águas salobras, para o preparo da solução nutritiva e para a reposição da lâmina evapotranspirada além de vazões de aplicação desta solução sobre o índice de estresse hídrico, potenciais de água, suculência foliar e consumo hídrico total da couve-flor cv. Piracicaba Precoce. O delineamento experimental utilizado foi o inteiramente casualizado em esquema fatorial 6 x 2, com seis níveis de salinidade da água utilizada para o preparo das soluções nutritivas (0,2; 1,5; 2,5; 3,5; 4,5 e 5,5 dS m-1) e duas vazões de aplicação destas
soluções (1,5 e 2,5 L min-1), com quatro repetições. Foram analisados o índice de estresse
hídrico (IEH), os potenciais foliares hídrico e osmótico, a suculência foliar (SF) e o consumo hídrico total. O aumento da salinidade da água reduziu a SF e aumentou o IEH. A salinidade da água reduziu os potenciais foliares hídrico e osmótico e o consumo hídrico total da cultura, porém, os efeitos foram mais acentuados na vazão de 2,5 L min-1. A vazão de 2,5 L min-1
proporcionou o maior IEH e a menor SF.
Key words:
water relations hydroponics salinity
Palavras-chave:
relações hídricas hidroponia salinidade
1 Universidade Federal Rural de Pernambuco/Programa de Pós-Graduação em Engenharia Agrícola. Recife, PE. E-mail: [email protected] –
ORCID: 0000-0002-1182-3817; [email protected] - ORCID: 0000-0003-3475-3417
2 Universidade Federal Rural de Pernambuco/Departamento de Engenharia Agrícola. Recife, PE. E-mail: [email protected] (Corresponding author)
- ORCID: 0000-0002-3348-7252; [email protected] - ORCID: 0000-0002-8652-503X
3 Universidade Federal Rural de Pernambuco. Recife, PE. E-mail: [email protected] - ORCID: 0000-0001-7811-8947
4 Universidade Federal Rural de Pernambuco/Unidade Acadêmica de Serra Talhada. Serra Talhada, PE. E-mail: [email protected] - ORCID:
0000-0002-9035-7788
Introduction
Water scarcity in the world is a problem especially in countries with large semiarid regions, such as Brazil (Paulus et al., 2012). Given the scenario of low supply of potable water, studies and generation of technologies that allow brackish waters to be used in food production are relevant (Paulus et al., 2010, 2012).
Hydroponics emerges as an alternative technology that allows brackish waters to be used in the production of various crops, including vegetables (Santos et al., 2010; Soares et al., 2016). However, the main concern in using these waters even in hydroponic cultivation is the concentration of salts (Niu & Cabrera, 2010), because they can hinder plant development for reducing the osmotic potential of the solution, compromising water absorption and, consequently, modifying water consumption of crops (Paulus et al., 2012).
Cauliflower is classified as moderately tolerant to salinity (Giuffrida et al., 2016) and its cultivation has expanded considerably in the last years in Northeast Brazil. Nevertheless, the increasing occurrence of problems related to water and soil salinity in this region has led to the need for identifying alternative forms of water management for the production of this crop. In Brazil and especially in its Northeast region, studies related to the cauliflower crop under hydroponic and saline conditions which could contribute to the technical-scientific community are still incipient.
Based on the hypothesis that nutrient solution salinity and application rates interfere with water and physiological relations of a crop, this study aimed to evaluate the use of brackish waters to prepare the nutrient solution and replace the evapotranspired volume, besides rates of application of this solution, on the water stress index, water potentials, leaf succulence and total water consumption of cauliflower.
Material and Methods
The experiment was carried out at the Department of Agricultural Engineering of the Federal Rural University of Pernambuco (DEAGRI/UFRPE), Recife, PE, Brazil (8° 01’ 05” S; 34° 5’ 48” W; ~6.5 m) in a protected environment with arched cover and the following dimensions: 7.0 m width, 24.0 m length, 3.0 m ceiling height and 4.5 m height at its highest point.
The cauliflower cultivar used was ‘Piracicaba Precoce’, which was sown on polystyrene trays with 128 cells, two seeds per cell, using coconut fiber as substrate. At 30 days after sowing, seedlings were transplanted to the experimental units and started application of treatments.
A NFT (nutrient film technique) hydroponic system was used. Each plot had an independent 3-m-long hydroponic profile, with spacing of 0.50 m between plants and 0.60 m between 150-mm-wide trapezoidal profiles. The profiles were installed at average height of 1.0 m from the soil, with 5% slope. Each plot had an electric circulation pump (220 V, 32 W) and a tank for the nutrient solution with capacity of 50 L.
The experimental design was completely randomized in a 6 x 2 factorial scheme, corresponding to six salinity levels in the water (T1 = 0.2; T2 = 1.5; T3 = 2.5; T4 = 3.5, T5 = 4.5 and T6 =
5.5 dS m-1) and two rates of nutrient solution application (1.5 and 2.5 L min-1), with 4 replicates, totaling 48 experimental plots. Brackish waters were obtained by the addition of NaCl in public-supply water from the UFRPE (ECw = 0.2 dS m-1), based on the equation of Richards (1954), and were used to prepare the nutrient solution and replace the evapotranspired volume in the respective treatments.
The fertilizers used to prepare the nutrient solution and their respective quantities in g m-3 were: calcium nitrate (750), potassium nitrate (500), monoammonium phosphate (150) (MAP), magnesium sulfate (400), copper sulfate (0.15), zinc sulfate (0.3), manganese sulfate (1.5), boric acid (1.8), sodium molybdate (0.15) and Fe-EDTA-13% (16), according to Furlani (1998). The addition of these fertilizers to the public-supply water (ECw = 0.2 dS m-1) increased the electrical conductivity of the solution (ECsol) by 1.3 dS m-1. Thus, after homogenizing the solution, the initial ECsol of treatment was: 1.5 (T1), 2.8 (T2), 3.8 (T3), 4.8 (T4), 5.8 (T5) and 6.8 (T6) dS m-1.
ECsol and pH readings were taken on alternate days along the entire crop cycle (49) days). The nutrient solutions of the treatments were replaced always when ECsol in the control treatment became lower than 1.0 dS m-1. In addition, the following parameters were evaluated: water stress index (WSI), water potential (Ψw), osmotic potential (Ψo), leaf succulence (LS) and water consumption of the crop.
WSI was obtained by the equation WSI = TL – TA (Idso et al., 1977), where: WSI - water stress index, in ºC; TL - leaf temperature, in ºC; TA - air temperature, in ºC. Leaf temperature was obtained by daily measurements between 9 and 11 h, 10 readings per plot, using a portable infrared digital thermometer (ST-600.2). Air temperature was measured by a T-type thermocouple and recorded by a data logger (Campbell Scientific - CR1000) installed inside the greenhouse.
Water potential was evaluated before the sunrise, in leaves from the middle third of the plants, using the Scholander pressure chamber (Scholander et al., 1965).
Osmotic potential was determined in a vapor pressure osmometer (VAPRO WESCOR 5600), in leaves from the middle third of the plants, using 10 μL of extract of each sample, obtained by maceration of leaves with liquid nitrogen in a mortar using a pestle. The values obtained in mmol kg-1 were converted to osmotic potential using the van’t Hoff equation: Ψo = -RTC, in which: R - universal gas constant (0.00831 kg MPa mol-1 K-1); T - temperature in Kelvin (ºK) and C - concentration of the solute (mol kg-1).
Leaf succulence was determined according to the methodology proposed by Benincasa (2003), using the equation: LS = (LFP – LDP)/LA, in which: LS – leaf succulence, in mg H2O cm-2; LFP – leaf fresh phytomass, in mg; LDP – leaf dry phytomass, in mg; LA – leaf area. LFP was obtained by weighing at harvest, 49 days after transplanting, whereas LDP was obtained after drying in a forced-air oven at temperature of 70 ºC for 96 h. Leaf area was determined by the methodology of the discs according to Pereira & Machado (1987).
0.0 2.0 4.0 6.0 8.0 10.0
0 5 11 17 23 29 35 41 47
ECsol (dS m
-1)
DAT V2(2.5 L min-1)
T1 T2 T3 T4 T5 T6
5.0 5.5 6.0 6.5 7.0
0 5 11 17 23 29 35 41 47
pH
DAT V2(2.5 L min-1)
T1 T2 T3 T4 T5 T6
of the evapotranspired volume per plant (VETc) along the cycle, according to Eq. 1:
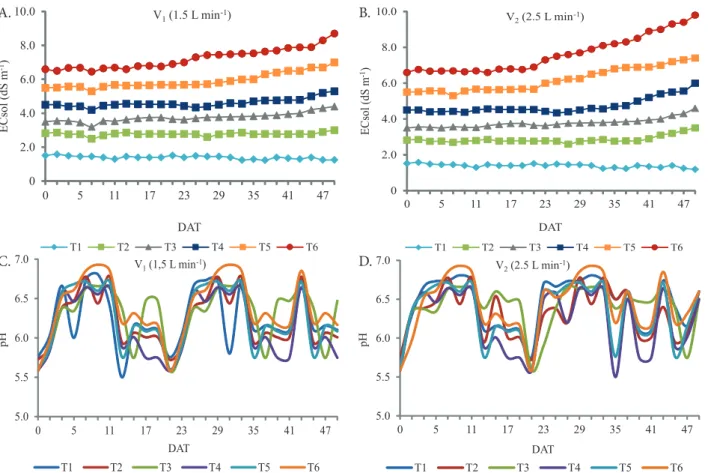
(1.5 dS m-1) and such trend was more pronounced in the treatments T3 (2.5 dS m-1), T4 (3.5 dS m-1), T5 (4.5 dS m-1) and T6 (5.5 dS m-1). This occurred because of the accumulation of salts caused by the increment in the salinity levels of the water used to prepare the nutrient solution and the lower absorption of nutrients in these treatments because, according to Furlani (1998), in hydroponic cultivation systems, the composition of the nutrient solution changes as the plant absorbs water and nutrients selectively.
Replacement of the evapotranspired volume with brackish water increased ECsol in all treatments, except T1, in which both rates led to reduction in ECsol along the cycle (Figures 1A and B).
Such small reduction in ECsol observed in T1 occurred because the evapotranspired volume was replaced by public-supply water (0.2 dS m-1) and, as plants absorbed the nutrients required for development, there was a reduction in salinity and, consequently, in the electrical conductivity of the solution.
These results corroborate with those found by Soares et al. (2010, 2013, 2015) and Lira et al. (2015), who also found decreasing trend for ECsol, using public-supply water to replace the evapotranspired volume.
Nutrient solution pH values (Figures 1C and D), regardless of its application rate, remained within the range in which most nutrients are adequately supplied to plants because, according to Furlani (1999), pH variations in the range from 4.5 to 7.5 do not affect plant development in hydroponic systems. However, in situations with pH lower than 4.0, damages occur in cell membranes. On the other hand, situations of alkalinity with pH above 8.0 can cause deficiency of nutrients.
V Lf Li D
n t
ETc =
−
(
)
π
2 5
4
10
∆
where:
VETc - evapotranspired volume, in m3 plant-1 day-1; Lf - final reading of water level in the automatic supply system, m;
Li - initial reading of water level in the automatic supply system, m;
D - internal diameter of the automatic supply system, m; ΔT - time interval between readings, days; and,
n - number of plants in the profile within the time interval ΔT.
The evaluated data were subjected to analysis of variance by F test and, when significant effects were observed, to regression analysis.
Results and Discussion
Figure 1A and B presents the values of electrical conductivity (ECsol) and pH of the nutrient solution along the entire crop cycle as a function of the salinity levels of the brackish water used to prepare the nutrient solution and its application rates (1.5 and 2.5 L min-1).
Regardless of the nutrient solution application rate, ECsol tended to increase along the cycle from the treatment T2
Figure 1. Mean values of electrical conductivity of the nutrient solution (ECsol) and its pH along the crop cycle, for
application rates of 1.5 L min-1 (A and C, respectively) and 2.5 L min-1 (B and D, respectively)
C. D.
A. B.
(1)
0.0 2.0 4.0 6.0 8.0 10.0
0 5 11 17 23 29 35 41 47
ECsol (dS m
-1)
DAT V1(1.5 L min-1)
T1 T2 T3 T4 T5 T6
5.0 5.5 6.0 6.5 7.0
0 5 11 17 23 29 35 41 47
pH
DAT V1(1,5 L min-1)
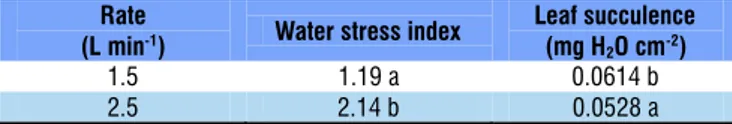
Water salinity (ECw) and nutrient solution application rates had individual effects on all variables studied (Table 1). The interaction between factors caused significant effect on water potential (ψw), osmotic potential (ψo) and total water consumption (TWC).
At the highest salinity level of the water used to prepare the nutrient solution (5.5 dS m-1), WSI was equal to 2.43 (Figure 2A). However, at the lowest salinity level (0.2 dS m-1), this index was only 0.84 (Figure 2A).
Regarding the rates used in nutrient solution application, the value obtained for WSI at rate of 2.5 L min-1 was significantly higher than that obtained at 1.5 L min-1 (Table 2).
These results demonstrate that, when plants were subjected to the highest salinity level, their transpiration was possibly reduced due to stomatal closure, which led to higher leaf temperature and consequently higher water stress indices.
Katerji et al. (2000), evaluating WSI in various agricultural crops, also found increments of this index due to the increase in the salinity levels of the waters used in irrigation.
The increase in the salinity levels of the water used to prepare the nutrient solution reduced leaf succulence (LS) (Figure 2B); LS was equal to 0.0413 mg H2O cm-2 at the highest salinity level (5.5 dS m-1) and to 0.0742 mg H
2O cm
-2
at the lowest salinity level (0.2 dS m-1). For nutrient solution application rates, the obtained values were statistically different and the rate of 1.5 L min-1 led to highest LS, 0.0614 mg H
2O cm
-2
(Table 2).
This observation of reduction in LS is probably due to the greater difficulty in water absorption by the roots of cauliflower plants under saline stress, which resulted in lower water content in the leaf tissues, evidencing lower capacity for osmotic adjustment of the plants when subjected to such condition. These results agree with those found by other authors (Zekri, 1991; Trindade et al., 2006; Sousa et al., 2010), who demonstrated that this parameter has a common response in leaves of plants subjected to NaCl-induced stress, but it is more common in dicotyledonous species.
Although the crop was not the same as in the present study, Sousa et al. (2010) evaluated sorghum under saline stress and found reduction in LS with the increment in salinity levels, evidencing the importance of this parameter to evaluate different agricultural crops subjected to saline stress.
At both rates of the nutrient solution, the increase of salinity in the water used to prepare the solution linearly reduced ψw (Figure 3A) and ψo (Figure 3B) in the cauliflower crop, but the greatest reductions were observed at rate of 2.5 L min-1.
At the rates of 1.5 and 2.5 L min-1, the unit increment of ECw reduced the ψw of cauliflower plants by 24.36 and 31.14%, respectively (Figure 3A). For ψo (Figure 3B), these reductions were approximately 12.27 and 23.70%, respectively, for the rates of 1.5 and 2.5 L min-1.
These reductions of ψw and ψo due to the increase in water salinity levels, for both rates evaluated, reflect the accumulation of solute ions in leaf tissue cells, especially Na and Cl, which were used in the salinization of the waters used to prepare the nutrient solution.
In addition, the reduction in ψw with the increase in ECsol was possibly followed by the reduction in crop transpiration, evidenced by the higher values of leaf temperature at the highest salinity levels and also by the higher water stress indices found at these highest salinity levels (Figure 2A). According to Silva et al. (2016), leaf ψw is effectively reduced by salinity. Such reduction leads to loss of turgor, inducing stomatal closure and, consequently, reduction in crop transpiration (Pincelli, 2010).
The results found in the present study for water and osmotic potentials in the leaves corroborate those obtained by Giuffrida
Figure 2. Water stress index (WSI) (A) and leaf succulence (LS) (B) in cauliflower, as a function of the salinity levels of the water used to prepare the nutrient solution (ECw)
A.
B.
*, ** Significant at 0.05 and 0.01 probability levels, respectively; ns - Not significant
SV F test
WSI LS ψw ψo TWC
ECw ** ** ** ** **
Rate ** ** ** ** **
ECw x Rate ns ns ** ** **
CV (%) 16.07 10.03 6.76 4.32 13.69
Table 1. Summary of F test for water stress index (WSI), leaf succulence (LS), water potential (ψw), osmotic potential (ψo) and total water consumption (TWC) of cauliflower cv. ‘Piracicaba Precoce’
Means followed by the same letters in the columns do not differ by Tukey test at 0.05 probability level
Rate
(L min-1) Water stress index
Leaf succulence
(mg H2O cm-2)
1.5 1.19 a 0.0614 b
2.5 2.14 b 0.0528 a
Table 2. Mean values for water stress index (WSI) and leaf succulence (LS), as a function of nutrient solution application rates
WSI
LS (mg H
2
O cm
et al. (2016). These authors evaluated the effects of saline stress on cauliflower and found reduction of these potentials as salinity increased in the waters used for irrigation. Likewise, Oliveira et al. (2016) evaluated the effect of different levels of water salinity on cowpea plants and observed reductions in these potentials as the electrical conductivity increased in the waters evaluated.
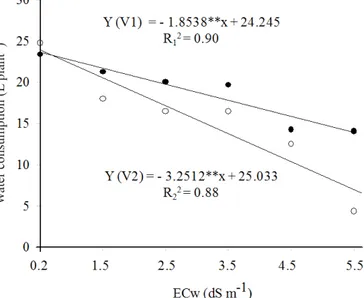
The increase of salinity in the water used to prepare the nutrient solution caused a decreasing linear effect on the total water consumption of the crop at both rates evaluated, but the lowest values were found at the rate of 2.5 L min-1 (Figure 4). At rate of 1.5 L min-1 and highest salinity level (5.5 dS m-1), total water consumption was equal to 14.0 L per plant. However, at the rate of 2.5 L min-1, for the same salinity level (5.5 dS m-1), the consumption decreased to 7.15 L per plant. In addition, at the lowest salinity level (0.2 dS m-1) and at rates of 1.5 and 2.5 L min-1, total water consumption was equal to 23.9 and 24.4 L per plant, respectively.
According to Paulus et al. (2012), salts when at high concentrations in the environment can hinder plant development for reducing the osmotic potential of the solution, which is associated with the water stress through the difficulty to absorb water from the environment, causing modification in crop water
consumption. In the present study, the osmotic effect of the salts in the water used to prepare the nutrient solution possibly reduced water availability to the crop, increasing water stress and, consequently, decreasing transpiration, which reduced the water consumption of the plants.
Reductions of water consumption in plants cultivated hydroponically with brackish water have also been found by Soares et al. (2010) and Paulus et al. (2012) in lettuce, and by Lira et al. (2015) in Chinese cabbage.
The lowest values of leaf succulence (LS), water potential (ψw), osmotic potential (ψo) and total water consumption (TWC) and highest values of water stress index (WSI) observed in plants subjected to rate of 2.5 L min-1 were possibly due to the greater availability of NaCl, caused by the mass flow in the rhizosphere of the crop. This fact may have led to higher absorption of this salt by plants and, as a consequence, caused reductions in LS, ψw, ψo and TWC and increase in WSI.
Conclusions
1. The increment of salinity in the water used to prepare the nutrient solution increased water stress index and reduced leaf succulence.
2. Increasing water salinity reduced water and osmotic potentials in the leaves and total water consumption of the crop, but the effects were more pronounced at the application rate of 2.5 L min-1.
3. Nutrient solution application rate of 2.5 L min-1 led to the highest water stress index and lowest leaf succulence.
Literature Cited
Benincasa, M. M. P. Análise de crescimento de plantas. Noções Básicas. 1.ed. Jaboticabal: FUNEP, 2003. 42p.
Furlani, P. R. Instruções para o cultivo de hortaliças de folhas pela técnica de hidroponia NFT. 1.ed. Campinas: Instituto Agronômico de Campinas, 1998. 30p. Boletim Técnico, 168
Figure 3.Water potential (A) and osmotic potential (B) of
cauliflower as a function of salinity levels of the water used to prepare the nutrient solution (ECw) and its application
rates (R1 = 1.5 L min-1 and R2 = 2.5 L min-1)
A.
B. Figure 4. Total water consumption of cauliflower as a
function of salinity levels of the water used to prepare the nutrient solution (ECw) and its application rates (R1 = 1.5
L min -1 and R2 = 2.5 L min-1)
W
ater consumption (L
plant
-1)
W
ater potential (MPa)
Furlani, P. R. Hydroponic vegetable production in Brazil. Acta Horticulturae, v.2, p.777-778, 1999. https://doi.org/10.17660/ ActaHortic.1999.481.98
Giuffrida, F.; Cassaniti, C.; Malvuccio, A.; Leonardi, C.Effects of salt stress imposed during two growth phases on cauliflower production and quality. Journal of the Science of Food and Agriculture, v.97, p.1552-1560, 2016. https://doi.org/10.1002/ jsfa.7900
Idso, S. B.; Jackson, R. D.; Reginato, R. J. Remote-sensing of crop yields. Science, v.196, p.19-25, 1977. https://doi.org/10.1126/ science.196.4285.19
Katerji, N.; Hoorn, J. W. van; Hamdy, A.; Mastrorilli, M. Salt tolerance classification of crops according to soil salinity and to water stress day index. Agricultural Water Management, v.43, p.99-109, 2000. https://doi.org/10.1016/S0378-3774(99)00048-7
Lira, R. M. de; Silva, Ê. F. de F. e; Silva, G. F. da; Santos, A. N. dos; Rolim, M. M. Production, water consumption and nutriente contente of chinese cabbage grown hydroponiacally in brackish water. Revista Ciência Agronômica, v.46, p.497-505, 2015. Niu, G.; Cabrera, R. I. Growth and physiological responses of
landscape plants to saline water irrigation: A review. Hortscience, v.45, p.1065-1609, 2010.
Oliveira, W. J. de; Souza, E. R. de; Almeida, B. G. de; Silva, Ê. F. de F. e; Melo, H. F. de; Leal, L. Y. C. Soil water energetic status and cowpea beans irrigated with saline water. Revista Brasileira de Engenharia Agrícola e Ambiental, v.20, p.685-691, 2016. https:// doi.org/10.1590/1807-1929/agriambi.v20n8p685-691
Paulus, D.; Dourado Neto, D.; Frizzone, J. A.; Soares, T. M. Produção e indicadores fisiológicos de alface sob hidroponia com água salina. Horticultura Brasileira, v.28, p.29-35, 2010. https://doi. org/10.1590/S0102-05362010000100006
Paulus, D.; Paulus, E.; Nava, G. A.; Moura, C. A. Crescimento, consumo hídrico e composição mineral de alface cultivada em hidroponia com águas salinas. Revista Ceres, v.59, p.110-117, 2012. https://doi.org/10.1590/S0034-737X2012000100016 Pereira, A. R.; Machado, E. C. Análise quantitativa do crescimento
de comunidades vegetais. Campinas: Instituto Agronômico de Campinas, 1987. 33p. Boletim, 114
Pincelli, R. P. Tolerância à deficiência hídrica em cultivares de cana-de-açúcar avaliada por meio de variáveis morfofisiológicas. Botucatu: UNESP, 2010. 65p. Dissertação Mestrado
Richards, L. A. Diagnosis and improvement of saline and alkali soils. Washington: U.S. Department of Agriculture, 1954. 160p.
Santos, A. N.; Soares, T. M.; Silva, Ê. F. de F. e; Silva, D. J. R.; Montenegro, A. A. A. Cultivo hidropônico de alface com água salobra subterrânea e rejeito da dessalinização em Ibimirim, PE. Revista Brasileira de Engenharia Agrícola e Ambiental, v.14, p.961-969, 2010. https://doi.org/10.1590/S1415-43662010000900008 Schollander, P. F.; Bradstreet, E. D.; Hemmingsen, E. A.; Hamell, H.
T. Sap pressure in vascular plants: Negative hydrostatic pressure can be measured in plants. Science, v.148, p.339-346, 1965. https:// doi.org/10.1126/science.148.3668.339
Silva, A. R. A. da; Bezerra, F. M. L. B.; Lacerda, C. F. de; Sousa, C. H. C.; Chagas, K. L. Pigmentos fotossintéticos e potencial hídrico foliar em plantas jovens de coqueiro sob estresses hídrico e salino. Revista Agro@mbiente On-line, v.10, p.317-325, 2016.
Soares, H. R. e; Silva, Ê. F. de F. e; Silva, G. F. da; Lira, R. M. de; Bezerra, R. R. Mineral nutrition of crisphead lettuce grown in a hydroponic system with brackish water. Revista Caatinga, v.29, p.656-664, 2016. https://doi.org/10.1590/1983-21252016v29n316rc Soares, H. R. e; Silva, Ê. F. de F. e; Silva, G. F. da; Pedrosa, E. M. R.;
Rolim, M. M.; Santos, A. N. Lettuce growth and water consumption in NFT hydroponic system using brackish water. Revista Brasileira de Engenharia Agrícola e Ambiental,v.19, p.636-642, 2015. https:// doi.org/10.1590/1807-1929/agriambi.v19n7p636-642
Soares, T. M.; Almeida, C. D. G. C.; Frizzone, J. A.; Silva, Ê. F. de F. e; Duarte, S. N. Economic risk analysis of tomato irrigation using desalinated water by reverse osmosis. Irrigation and Drainage, v.62, p.658-665, 2013. https://doi.org/10.1002/ird.1764
Soares, T. M.; Duarte, S. N.; Silva, Ê. F. de F. e; Jorge, C. A. Combinação de águas doce e salobra para a produção de alface hidropônica. Revista Brasileira de Engenharia Agrícola e Ambiental, v.14, p.705-714, 2010. https://doi.org/10.1590/S1415-43662010000700004 Sousa, C. H. C. de; Lacerda, C. F. de; Bezerra, F. M. L.; Gomes Filho,
E.; Gheyi, H. R.; Sousa, A. E. C.; Sousa, G. G. de. Respostas morfofisiológicas de plantas de sorgo, feijão-de-corda e algodão sob estresse salino. Agropecuária Técnica, v.31, p.29-36, 2010. Trindade, A. R.; Lacerda, C. F. de; Gomes Filho, E.; Prisco, J. T.;
Bezerra, M. A. Influência do acúmulo e distribuição de íons sobre a aclimatação de plantas de sorgo e feijão-de-corda, ao estresse salino. Revista Brasileira de Engenharia Agrícola e Ambiental, v.10, p.804-810, 2006. https://doi.org/10.1590/ S1415-43662006000400004