Development and evaluation of a remotely controlled and monitored
self-propelled sprayer in tomato crops
1Desenvolvimento e avaliação de um pulverizador autopropelido controlado e
monitorado remotamente em lavouras de tomate
Édilus de Carvalho Castro Penido2*, Mauri Martins Teixeira3, Haroldo Carlos Fernandes3, Paulo Barros Monteiro4 and Paulo Roberto Cecon3
ABSTRACT - The tomato is one of the main crops in Brazil. In large-scale cultivation, pesticides are applied to the plant to prevent the direct or indirect action of animal or vegetable life, aiming at higher productivity and better quality fruit. However, the products, if used incorrectly, may affect the health of workers involved in the activity. A prototype of a self-propelled sprayer, remotely controlled and monitored via radio signals, was therefore developed to be used in tomato crops, thus minimising worker contact with the chemical substances used when spraying. The basic prototype comprises an agricultural mini-tractor, a motorised pneumatic sprayer (atomiser) and a set of electronic and mechanical sensors and actuators, which allow the assembly to be controlled remotely and images captured by a video camera to be viewed on a tablet. After development, the principal dimension, weight and operational characteristics of the prototype were identified; the prototype was also used for spraying ten tomato plants in the crop, with seven different points being observed for each plant. The results were analysed statistically, giving the following coefficients of variation: 15.13% for spray coverage, 18.70% for droplet density and 16.68% for product deposition on the folioles. Based on these values, it was concluded that the development of a remotely controlled and monitored self-propelled sprayer prototype, and its use in spraying tomato crops, were viable.
Key words: Self-propelled agricultural machinery. Teleoperation of tractors. Spraying technology. Spraying tomato crops. Spraying evaluation.
RESUMO - O tomateiro é uma das principais culturas no Brasil. No seu cultivo em larga escala, são aplicados agrotóxicos sobre a planta para impedir a ação direta ou indireta de formas de vida animal ou vegetal, visando uma maior produtividade e qualidade do fruto. Os produtos utilizados podem, no entanto, afetar a saúde dos trabalhadores envolvidos na atividade caso sejam usados incorretamente. Sendo assim, foi desenvolvido um protótipo de pulverizador autopropelido controlado e monitorado à distância, via sinais de rádio, para ser utilizado em lavouras de tomate, minimizando com isso o contato dos trabalhadores com as substâncias químicas utilizadas na tarefa de pulverização. Esse protótipo é formado basicamente por um mini-trator agrícola, por um pulverizador pneumático motorizado (atomizador) e por um conjunto de sensores e atuadores eletrônicos e mecânicos, que permitem o comando remoto do conjunto e a visualização das imagens captadas por uma câmera de vídeo em um tablet. Após o desenvolvimento, as principais caraterísticas dimensionais, ponderais e operacionais do protótipo foram levantadas e ele também foi utilizado para pulverizar dez plantas numa lavoura de tomate, sendo observados sete pontos distintos em cada uma delas. Os resultados foram analisados estatisticamente, obtendo-se os seguintes coeficientes de variação: 15,13% na cobertura da pulverização, 18,70% na densidade de gotas e 16,68% na deposição de produto nos folíolos. Com base nesses valores, concluiu-se pela viabilidade do desenvolvimento de um protótipo de pulverizador autopropelido controlado e monitorado remotamente e a sua utilização na pulverização de lavouras de tomate.
Palavras-chave: Máquinas agrícolas autopropelidas. Tele-operação de tratores. Tecnologia de pulverização. Pulverização em lavouras de tomate. Avaliação da pulverização.
DOI: 10.5935/1806-6690.20190002 *Author for correspondence
Received for publication in 12/12/2016; approved in 22/02/2018
1Parte da Tese do primeiro autor apresentada no Programa de Pós-Graduação em Engenharia Agrícola DEA/UFV
2Instituto Federal de Educação, Ciência e Tecnologia de Minas Gerais/IFMG,Campus Ouro Branco, R. Afonso Sardinha, 90, Ouro Branco-MG, Brasil,
36.420-000, [email protected]
Rev. Ciênc. Agron., v. 50, n. 1, p. 8-17, jan-mar, 2019 9
INTRODUCTION
The tomato (Lycopersicon esculentum Mill.)
is one of the main crops in Brazil due to its high added socioeconomic value. According to IBGE data (2016), 62,096 hectares of tomato were planted throughout the country during 2015, with a production of 4,145,553 tons and an average yield of 66,810 kg per hectare.
Like many other commercial crops, the tomato and its fruit are subject to attack by various harmful diseases and pests (insects, bacteria, fungi, weeds, etc). To minimise the consequences of this exposure, pesticides are applied to the plant to guarantee greater productivity with a satisfactory degree of quality.
Due to the dynamics of the pesticide-spraying process, workers may be exposed to agrochemicals during their application. In this connection, Sankohet al. (2016)
reported several cases of nausea, respiratory disorders and vision problems in workers who carried out agrochemical applications in Sierra Leone, while Latorracaet al. (2008)
consider that pesticide residue in the human body can cause “from a slight loss of balance, nausea and vertigo, to neurological changes, tremors and hepatomegaly, among others”.
One way of minimising worker contact with pesticides during application is the use of tractors and other agricultural machinery that are not driven locally or directly by human operators.
The research conducted by Ball et al. (2015) for
example, involved the development of a management system that coordinates the activities of small robot tractors via radio signals for spraying weed herbicides over large areas.
The interaction between several vehicles acting together is the focus of a research project by RHEA (Robotics and associated High-technologies and Equipment for Agriculture), conducted by 15 entities and foundations from 8 different countries in Europe (CONESA-MUÑOZ et al., 2015;
GONZALEZ-DE-SOTO et al., 2015; PÉREZ-RUIZet al., 2015; ROMEO et al, 2013; VIERIet al, 2013).
More recently, the work of Zhang, Noguchi and Yang (2016) analysed the development of a control system for two tractors with no operators (one leading and the other the slave) capable of automatically guiding them to work in the field, where each of the robot tractors is independent and could be used alone for other agricultural tasks.
Despite a lot of research in the area of autonomous tractors, Murakamiet al. (2008) consider that the
large-scale commercialisation of this type of solution is still
a long way off due to the costs involved. For them, the development of remotely operated vehicles is interesting since it involves less investment but still has people supervising the activity, as it is “an immense challenge to design systems capable of handling unpredictable situations”.
More recently, Gomez-Gilet al. (2011) developed
a control system capable of capturing the electromagnetic brain waves of an operator by means of an electronic device worn on the head, and using them to guide an agricultural tractor in field activities.
In the system proposed by Adamides et al.
(2014), images captured by cameras are combined with computational elements, producing the effect of augmented reality. Thus, an operator using suitable glasses and a controller could remotely control a self-propelled sprayer in field activities. According to the authors, the results demonstrated a lower number of collisions compared to situations where there were no augmented-reality resources.
MATERIAL AND METHODS
The development and testing of the self-propelled sprayer prototype was carried out at the Mechanisation Laboratory of the Department of Agricultural Engineering and at the Olericulture Laboratory (Horta Velha), both on the Viçosa Campus of the Federal University of Viçosa (UFV), in the State of Minas Gerais, Brazil.
The prototype was based on an agricultural mini-tractor, modified to be remotely operated and observed by one person through an electronic/mechanical wireless control system, whose operation is based on the transmission and reception of radio signals. This system is also capable of controlling the jet of a motorised pneumatic sprayer, also called an “atomiser”, which was coupled to the mini tractor.
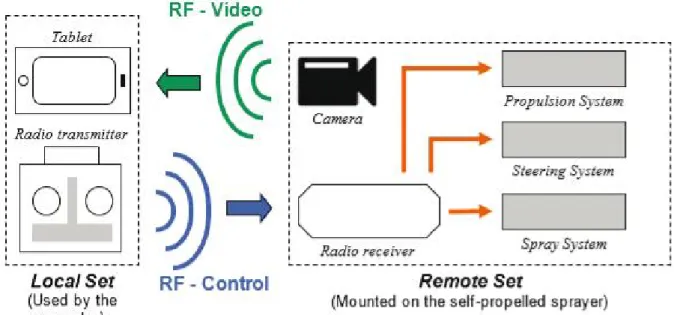
With a view to better organising the various parts according to the functions they perform, the equipment and devices comprising the control system were grouped into two sets, called the Local Set and the Remote Set
(Figure 1), each with the following main characteristics: I - Local Set: Used by the operator to remotely control the self-propelled sprayer and display the images captured by the installed video camera.
as sending that set images captured by the video camera. It basically consists of four systems: propulsion, steering, spray control and monitoring (Figure 2).
The propulsion system consists of a 12 V/60 Ah automotive battery, a commercial 12 Vdc to 127 Vac electronic inverter, and a 127 V brushed electric motor, which is switched on or off by radio control via a drive
module with internal protection against reverse voltage spikes.
The steering system consists of a commercial drive module and a 12 V electric motor with a mechanical reduction system, whose position is adjusted from the width of the radio control pulses and the feedback from the rotation angle provided by a potentiometer
Figure 1 -RF signals between theLocal Set and theRemote Set
Rev. Ciênc. Agron., v. 50, n. 1, p. 8-17, jan-mar, 2019 11 mechanically coupled to the flywheel of the
mini-tractor.
The spray-control system consists of a solenoid valve with a 12 V solenoid, which is switched on or off by radio control. Its function is to allow or block the flow of solution stored in the tank to the outlet of the atomiser.
The monitoring system consists of a video camera with WiFi communication, which transmits the captured images directly to the tablet via a point-to-point local network.
According to Mialhe (1996), the basic linear dimensions of an agricultural machine fit into the so-called “constructive constants” and their determination is important to individualise the equipment being analysed.
From the dimensions of the prototype (length, width and height), it was possible to determine its typical shape relationships or geometric configurations (area occupied by the machine when stationary, frontal area, occupied volume, width index, height index and shape index). These factors are relevant to the size of the location for housing the machine when it is temporarily out of service (MOLINet al., 2002).
In addition to this dimensional characterisation, a weight characterisation was also carried out, related to measuring the total weight of the prototype, to its weight distribution, and to determining the position of its centre of gravity (MIALHE, 1996).
Based on the method of double weighing proposed by Chudakov (1977), the coordinates of the centre of gravity (CG) of the prototype were determined, considering it as a rigid body with four points of support on the ground.
Using the measuring methodologies proposed by Mialhe (1996), the following operating parameters were determined: turning radius (radius of the smallest circumference measured along the support plane, tangentially described by the longitudinal median plane of the outermost wheel); turning space (diameter of the smallest circumference measured along the support plane, described by the projection of the outermost point of the tractor); and limiting angles of static stability (conditions of the support plane that allow the stable operation of an agricultural machine, without overloading the wheel-sets and with no risk of tipping).
For the safety of people close to the prototype and for equipment integrity, it was considered that the operational limiting angles for use in the field should be equal to 50% of the respective static limiting angles.
The displacement speed of the self-propelled sprayer in first and second gear was determined by measuring the time it took to travel a known distance.
From this value, the theoretical working capacity (TWC) was determined.
To evaluate the spraying itself, the prototype was used on a tomato crop, and the tree row volume (TRV) was calculated using Equation 1:
TRV = 10000 h W / d (1)
where:
TRV = Tree row volume (m3 ha-1);
h = Height of the vegetation (m); W = Width of the vegetation (m); and, d = Distance between rows (m).
From the tree row volume and the recommended volumetric index for different spray volumes (Table 1), the spray volume per area was determined using Equation 2:
QA = TRV VI / 1000 (2)
where:
Spray volume per area (L ha-1);
TRV = Tree row volume (m3 ha-1); and,
VI = Volume index (mL m-3).
The flow rate of the solution needed to produce this spray volume was then determined using Equation 3:
qr = QA v f / 600 (3)
where:
qT = Solution flow rate (L min-1);
QA = Spray volume per area (L ha-1);
v = Prototype displacement speed (km h-1); and,
f = Spray width (m).
Table 1 - Recommended volumetric indices for different spray volumes (VIRGINIA AND WEST VIRGINIA COOPERATIVE EXTENSION SERVICES, 1989)
Spray Volume Volume Index (mL m-3)
Very High 120
High 100
Medium 70
Low 50
Very Low 30
Table 2 - Droplet density for type of plant health product (PENTAIR, 2016)
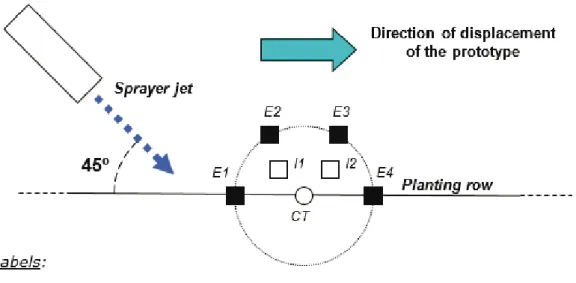
Figure 3 - Regions of label placement in tomato plants The number of droplets per area provided by the spray is a function of the type of product applied, as shown in Table 2. To check the number of droplets per area and plant coverage (%), seven water-sensitive paper labels were fixed to each tomato plant (Figure 3). These labels are impregnated with the blue dye, bromophenol, which in its non-ionised form displays a yellow colouration, but which acquires a blue colouration when ionised by contact with water.
After spraying, the labels were carefully removed and suitably packed to avoid moisture absorption; they were then duly identified and taken for later analysis with the Image Tool software.
With the images from the labels, the droplet coverage (%) and density per area were determined. The results were then analysed based on Descriptive Statistics to determine measurements of position (Arithmetic Mean, Mode and Median) and dispersion (Variance, Standard Deviation and Coefficient of Variation). As the variables analysed in the experiment are continuous, Pearson’s formula was used to determine the Mode for the observations.
From the arithmetic mean, the standard deviation and the number of observations, it was also possible to construct a Confidence Interval (CI) for the number of droplets per area and check whether the result would fit within the ranges shown in Table 2.
Product deposition on the plant was evaluated using a marker (food colouring), as per the method
Type of Product Density (No of droplets percm²)
Insecticide 20 - 30
Herbicide (pre-emergent) 20 - 30
Herbicide (foliar contact) 30 - 40
Fungicide 50 - 70
proposed by Palladini, Raetano and Velini (2005). After spraying the solution (water + dye), foliole samples were collected from each tomato plant from the regions shown in Figure 3.
They were then packed in plastic bags and duly identified; the water used for washing was analysed in a model SP-1105 spectrophotometer adjusted for absorbance readings at a wavelength of 630 nm, following the methodology suggested by Quirino (2010).
To determine the concentration of the dye deposited on the folioles, a linear standard curve was prepared using the same solution applied when spraying the crop (VIGANO; RAETANO, 2007). From this concentration, and the foliole area measured with a CI-202 leaf area meter, the deposition per area was determined according to Equation 4:
Rev. Ciênc. Agron., v. 50, n. 1, p. 8-17, jan-mar, 2019 13 where:
DA = Deposition per area (μg cm-2);
Ca = Wash solution concentration (mg mL-1);
Va = Wash solution volume (mL); and, Al = Leaf area (cm²).
The linear correlation coefficients between pairs of variables evaluated in the field experiment and obtained from the labels (droplet coverage and density per area), and from spraying the solution containing food colouring (deposition), were also determined.
The droplet spectra produced by the motorised pneumatic sprayer were evaluated in the laboratory using a Spraytech laser particle analyser from Malvern Instruments, with a focal length of 750 mm.
Three repetitions were carried out, with the outlet nozzle positioned 0.5 m from the laser beam, and the analyser calibrated to count droplets with a diameter in the range of 0.1 to 2,500 μm.
From analysis of the data supplied by the equipment, the volumetric median diameter (VMD) and numeric median diameter (NMD) were determined; the coefficient of homogeneity (CH) was calculated by dividing the two values (VMD/NMD).
The relative amplitude (SPAN) was determined with Equation 5:
SPAN = (D0,9 - D0,1) / D0,5 (5)
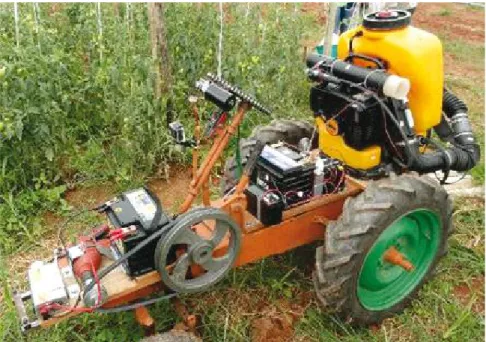
Figure 4 - Prototype of the self-propelled sprayer
where:
SPAN = Relative amplitude (dimensionless);
D0.9 = Droplet diameter, below which 90% of the total volume is contained (μm);
D0.1 = Droplet diameter, below which 10% of the total volume is contained (μm); and,
D0.5 = Volumetric median diameter (μm).
RESULTS AND DISCUSSION
The prototype of the self-propelled sprayer, after its completion, is shown in Figure 4. The final external dimensions, geometric configurations and indices of width, height and shape are shown in Table 3. The weight characteristics of the prototype, considering the solution tank and gas tank to be completely full, are shown in Table 4.
After an elevation of 0.28 m, the support reaction at the front wheel-set was 45.6 kg. Therefore, considering an angle of elevation (β) equal to 16.6°, the calculated coordinates for the CG of the prototype are: x = 0.28 m (longitudinal axis); y = 0.52 m (vertical axis); z = 0.03 m (transverse axis). The results of the three repetitions, and the mean values calculated to determine the turning radius and turning space to the right and left, are shown in Table 5.
Characteristic Repetition Mean
1 2 3
Turning radius to the right (m) 2.08 2.06 2.06 2.07
Turning radius to the left (m) 2.09 2.10 2.09 2.09
Turning space to the right (m) 4.13 4.14 4.13 4.13
Turning space to the left (m) 4.29 4.30 4.28 4.29
Parameter Value Symbol
Total weight (kg) 212.5 WT
Support reaction on the front wheel-set (kg) 60.6 RF
Support reaction on the rear wheel-set (kg) 151.9 RB
Support reaction on the right-side wheel-set (kg) 97.7 RR
Support reaction on the left-side wheel-set (kg) 114.8 RL
Table 5 - Turning radius and turning space to the right and left of the prototype
Table 4 - Weight characteristics of the prototype
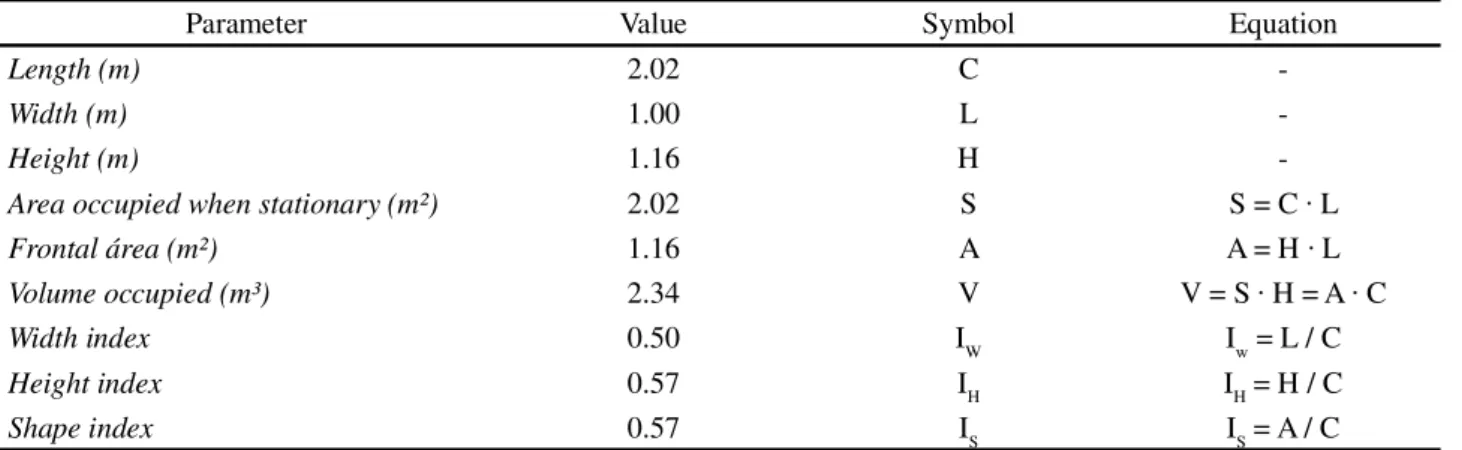
Table 3 - External dimensions, geometric configurations and indices of the prototype
Parameter Value Symbol Equation
Length (m) 2.02 C
-Width (m) 1.00 L
-Height (m) 1.16 H
-Area occupied when stationary (m²) 2.02 S S = C ∙ L
Frontal área (m²) 1.16 A A = H ∙ L
Volume occupied (m³) 2.34 V V = S ∙ H = A ∙ C
Width index 0.50 IW Iw = L / C
Height index 0.57 IH IH = H / C
Shape index 0.57 IS IS = A / C
and turning space (TSI) and the turning radius symmetry index (TRSI), with a result of 1.20% and 0.48% respectively. These values, according to Mialhe (1996), can be considered excellent, since the TSI was less than 3.00% and the TRSI was lower than 0.50%.
The limiting angles for the static and operational stability of the prototype, calculated from its dimensional and weight characteristics, are given in Table 6. To determine the speed of the prototype, three measurements were taken of the time required for it to travel a distance of thirty metres, initially in first gear and then in second gear; the results are shown in Table 7.
Based on the data in Table 7, it was determined that the speed in first gear is 1.94 km h-1 and in second gear,
3.18 km h-1. As this speed directly influences the volume
of solution applied per area for a given interval of time, an increase in value would also imply an increase in the working capacity of the equipment.
However, higher speeds tend to have a negative effect on the droplet spectrum and on the distribution homogeneity of the solution applied to the plant, thereby compromising the quality of the spray (CAVALIERIet al.,
2015).
Rev. Ciênc. Agron., v. 50, n. 1, p. 8-17, jan-mar, 2019 15
Parameter Condition
Upslope (α) Downslope (θ) Inclination (γ)
Static limiting angle 28.2° 53.4° 53.0°
Operational limiting angle 14.1° 26.7° 26.5°
Table 6 - Limiting angles for the static and operational stability of the prototype
Table 7 - Time for the prototype to travel a distance of 30 metres
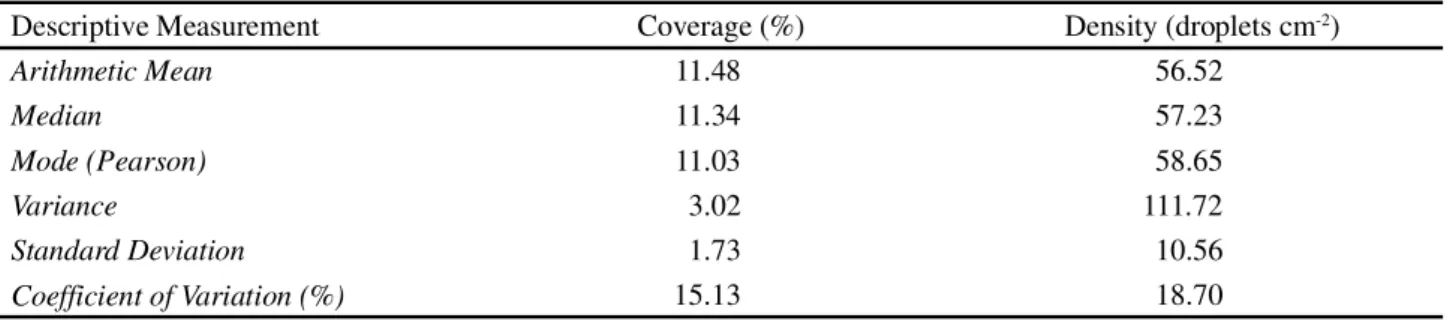
Table 8 - Descriptive measurements for the droplet coverage and density data
Descriptive Measurement Coverage (%) Density (droplets cm-2)
Arithmetic Mean 11.48 56.52
Median 11.34 57.23
Mode (Pearson) 11.03 58.65
Variance 3.02 111.72
Standard Deviation 1.73 10.56
Coefficient of Variation (%) 15.13 18.70
Condition Repetition Mean
1 2 3
Displacement in 1st gear (s) 55.03 56.06 55.80 55.63
Displacement in 2nd gear (s) 34.10 33.16 34.63 33.96
The characteristics of dimension, weight and manoeuvrability allowed the prototype of the self-propelled sprayer to be used in a field experiment in a tomato crop that used the Viçosa Spacing System (ALMEIDAet al., 2015), in which the planting rows are
two metres apart.
The tree row volume (TRV) of the crop was calculated considering a height of 0.4 m (1/3 of the total height of the plant), a width of 0.5 m and the distance between rows equal to 1.0 m (spraying on only one side of the planting area with each pass). The value found using Equation 1 was 2,000 m3 ha-1.
According to Courshee (1960), there is no relationship between the volume applied and the product residue on the plant. Since spraying with an atomiser in this type of application tends to be more efficient than with a hydraulic sprayer, because in the first case the droplets of solution are transported and in the second they are projected, a low volumetric index (50 mL m-3) was
chosen per volume of vegetation as per Table 1.
The spray volume per area (QA) found using Equation 2 was 100 L ha-1. The flow rate (q
T) at the outlet
of the atomiser, which would be needed to produce this volume, was then calculated for the prototype moving in first gear (1.94 km h-1). The value found with Equation 3
was 0.330 L min-1.
The atmospheric conditions at the time of spraying wereWind speed → v = 3.2 km h-1, Temperature → T =
26.8 °C, and Relative humidity → RH = 74%.
Measurements of position and dispersion for the data of droplet coverage and density, which were calculated by analysis of the water-sensitive paper labels using the Image Tool software, are shown in Table 8. As the arithmetic mean, median and mode of the two parameters under analysis resulted in similar values, the observations tend towards a symmetrical distribution and also tend to have good homogeneity, since their coefficients of variation are in the range of 10% to 20%.
Table 10 - Parameters for evaluating the spray
Table 9 - Descriptive measurements for the deposition data From the values in Table 8, it was possible to construct a confidence interval (CI) for droplet density at a confidence level of 95%, as shown below:
CI(µ)95% : 56.52 ± 6.55 droplets cm-2
The measurements of position and dispersion for the deposition data, calculated from analysis of the absorbance of the solutions used for washing the folioles, and measured with a spectrophotometer, are shown in Table 9. As happened with the results for droplet coverage and density, these values indicate a trend towards a symmetrical distribution of the observations, with good homogeneity (GARCIA, 1989).
Descriptive Measurement Deposition (µg cm-2)
Arithmetic Mean 8.18
Median 8.14
Mode (Pearson) 8.05
Variance 1.86
Standard Deviation 1.36
Coefficient of Variation (%) 16.68
The linear correlation coefficients between pairs of the variables evaluated in the field experiment are rCoverage,Density = 0.6536, rDensity, Deposition = 0.4577, and rDeposition,Coverage = 0.7987.
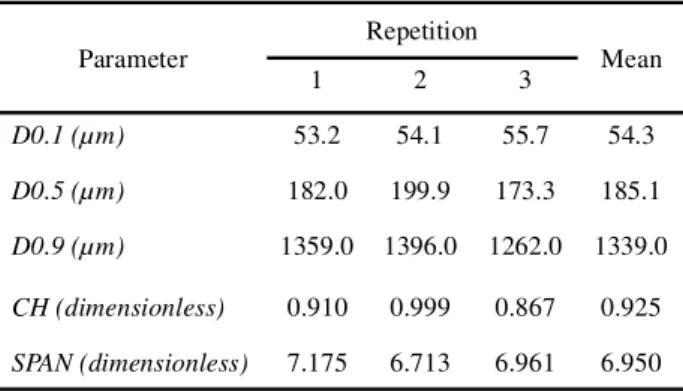
The coefficient of homogeneity (CH) and the relative amplitude (SPAN) of the droplet spectrum produced by the atomiser and identified by the laser particle analyser are shown in Table 10.
Parameter Repetition Mean
1 2 3
D0.1 (µm) 53.2 54.1 55.7 54.3
D0.5 (µm) 182.0 199.9 173.3 185.1
D0.9 (µm) 1359.0 1396.0 1262.0 1339.0
CH (dimensionless) 0.910 0.999 0.867 0.925
SPAN (dimensionless) 7.175 6.713 6.961 6.950
CONCLUSIONS
1. The external dimensions of the prototype self-propelled sprayer are 2.02 m (length). 1.00 m (width) and 1.16 m (height), with a total weight of 212.5 kg considering the solution tank and gas tank to be completely full; 2. The mean turning radius to the right and left of the
prototype was 2.07 m and 2.09 m respectively, with a turning radius symmetry index (TRSI) of 0.48%; 3. The mean turning space to the right and left was
4.13 m and 4.29 m respectively; the ratio index between the turning radius and turning space (TSI) was 1.20%;
4. Operational limits of the prototype were: 14.1° (upslope). 26.7° (downslope) and 26.5° (transversal slope); 5. The speed of the prototype is 1.94 km h-1 in first gear
and 3.18 km h-1 in second gear; its theoretical working
capacity (TWC) is 0.198 ha h-1 (in first gear);
6. The descriptive measurements for the coverage data (%) were arithmetic mean = 56.52, median = 57.23, mode (Pearson) = 58.65, variance = 3.02 and standard deviation = 1.73. The coefficient of variation for this data set was 15.13%;
7. The descriptive measurements for the density data (droplets cm-2) were arithmetic mean = 11.48, median =
11.34, mode (Pearson) = 11.03, variance = 111.72 and standard deviation = 10.56. The coefficient of variation for this data set was 18.70%;
8. The descriptive measurements for the deposition data
(μg cm-2) were arithmetic mean = 8.18, median = 8.14,
mode (Pearson) = 8.05, variance = 1.86 and standard deviation = 1.36. The coefficient of variation for this data set was 16.68%;
9. The confidence interval (CI) for droplet density at a confidence level of 95% was 56.52 ± 6.55 droplets cm-2;
10. The linear correlation coefficients between pairs of the variables evaluated in the field experiment of the self-propelled sprayer prototype were rCoverage,Density = 0.6536, rDensity,Deposition = 0.4577 and rDeposition,Coverage = 0.7987; 11. The coefficient of homogeneity (CH) and relative
amplitude (SPAN) obtained in the laboratory test with the laser particle analyser were 0.925 and 6.950 respectively.
REFERENCES
ADAMIDES, G.et al. A reality-based interaction interface for an
agricultural teleoperated robot sprayer.In: INTERNATIONAL
HIGH-Rev. Ciênc. Agron., v. 50, n. 1, p. 8-17, jan-mar, 2019 17 TECHNOLOGIES AND EQUIPMENT FOR AGRICULTURE
AND FORESTRY, 2., 2014, Madrid. Proceedings... Madrid, 2014.
ALMEIDA, V. S. et al. Sistema Viçosa para o cultivo de
tomateiro.Horticultura Brasileira, v. 33, n. 1, 2015.
BALL, D.et al. Robotics for sustainable broad-acre agriculture.
Springer Tracts in Advanced Robotics, v. 105, p. 439-453, 2015.
BERNARDES, A. M.et al. Espectrofotometria da deposição
de agrotóxico no dossel do tomateiro. Varia Scientia Agrárias, v. 4, n. 1, p. 93-104, 2014.
CAVALIERI, J. D.et al. Spraying systems and traveling speed in
the deposit and spectrum of droplets in cotton plant. Engenharia Agrícola, v. 35, n. 6, p. 1042-1052, 2015.
CHUDAKOV, D. A.Fundamentos de la teoria y el cálculo de tratores y automóveis. Moscou: Mir, 1977.
CONESA-MUÑOZ, J. et al. Integrating autonomous aerial
scouting with autonomous ground actuation to reduce chemical pollution on crop soil. Advances in Intelligent Systems and Computing, v. 418, p. 41-53, 2015.
COURSHEE, R. J. Some aspects of the application of insecticides.Annual Review of Entomology, v. 5, p. 327-352, 1960.
GARCIA, C. H.Tabelas para classificação do coeficiente de variação. Piracicaba: Instituto de Pesquisas e Estudos Florestais, 1989. (Circular Técnica, 171).
GOMEZ-GIL, J.et al. Steering a tractor by means of an
EMG-based human-machine interface.Sensors, v. 11, n. 7, p. 7110-7126, 2011.
GONZALEZ-DE-SOTO, M.et al. Reducing fuel consumption
in weed and pest control using robotic tractors.Computers and Electronics in Agriculture, v. 114, p. 96-113, 2015.
INSTITUTO BRASILEIRO DE GEOGRAFIA E ESTATÍSTICA. Dados da produção nacional de tomate.
Levantamento Sistemático da Produção Agrícola, v. 29, n. 5, p. 74-75, 2016.
LATORRACA, A.et al. Agrotóxicos utilizados na produção do
tomate em Goiânia e Goianápolis e efeitos na saúde humana.
Comunicação em Ciências da Saúde, v. 19, n. 4, p. 365-374, 2008.
MIALHE, L. G.Máquinas agrícolas: ensaios & certificações. Piracicaba: FEALQ, 1996.
MOLIN, J. P. et al. Ensaio de características dimensionais,
ponderais e de desempenho na barra de tração de um quadricíclo 4x4.Engenharia Agrícola, v. 22, p. 276-287, 2002.
MURAKAMI, N.et al. Development of a teleoperation system for agricultural vehicles. Computers and Electronics in Agriculture, v. 63, n. 1, p. 81-88, 2008.
PALLADINI, L. A.; RAETANO, C. G.; VELINI, E. Choice of tracers for the evaluation of spray deposits.Scientia Agricola, v. 62, n. 5, p. 440-445, 2005.
PENTAIR. Pentair Hypro Incorporation: site institucional. Disponível em: <http:// www.hypropumps.com/>. Acesso em: 01 set. 2016.
PÉREZ-RUIZ, M.et al. Highlights and preliminary results for autonomous crop protection. Computers and Electronics in Agriculture, v. 110, p. 150-161, 2015.
QUIRINO, A. L. S. Parâmetros técnicos para aplicação do Glyphosate visando o aumento da eficácia segurança ambiental e do aplicador. 2010. 75 f. Dissertação (Mestrado em Engenharia Agrícola) - Universidade Federal de Viçosa, Viçosa, MG, 2010.
ROMEO, J.et al. Camera sensor arrangement for crop/weed
detection accuracy in agronomic images.Sensors, v. 13, n. 4, p. 4348-4366, 2013.
SANKOH, A. I.et al. An assessment of the impacts of pesticide
use on the environment and health in Sierra Leone.Environment International, v. 94, p. 458-466, 2016.
VIERI, M. et al. The RHEA-project robot for tree crops pesticide application.Journal of Agricultural Engineering, v. 44, n. s1, p. 359-362, 2013.
VIGANO, L. L. S.; RAETANO, C. G. Assistência de ar e volumes de aplicação na deposição de calda e no controle do arroz vermelho (Oryza sativa L.).Engenharia Agrícola, v. 27, n. 3, p. 734-741, 2007.
VIRGINIA AND WEST VIRGINIA COOPERATIVE EXTENSION SERVICES.Spray bulletin for commercial tree fruit growers. Morgantown: West Virginia University, 1989. ZHANG, C.; NOGUCHI, N.; YANG, L. Leader–follower system using two robot tractors to improve work efficiency.Computers and Electronics in Agriculture, v. 121, p. 269-281, 2016.