INTRODUCTION
Glucagon-like peptide 2 (GLP-2) is a 33-aminoacid progluca-gon-derived hormone which is primarily released by the L-cells in the distal small bowel. It is secreted by means of proteolytic cleavage of proglucagon in response to the passage of nutrients through the distal small bowel, in a 1:1 ratio with glucagon-like peptide 1 (GLP-1) in a process mediated by enzymes proglucagon convertase 1/3(1-8). Although the properties of GLP-2 have not been completely elucidated to date, it presents several known physiologic functions, of which the main are the trophic effect on the gut mucosa and the enhancement of nutrient absorption(5-13). GLP-1 is mainly enrolled in glucose homeostasis, and its main effects are the increasing of pancreatic beta cell function and the improvement of insulin sensitivity(14,15). Both GLP-1 and GLP-2 are quickly degraded by the enzyme dipeptidil-peptidase-4 (DPP-IV), and after 60 minutes, about 69% of the original hormones remain intact. The research on gut-derived peptides has considerably in-creased over the last decades, especially due to the changes in their
Comparison of the levels of C-reactive protein,
GLP-1 and GLP-2 among individuals with diabetes,
morbid obesity and healthy controls:
an exploratory study
Everton
CAZZO
1, José Carlos
PAREJA
1, Elinton Adami
CHAIM
1, Cláudio Saddy Rodrigues
COY
1and
Daniéla Oliveira
MAGRO
1Received 5/8/2017 Accepted 6/9/2017
ABSTRACT – Background – The glucagon-like peptides 1 and 2 (GLP-1/GLP-2) are gut hormones that may directly affect the glucose homeostasis and
their activity seems to be significantly affected by chronic inflammation. Objective – To evaluate the postprandial levels of glucagon-like peptides 1
and 2 (GLP-1/GLP-2), C-reactive protein (CRP), and the postprandial glucose and insulin levels among individuals with obesity, type 2 diabetes, and healthy controls. Methods – An exploratory cross-sectional study, which involved individuals awaiting for bariatric/metabolic surgery and healthy controls. Postprandial levels of GLP-1, GLP-2, glucose, and insulin were obtained after a standard meal tolerance test. Inflammation was assessed by means of CRP. Results – There were 30 individuals enrolled in the study, divided into three groups: non-diabetic with morbid obesity (NDO; n=11
individuals), diabetic with mild obesity (T2D; n=12 individuals), and healthy controls (C; n=7 individuals). The mean CRP levels were significantly
higher in the NDO group (6.6±4.7 mg/dL) than in the T2D (3.3±2.2 mg/dL) and C groups (2.5±3.2 mg/dL) (P=0.038). The GLP-1 levels following
standard meal tolerance test and the area under the curve of GLP-1 did not differ among the three groups. The GLP-2 levels were significantly lower in the NDO and T2D than in the C group following standard meal tolerance test at all the times evaluated. The area under the curve of the GLP-2 was significantly lower in the NDO and T2D groups than in the C group (P=0.05 and P=0.01, respectively). Conclusion – GLP-2 levels were impaired in the individuals with obesity and diabetes. This mechanism seems to be enrolled in preventing the worsening of the glucose homeostasis in these individuals.
HEADINGS – Glucagon-like peptide 1. Glucagon-like peptide 2. Diabetes mellitus. Obesity. Insulin resistance. Incretins.
Declared conflict of interest of all authors: none
Disclosure of funding: This study was supported by grants from Fundação de Amparo à Pesquisa do Estado de São Paulo – FAPESP, protocol 2009/50430-6. Departamento de Cirurgia, Faculdade de Ciências Médicas, Universidade Estadual de Campinas (UNICAMP), Campinas, São Paulo, Brasil.
Correspondence: Everton Cazzo. Dept. de Cirurgia – UNICAMP. Rua Alexander Fleming, s/n. CEP: 13083-887 – Campinas, SP, Brasil. E-mail: [email protected]
release pattern and metabolic roles played after several bariatric surgical modalities(16-22).
A witty metaphor proposed by Hein et al.(23) claimed that GLP-1 and GLP-2 were “the yin and yang” of intestinal lipoprotein production, since GLP-1 significantly reduces and GLP-2 increases postprandial chylomicronemia. A likely assertion can be made in regards of glucose metabolism, since GLP-1 is enrolled in decreas-ing postprandial blood glucose levels by means of insulin release, whereas GLP-2 enhances glucose absorption and thus increases the postprandial glucose levels(9,10,12,13,15,24,25).
METHODS
This is an exploratory cross-sectional study, which enrolled individuals who attended the Obesity and Metabolic Syndrome service of a public tertiary university hospital. The inclusion criteria were: age between 18 and 65 years old; both genders; acceptance of the proposed study protocol. The exclusion criteria were: carriers of chronic inflammatory illnesses which could provoke changes in inflammation markers (autoimmune diseases, inflammatory bowel diseases, idiopathic inflammatory diseases), endocrine disorders other than T2D (Cushing’s disease, type 1 diabetes, Addison’s dis-ease), users of dipeptidil-peptidase-4 (DPP-IV) inhibitors, GLP-1 analogs, and anti-inflammatory medications; vulnerable groups (mentally ill, institutionalized or aged below 18 years old). The selected individuals were divided into three groups: non-diabetic individuals with morbid obesity; T2D individuals with mild obesity; and healthy controls. The non-diabetic individuals with obesity were recruited among candidates for bariatric surgery. The T2D group selected for study was comprised of individuals on chronic use of insulin with severe refractory T2D, candidates for metabolic surgery. The control group was comprised of healthy volunteers who worked or studied at the University.
This study underwent evaluation and was approved by the local Research Ethics Board. All individuals provided informed consent (UNICAMP – number: 801/2008).
The variables analyzed were: age, sex, body mass index (BMI), weight, presence of type 2 diabetes (T2D), homeostasis model assessment – insulin resistance (HOMA-IR), use of medications, glycosylated hemoglobin (A1c) and CRP levels. Postprandial lev-els of GLP-1, GLP-2, glucose, and insulin were obtained after a standard meal tolerance test (MTT).
CRP levels were determined in the fasting state using ELISA Kit (R&D Systems Inc., Minneapolis, MN). For glucose, insulin, GLP-1, and GLP-2 analysis, blood samples were collected in tubes with EDTA3 plus Sigma diprotin. Serum samples were stored in a freezer at -80°C for later analysis of GLP-1 and GLP-2 with specific ELISA kits (ELISA, Millipore – Billericc M.A).
HOMA was calculated by means of the formula of Mat-thews(26). T2D was defined according to the American Association of Clinical Endocrinology (AACE) criteria(27).
The standard MTT was designed as follows: after an overnight fast (12 hours), subjects underwent the standard MTT, based in a mixed meal containing 515 kcal (41.8% fat, 40.7% carbohydrates, and 17.5% protein). This test contained a protein bar and a 200 mL-liquid nutrition supplement. Blood samples were drawn for glucose, insulin, GLP-1, and GLP-2 at 0, 15, 30, 45, 60, 90, 120, 150, and 180 minutes.
Statistical analysis
The results were expressed as means ± standard deviation (mean ± SD).The areas under the curve (AUCs) of glucose, insulin, GLP-1, and GLP-2 were calculated by the trapezoidal rule. For the comparison of the results obtained in the different groups, analysis of variance (ANOVA) analysis was used. For more than two groups’ comparison, ANOVA analysis was used for parametric variables and Kruskal-Wallis for non-parametric variables. The significance level adopted was 5% (P-value <0.05).
Post hoc statistical power was calculated for the main results con-sidering a 20% alpha error. The software SSPS v.16.0 (Chicago, IL, USA) was used for the analysis.
Statement of human and animal rights
All procedures performed in studies involving human par-ticipants were in accordance with the ethical standards of the institutional and/or national research committee and with the 1964 Helsinki declaration and its later amendments or comparable ethical standards.
RESULTS
There were 30 individuals enrolled in the study, divided into three groups as proposed: non-diabetic with obesity (NDO; n=11 individuals), diabetic (T2D; n=12 individuals), and healthy controls (C; n=7 individuals). The T2D and C groups were significantly older than the NDO group (P=0.012), and the NDO and T2D groups presented significantly higher weight (P<0.001) and BMI (P<0.001)
than the C group. There was no difference in regard to gender in the three groups. The mean CRP levels were significantly higher in the NDO group (6.6±4.7 mg/dL) than in the T2D (3.3±2.2 mg/ dL) and C groups (2.5±3.2 mg/dL); (P=0.038). HOMA-IR was
signifi-cantly higher in the NDO and T2D groups (P=0.046). The levels
of glycosylated hemoglobin were significantly higher in the T2D group (P=0.0021). TABLE 1 summarizes the main demographic and anthropometric data, as well as the complete values for CRP and HOMA-IR.
The GLP-1 levels following standard MTT did not differ among the three groups at none of the evaluated times. TABLE 2 details
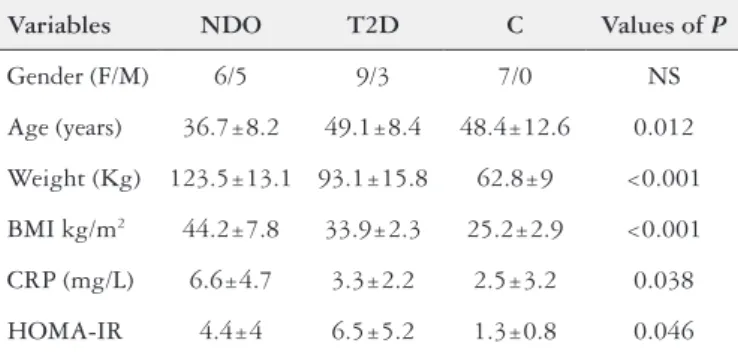
TABLE 1. Anthropometric, demographic and biochemical characteristics of the individuals evaluated
Variables NDO T2D C Values of P
Gender (F/M) 6/5 9/3 7/0 NS
Age (years) 36.7±8.2 49.1±8.4 48.4±12.6 0.012
Weight (Kg) 123.5±13.1 93.1±15.8 62.8±9 <0.001
BMI kg/m2 44.2±7.8 33.9±2.3 25.2±2.9 <0.001
CRP (mg/L) 6.6±4.7 3.3±2.2 2.5±3.2 0.038
HOMA-IR 4.4±4 6.5±5.2 1.3±0.8 0.046
BMI: body mass index; CRP: C-reactive protein; HOMA-IR: homeostasis model assess-ment; NDO: non-diabetic with obesity group; T2D: diabetic group; C: control group; NS: non-significant.
TABLE 2. Comparison of the GLP-1 levels following a standard MTT among the three groups studied
Time (minutes) NDO T2D C Values of P
0 3.7±0.5 6.4±9.9 4.4±2.2 NS
15 3.8±0.5 9±12.1 7.1±3.3 NS
30 4.2±0.7 8.7±8.9 6.5±3.3 NS
45 3.6±0.5 7.6±8.4 6±3.4 NS
60 3.9±0.7 7.3±5.8 5.8±2.7 NS 90 3.8±0.6 7.8±6.1 5.6±2.8 NS
120 4.0±0.6 7±4.5 5.8±2.8 NS
150 3.7±0.6 9.8±9.2 6.3±3.1 NS
180 4±0.7 8.3±10.5 6±2.8 NS
the GLP-1 levels at each time of the MTT curve. The AUCs of GLP-1 in the three groups also did not significantly differ among the three groups. The GLP-2 levels were significantly lower in the NDO and T2D than in the C group following standard MTT at all the times evaluated. TABLE 3 shows the GLP-2 levels at each time of the MTT curve. As expected, the AUC of the GLP-2 levels after MTT was significantly lower in the NDO and T2D groups than in the C group (P=0.05 and P=0.01, respectively). The AUCs of
GLP-1 and GLP-2 following MTT in the three groups are graphi-cally represented in FIGURE 1, along with the power analysis of both comparisons.
minutes. The AUC of insulin during the MTT was higher in the NDO group than in the T2D (P=0.005) and C groups (P=0.009).
TABLE 5 details the insulin levels at each time of the MTT curve.
FIGURE 2 presents a graphical representation of the AUCs of glucose and insulin after MTT in the three groups, along with the power analysis of both comparisons.
TABLE 3. Comparison of the GLP-2 levels following a standard MTT among the three groups studied
Time (minutes) NDO T2D C Values of P
0 5.3±3.4 4.8±1.6 8.6±5.4 NS
15 5.7±4.6 5.6±1.7 12.6±8.3 0.011 30 5.8±4.1 6±1.8 12.6±8.4 0.013 45 5.8±3.9 5.7±2.2 12.4±7.7 0.009 60 5.6±3.1 6±1.8 12.5±7.3 0.003 90 5.6±3.4 6.7±2.4 11.4±7.2 0.023 120 4.6±2.3 6.7±2.2 9.9±5.1 0.033 150 4.3±2.1 9.6±3.6 9.6±3.6 0.011 180 4.6±2.5 9.6±3.4 9.6±3.4 0.007 GLP-2: glucagon-like peptide 2; MTT: meal tolerance test; NDO: non-diabetic with obesity group; T2D: diabetic group; C: control group; NS: non-significant. GLP-2 levels expressed in pmol/L; post hoc power: 89.9%.
FIGURE 1. Comparison of the AUCs of GLP-1 and GLP-2 following a standard MTT among the three groups.
NDO: non-diabetic with obesity; T2D: type 2 diabetes; AUC: area under the curve; GLP-1: glucagon-like peptide-1; GLP-2: glucagon-like peptide-2; MTT:
meal tolerance test; GLP-1: non-significant difference among the three groups (post-hoc power: 47%); GLP-2: control group AUC significantly higher than
NDO (P=0.01) and T2D (P=0.05) (post-hoc power: 77.7%).
The glucose levels were significantly higher in the T2D group in the fasting state and at all the times evaluated after the MTT than the NDO and C groups. TABLE 4 details the glucose levels after MTT at all the times evaluated. As expected, the AUC of glucose of the T2D was significantly higher than both the NDO (P<0.001)
and C groups (P<0.001). In regards to the insulin levels, they were
lower in the C group than in the NDO and T2D groups in the fasting state (P=0.02); then, they became significantly higher in the NDO
group than in T2D and C groups from 15 minutes through 150
TABLE 4. Comparison of the glucose levels following a standard MTT among the three groups studied
Time
(minutes) NDO T2D C
Values of P 0 95.3±14.9 170.7±72.1 89.8±6.3 0.001 15 116.8±32.2 171.2±71.2 111.3±10.5 0.018 30 133.5±51.6 195.4±70.2 117.8±16.3 0.009 45 142.8±39.2 222±68.9 114±16.4 <0.001 60 141.1±48.8 227.4±69.8 105.4±18.3 <0.001 90 123.5±24 250.6±80 104.3±17.8 <0.001 120 123.8±30.6 260.1±90.6 103.9±14.7 <0.001 150 116±28.1 260.8±98.3 104.7±15.4 <0.001 180 111.8±34.6 240.9±102.4 96.1±8.6 <0.001 MTT: meal tolerance test; NDO: non-diabetic with obesity group; T2D: diabetic group; C: control group. Glucose levels expressed in mg/dL; post hoc power: 99%.
TABLE 5. Comparison of the insulin levels following a standard MTT among the three groups studied
Time
(minutes) NDO T2D C
Values of P
0 23±15.8 14±10.8 6±3.2 0.02
15 102±83.2 12.6±9.7 41.2±7.4 0.001 30 130.5±91 31.2±22.2 46.1±24.5 0.001 45 181.9±115 36±24.7 34.1±23 <0.001 60 146.3±107.6 35.1±28.8 41.7±27.4 0.001 90 129.5±129.4 40.3±32.2 33.8±26.7 0.024 120 129.9±107 44.7±44.3 24.2±13.6 0.007 150 102.5±105 39.9±25.5 33.2±19.7 0.05 180 75.2±82.6 44.8±41.8 10.9±8.6 NS MTT: meal tolerance test; NDO: non-diabetic with obesity group; T2D: diabetic group; C: control group; NS: non-significant. Insulin levels expressed in mIU/L; post hoc power: 99.9%.
FIGURE 2. Comparison of the AUCs of glucose and insulin following a standard MTT among the three groups
AUC: area under the curve; MTT: meal tolerance test; NDO: non-diabetic with
obesity; T2D: type 2 diabetes. Glucose: T2D group AUC significantly higher
than NDO (P<0.001) and control (P<0.001) (post-hoc power: 99%); Insulin:
DISCUSSION
The exact roles and importance of gut-derived peptides in metabolic processes in physiological conditions are subjects of significant debate. Although these hormones have been identified in the early 1970s, they really rose to prominence after the growth of bariatric surgery and the observation of the critical impact of these procedures on their release and, consequently, on the glucose homeostasis and improvement of metabolic syndrome and its clinical features(16-22,28-34). In this study, we observed that the GLP-1 levels did not differ among non-diabetic individuals with morbid obesity, diabetic individuals with mild obesity and healthy controls. Conversely, significantly lower levels of GLP-2 were observed in the non-diabetic with morbid obesity and diabetic with mild obesity groups than in the healthy controls. Since the stimuli for GLP-1 and GLP-2 are the same, and they are regularly secreted in equimolar proportions by the L-cells(1,4-8), there seems to be a common feature in both groups with obesity that solely impairs the GLP-2 levels, without compromising the GLP-1 secretion. This feature may be related to a specific imbalance of the homones secretion kinetics, which may be an impairment in the proglucagon conversion to GLP-2 or a faster degradation. Since the degradation of both GLP-1 and GLP-2 are mediated by the same enzyme (DPP-IV), this is less likely to be such a mechanism. This imbalance remains to be determined in a molecular basis.
A possible connection between chronic inflammation and impairment of the GLP-2 levels has been previously reported. Tsukahara et al.(35), studying the correlation between tumor ne-crosis factor alpha (TNF-α) in GLP-2 release in individuals with Crohn’s disease, observed that high levels of TNF-α were negatively correlated with the GLP-2 release. Sigalet et al.(36) also revealed that pediatric patients with active Crohn’s disease presented sig-nificantly lower postprandial GLP-2 levels than healthy controls. Although the inflammation is supposed to be much more intense in inflammatory bowel diseases, obesity and T2D are also associ-ated with a low-grade chronic inflammatory state(37-40). In fact, the discrepancy in CRP levels among the groups along with the differences in the GLP-2 levels observed in the present study tend to signal that this inflammatory state may also play a significant role in this mechanism.
In regard to the relationship between chronic inflammation and GLP-1, the evidence available to date tends to support that GLP-1 increases in response to inflammation(41-44). A pioneering study by Ellingsgaard et al.(41) revealed that the administration of interleukin 6 (IL-6) or elevated IL-6 concentrations in response to exercise stimulates GLP-1 secretion from intestinal L-cells and pancreatic alpha cells, improving insulin secretion and blood glucose levels. Kahles et al.(42) observed significantly higher levels of GLP-1 in criti-cally ill individuals compared to healthy controls, and speculated on a possible mechanism mediated by interleukin-6 (IL-6). Lebherz et al.(43) confirmed this finding, and observed that higher levels of GLP-1 among critically ill individuals were significantly correlated with IL-6 levels. Evidently, since these authors analyzed cohorts of individuals with acute high-grade inflammation, this phenom-enon is not comparable to the inflammatory state associated with obesity and T2D. The influence of IL-6 on GLP-1 release seems to work like a “switch” pattern: under physiological circumstances, GLP-1 is only secreted by intestinal L-cells; under situations of physiological stress with high IL-6 levels, the pancreatic alpha-cell
secretion begins(45-49). However, since the present study did not find any correlation between the CRP levels and the GLP-1 levels, it is reasonable to suppose that, in contrast to GLP-2, the low-grade inflammation observed was not sufficient to cause any noteworthy impairment or significant change in the GLP-1 levels.
This study presents some limitations that should be noted. Firstly, it enrolled a small patient population; this occurs primarily due to the high costs of the assays utilized. Moreover, the popula-tion is far from perfectly matched according to age, gender and BMI, which also limits ultimate conclusions. The choice to study diabetic individuals with severe T2D relied on the fact that these individuals usually present more severe metabolic disturbances due to the refractory nature of their disease, hence the differences from the C and NDO groups would be more remarkable. Furthermore, the specific evaluations of IL-6 and TNF-α were not performed in this protocol, which does not permit ultimate conclusions on the exact mechanism of GLP-1 enhancement and GLP-2 impairment. Nevertheless, the significance of our findings is strong enough to be taken into account, despite the above cited flaws.
Considering solely the glucose metabolism-related functions of GLP-1 and GLP-2, and the harmful effects of inflammation on the glucose/insulin homeostasis, the impairment of the GLP-2 levels among individuals with obesity and T2D may be seen as an adaptive/compensatory mechanism to prevent the uptake of even larger amounts of carbohydrates in the gut. Especially in the se-verely diabetic individuals enrolled in this study, which presented a limited pancreatic response to the food absorption, this impairment in the GLP-2 levels assumes a substantial protective role. Thus, the symbolic figure of GLP-1 and GLP-2 as “yin/yang” hormones may be also appropriately used to describe their interplay in regards to glucose homeostasis and chronic inflammation.
These results point out that, since the GLP-2 levels presented an adaptive/compensatory impairment among individuals with low grade chronic inflammation, the use, within these populations, of drugs that may somewhat increase the GLP-2 levels or stimulate its action, such as DPP-IV inhibitors or GLP-2 analogs, should be cautiously evaluated, once they are likely to provoke harmful effects on glucose homeostasis on individuals which already present some degree of disturbance in insulin sensitivity.
CONCLUSION
GLP-2 levels were impaired among individuals with morbid obesity and with diabetes and mild obesity. This mechanism seems to be enrolled in preventing the worsening of the glucose homeo-stasis in these individuals.
ACKNOWLEDGEMENTS
We acknowledge Bruno Geloneze and Ana Carolina Junqueira Vasques for the support of the Laboratory of Investigation of Metabolism and Diabetes.
Authors’ contributions
REFERENCES
1. Brubaker PL, Drucker DJ. Structure-function of the glucagon receptor family of G protein-coupled receptors: the glucagon, GIP, GLP-1, and GLP-2 receptors. Receptors Channels. 2002;8(3-4):179-88.
2. Cazzo E, Gestic MA, Utrini MP, Pareja JC, Chaim EA, Geloneze B, et al. Correla-tion between pre and postoperative levels of GLP-1/GLP-2 and weight loss after Roux-en-Y gastric bypass: a prospective study. Arq Bras Cir Dig. 2016;29:257-9. 3. Cazzo E, Pareja JC, Chaim EA, Coy CSR, Magro DO. Glucagon-Like Peptides 1 and 2 Are Involved in Satiety Modulation After Modified Biliopancreatic Diversion: Results of a Pilot Study. Obes Surg. 2017 Aug 14. doi: 10.1007/s11695-017-2875-3.
4. Clemente-Postigo M, Roca-Rodriguez Mdel M, Camargo A, Ocaña-Wilhelmi L, Cardona F, Tinahones FJ. Lipopolysaccharide and lipopolysaccharide-binding protein levels and their relationship to early metabolic improvement after bariatric surgery. Surg Obes Relat Dis. 2015;11:933-9.
5. Holst JJ, Vilsbøll T, Deacon CF. The incretin system and its role in type 2 diabetes mellitus. Mol Cell Endocrinol. 2009;297:127-36.
6. Lee J, Koehler J, Yusta B, Bahrami J, Matthews D, Rafii M, et al. Enteroendo-crine-derived glucagon-like peptide-2 controls intestinal amino acid transport. Mol Metab. 2017;17:245-55.
7. Vahl T, D’Alessio D. Enteroinsular signaling: perspectives on the role of the gastrointestinal hormones glucagon-like peptide 1 and glucose-dependent insu-linotropic polypeptide in normal and abnormal glucose metabolism. Curr Opin Clin Nutr Metab Care. 2003;6:461-8.
8. Vrang N, Larsen PJ. Preproglucagon derived peptides GLP-1, GLP-2 and oxyntomodulin in the CNS: role of peripherally secreted and centrally produced peptides. Prog Neurobiol. 2010;92:442-62.
9. Baldassano S, Amato A, Mulè F. Influence of glucagon-like peptide 2 on energy homeostasis. Peptides. 2016;86:1-5.
10. Cazzo E, Gestic MA, Utrini MP, Chaim FD, Geloneze B, Pareja JC, et al. GLP-2: a poorly understood mediator enrolled in various bariatric/metabolic surgery-related pathophysiologic mechanisms. Arq Bras Cir Dig. 2016;29:272-5. 11. de Hollanda A, Jiménez A, Corcelles R, Lacy AM, Patrascioiu I, Vidal J. Gas-trointestinal hormones and weight loss response after Roux-en-Y gastric bypass. Surg Obes Relat Dis. 2014;10:814-9.
12. Drucker DJ, Yusta B. Physiology and pharmacology of the enteroendocrine hormone glucagon-like peptide-2. Annu Rev Physiol. 2014;76:561-83. 13. Estall JL, Drucker DJ. Glucagon-like peptide-2. Annu Rev Nutr. 2006;26:391-411. 14. Carmody JS, Muñoz R, Yin H et al. Peripheral, but not central, GLP-1 receptor signaling is required for improvement in glucose tolerance after Roux-en-Y gastric bypass in mice. Am J Physiol Endocrinol Metab. 2016;310:E855-61.
15. Madsbad S. The role of glucagon-like peptide-1 impairment in obesity and potential therapeutic implications. Diabetes Obes Metab. 2014;16:9-21.
16. Cazzo E, Pareja JC, Chaim EA, Geloneze B, Barreto MR, Magro DO. GLP-1 and GLP-2 Levels are Correlated with Satiety Regulation After Roux-en-Y Gastric Bypass: Results of an Exploratory Prospective Study. Obes Surg. 2017;27:703-8. 17. Holst JJ. Enteroendocrine secretion of gut hormones in diabetes, obesity and
after bariatric surgery. Curr Opin Pharmacol. 2013;13:983-8.
18. le Roux CW, Aylwin SJ, Batterham RL, Borg CM, Coyle F, Prasad V, et al. Gut hormone profiles following bariatric surgery favor an anorectic state, facilitate weight loss, and improve metabolic parameters. Ann Surg. 2006;243:108-14. 19. Meek CL, Lewis HB, Reimann F, Gribble FM, Park AJ. The effect of bariatric
sur-gery on gastrointestinal and pancreatic peptide hormones. Peptides. 2016;77:28-37. 20. Mingrone G, Castagneto-Gissey L. Mechanisms of early improvement/resolution
of type 2 diabetes after bariatric surgery. Diabetes Metab. 2009;35(6 Pt 2):518-23. 21. Ochner CN1, Gibson C, Shanik M, Goel V, Geliebter A. Changes in neurohor-monal gut peptides following bariatric surgery. Int J Obes (Lond). 2011;35:153-66. 22. Steinert RE, Feinle-Bisset C, Asarian L, Horowitz M, Beglinger C, Geary N.
Ghrelin, CCK, GLP-1, and PYY(3-36): Secretory Controls and Physiological Roles in Eating and Glycemia in Health, Obesity, and After RYGB. Physiol Rev. 2017;97:411-63.
23. Hein GJ, Baker C, Hsieh J, Farr S, Adeli K. GLP-1 and GLP-2 as yin and yang of intestinal lipoprotein production: evidence for predominance of GLP-2-stimulated postprandial lipemia in normal and insulin-resistant states. Diabetes. 2013;62:373-81. 24. Geloneze B, Lima MM, Pareja JC, Barreto MR, Magro DO. Association of insulin
resistance and GLP-2 secretion in obesity: a pilot study. Arq Bras Endocrinol Metabol. 2013;57:632-5.
25. Magro DO, Cazzo E, Kotze PG, Vasques ACJ, Martinez CAR, Chaim EA, et al. Glucose Metabolism Parameters and Post-Prandial GLP-1 and GLP-2 Release Largely Vary in Several Distinct Situations: a Controlled Comparison Among Individuals with Crohn’s Disease and Individuals with Obesity Before and After Bariatric Surgery. Obes Surg. 2017 Aug 3. doi: 10.1007/s11695-017-2851-y. 26. Matthews DR, Hosker JP, Rudenski AS, Naylor BA, Treacher DF, Turner
RC. Homeostasis model assessment: insulin resistance and beta-cell function from fasting plasma glucose and insulin concentrations in man. Diabetologia. 1985;28:412-9.
27. Garber AJ, Abrahamson MJ, Barzilay JI, Blonde L, Bloomgarden ZT, Bush MA, et al. Consensus statement by the American Association of Clinical En-docrinologists and American College of Endocrinology on the comprehensive type 2 diabetes management algorithm: 2015 executive summary. Endocr Pract. 2015;21:1403-14.
28. Buchwald H, Dorman RB, Rasmus NF, Michalek VN, Landvik NM, Ikramuddin S. Effects on GLP-1, PYY, and leptin by direct stimulation of terminal ileum and cecum in humans: implications for ileal transposition. Surg Obes Relat Dis. 2014;10:780-6.
Cazzo E, Pareja JC, Chaim EA, Coy CSR, Magro DO. Comparação dos níveis de proteína C reativa, GLP-1 e GLP-2 entre indivíduos diabéticos, obesos mórbidos e controles saudáveis: um estudo exploratório. Arq Gastroenterol. 2018;55(1):72-7.
RESUMO – Contexto – Os peptídeos semelhantes ao glucagon 1 e 2 (GLP-1/GLP-2) são hormônios gastrointestinais que podem afetar
direta-mente a homeostase glicêmica; a atividade de ambos parece ser significativadireta-mente afetada pela inflamação crônica. Objetivo – Avaliar os níveis
pós-prandiais dos peptídeos semelhantes ao glucagon 1 e 2 (GLP-1/GLP-2), proteína C reativa (PCR) e as curvas pós-prandiais de glucose e
insulina entre indivíduos com obesidade, diabetes tipo 2 e controles saudáveis. Métodos – Estudo piloto transversal, que envolveu indivíduos
aguardando a realização de cirurgia bariátrica/metabólica e controles saudáveis. Os níveis de GLP-1, GLP-2, glucose e insulina foram obtidos
após um teste de refeição padrão. A inflamação foi avaliada através dos níveis de PCR. Resultados – Houve 30 indivíduos avaliados no estudo,
divididos em três grupos: obesos mórbidos sem diabetes (NDO; n=11 pacientes), diabéticos com obesidade leve (T2D; n=12 pacientes) e con-troles (C; n=7 pacientes). Os níveis médios de PCR foram significativamente maiores no grupo NDO (6,6±4,7 mg/dL) do que nos grupos T2D
(3,3±2,2 mg/dL) e C (2,5±3,2 mg/ dL) (P=0,038). Os níveis de GLP-1 após o teste de refeição padrão e a área sob a curva do GLP-1 não diferiram
significativamente entre os grupos. Os níveis de GLP-2 foram significativamente mais baixos nos grupos NDO e T2D do que no grupo C em todos
os tempos avaliados. A área sob a curva do GLP-2 foi significativamente menor nos grupos NDO e T2D do que no grupo C (P=0,05 and P=0,01,
respectivamente). Conclusão – Os níveis de GLP-2 encontram-se alterados em indivíduos com obesidade e diabetes. Este mecanismo parece estar
envolvido na prevenção da piora da homeostase glicêmica nestes indivíduos.
29. Cazzo E, da Silva FP, Pareja JC, Chaim EA. Predictors for weight loss failure following Roux-en-Y gastric bypass. Arq Gastroenterol. 2014;51:328-30. 30. Cazzo E, Gestic MA, Utrini MP, Machado RR, Pareja JC, Chaim EA. Control
of hypertension after roux-en-y gastric bypass among obese diabetic patients. Arq Gastroenterol. 2014;51:21-4.
31. Cazzo E, Gestic MA, Utrini MP, Machado RR, Jimenez LS, da Silva AP, et al. Influence of Insulin Resistance Status on the Development of Gallstones Following Roux-En-Y Gastric Bypass: a Prospective Cohort Study. Obes Surg. 2016;26:769-75.
32. Cazzo E, Pareja JC, Geloneze B, Chaim EA, Barreto MRL, Magro DO. Post-prandial GLP-2 Levels Are Increased After Biliopancreatic Diversion in Diabetic Individuals with Class I Obesity: a Prospective Study. Obes Surg. 2017 Jan 18. doi: 10.1007/s11695-017-2554-4.
33. de Oliveira LF, Tisott CG, Silvano DM, Campos CM, do Nascimento RR. Glycemic behavior in 48 hours postoperative period of patients with type 2 diabetes mellitus and non diabetic submitted to bariatric surgery. Arq Bras Cir Dig. 2015;28(Suppl 1):26-30.
34. Holst JJ, Madsbad S. Mechanisms of surgical control of type 2 diabetes: GLP-1 is key factor. Surg Obes Relat Dis. 2016;12:1236-42.
35. Tsukahara T, Watanabe K, Watanabe T, Yamagami H, Sogawa M, Tanigawa T, et al. Tumor necrosis factor α decreases glucagon-like peptide-2 expression by up-regulating G-protein-coupled receptor 120 in Crohn disease. Am J Pathol. 2015;185:185-96.
36. Sigalet DL, Kravarusic D, Butzner D, Hartmann B, Holst JJ, Meddings J. A pilot study examining the relationship among Crohn disease activity, glucagon-like peptide-2 signalling and intestinal function in pediatric patients. Can J Gastro-enterol. 2013;27:587-92.
37. Borges Mde C, Terra GA, Takeuti TD, Ribeiro BM, Silva AA, Terra-Júnior JA, et al. Immunological evaluation of patients with type 2 diabetes mellitus submitted to metabolic surgery. Arq Bras Cir Dig. 2015;28:266-9.
38. Cartier A, Lemieux I, Alméras N, Tremblay A, Bergeron J, Després JP. Visceral obesity and plasma glucose-insulin homeostasis: contributions of interleukin-6 and tumor necrosis factor-alpha in men. J Clin Endocrinol Metab. 2008;93: 1931-8.
39. Lins DC, Campos JM, de Paula PS, Galvão-Neto M, Pachu E, Cavalcanti N, Ferraz ÁA. C-reactive protein in diabetic patients before gastric bypass as a possible marker for postoperative complication. Arq Bras Cir Dig. 2015;28(Suppl 1):11-4. 40. Olszanecka-Glinianowicz M, Zahorska-Markiewicz B, Janowska J et al. Serum concentrations of nitric oxide, tumor necrosis factor (TNF)-alpha and TNF soluble receptors in women with overweight and obesity. Metabolism. 2004;53:1268-73. 41. Ellingsgaard H, Hauselmann I, Schuler B, Habib AM, Baggio LL, Meier DT, et
al. Interleukin-6 enhances insulin secretion by increasing glucagon-like peptide-1 secretion from L cells and alpha cells. Nat Med. 2011;17:1481-9.
42. Kahles F, Meyer C, Möllmann J, Diebold S, Findeisen HM, Lebherz C, et al. GLP-1 secretion is increased by inflammatory stimuli in an IL-6-dependent manner, leading to hyperinsulinemia and blood glucose lowering. Diabetes. 2014;63:3221-9.
43. Lebherz C, Kahles F, Piotrowski K, Vogeser M, Foldenauer AC, Nassau K, et al. Interleukin-6 predicts inflammation-induced increase of Glucagon-like peptide-1 in humans in response to cardiac surgery with association to parameters of glucose metabolism. Cardiovasc Diabetol. 2016;15:21.
44. Zietek T, Rath E. Inflammation Meets Metabolic Disease: Gut Feeling Mediated by GLP-1. Front Immunol. 2016;7:154.
45. Hansen AM, Bödvarsdottir TB, Nordestgaard DN, Heller RS, Gotfredsen CF, Maedler K, et al. Upregulation of alpha cell glucagon-like peptide 1 (GLP-1) in Psammomys obesus-an adaptive response to hyperglycaemia? Diabetologia. 2011;54:1379-87.
46. Kilimnik G, Kim A, Steiner DF, Friedman TC, Hara M. Intraislet production of GLP-1 by activation of prohormone convertase 1/3 in pancreatic alpha-cells in mouse models of ss-cell regeneration. Islets. 2010;2:149-55.
47. Nie Y, Nakashima M, Brubaker PL, Li QL, Perfetti R, Jansen E, et al. Regulation of pancreatic PC1 and PC2 associated with increased glucagon-like peptide 1 in diabetic rats. J. Clin. Invest. 2000;105:955-65.
48. Whalley NM, Pritchard LE, Smith DM, White A. Processing of proglucagon to GLP-1 in pancreatic α-cells: is this a paracrine mechanism enabling GLP-1 to act on β-cells? J Endocrinol. 2011;211:99-106.