assessment of municipalities inequalities in the state of Ceará
João Felipe Barbosa Araripe-Silva
Universidade Federal do Ceará / Programa de Pós-Graduação em Administração e Controladoria Fortaleza / Ceará — Brazil
Sílvia Maria Dias Pedro Rebouças
Universidade Federal do Ceará / Faculdade de Economia, Administração, Atuária e Contabilidade (Feaac), Programa de Pós-Graduação em Administração e Controladoria
Fortaleza / Ceará — Brazil
Mônica Cavalcanti Sá de Abreu
Universidade Federal do Ceará / Faculdade de Economia, Administração, Atuária e Contabilidade (Feaac), Programa de Pós-Graduação em Administração e Controladoria
Fortaleza / Ceará — Brazil
Maria da Conceição Rodrigues Ribeiro
Universidade do Algarve / Instituto Superior de Engenharia, Departamento de Engenharia Civil Faro — Portugal
The paper builds a sustainable development index based on environmental, social, economic and institutional dimensions and presents a spatial assessment of municipalitties inequalities in the State of Ceará. Sustainability indices force institutions and governments to question their standards and act as “driving forces” for public policy-making. The validity of sustainability indexes is heavily dependent on how their components are weighted and aggregated. The research is quantitative developed through secondary data acquired in public agency databases of the country (Brazil) and federal unit (State of Ceara). Data analysis included confirmatory factor analysis for the construction of general sustainability indexes, descriptive analysis of these indices and spatial econometric modeling to represent on the map of Ceará municipalities. The survey results reveal a regular adjustment of the sustainable development index. The model allows a geographical view of sustainable development indicators and presents with a tool in the definition of public policies for social equity, environmental and economic. The analysis of social, economic, environmental, institutional and general indices revealed that the most urban areas of the State of Ceará have a greater sustainable development and confirms the fragility of public policies in promoting regional balance.
Keywords: confirmatory factor analysis; spatial econometric model; sustainable development; composite indica-dors; state of Ceará.
Construção de um índice de desenvolvimento sustentável e análise espacial das desigualdades nos municípios cearenses
O artigo apresenta a análise espacial da sustentabilidade nos municípios cearenses a partir da construção de um índice de desenvolvimento sustentável, embasado em dimensões social, ambiental, econômica e institucional. Os índices de sustentabilidade forçam instituições e governos a questionarem seus padrões e atuam como “forças motrizes” para a elaboração de políticas públicas. A validade dos índices de sustentabilidade depende da definição
DOI: http://dx.doi.org/10.1590/0034-7612163114
Article received on April 27, 2016 and accepted on October 06, 2017.
[Translated version] Note: All quotes in English translated by this article’s translator.
do conjunto de indicadores, e das técnicas adotadas para definição dos ponderadores e agregação dos indicado-res. A pesquisa é de natureza quantitativa, desenvolvida por meio de dados secundários, e adotou análise fatorial confirmatória para a construção do índice de desenvolvimento sustentável (IDS) e modelagem econométrica espacial para representação das desigualdades no mapa dos municípios cearenses. Os resultados da pesquisa revelam um ajuste regular do índice de desenvolvimento sustentável. O IDS permite uma visualização geográfica e identificação de associação espacial dos indicadores de desenvolvimento sustentável e apresenta-se como uma ferramenta de suporte à definição de políticas públicas. A pesquisa revelou que áreas mais urbanas do Estado do Ceará apresentam um melhor índice de desenvolvimento sustentável, e confirmou a fragilidade das políticas públicas em promover o equilíbrio regional.
Palavras-chave: análise fatorial confirmatória; modelagem econométrica espacial; desenvolvimento sustentável; índice de desempenho; estado do Ceará.
Construcción de un índice de desarrollo sostenible y análisis espacial de las desigualdades en los municipios cearenses
El artículo presenta el análisis espacial de la sostenibilidad en los municipios cearenses a partir de la construcción de un índice de desarrollo sostenible, basado en dimensiones social, ambiental, económica e institucional. Los índices de sostenibilidad obligan a instituciones y gobiernos a cuestionar sus patrones y actúan como “fuerzas motrices” para la elaboración de políticas públicas. La validez de los índices de sostenibilidad depende de la defi-nición del conjunto de indicadores, y de las técnicas adoptadas para definir los ponderadores y la agregación de los indicadores. La investigación es de naturaleza cuantitativa, desarrollada por medio de datos secundarios, y adoptó análisis factorial confirmatorio para la construcción del índice de desarrollo sostenible (IDS) y modelado econométrico espacial para representación de las desigualdades en el mapa de los municipios cearenses. Los resultados de la investigación revelan un ajuste regular del índice de desarrollo sostenible. El IDS permite una visualización geográfica e identificación de asociación espacial de los indicadores de desarrollo sostenible y se presenta como una herramienta de apoyo a la definición de políticas públicas. La investigación reveló que áreas más urbanas del Estado de Ceará presentan un mejor índice de desarrollo sostenible, y confirmó la fragilidad de las políticas públicas en promover el equilibrio regional
Palabras clave: análisis factorial confirmatorio; modelado econométrico espacial; desarrollo sostenible; índice de
desempeño; estado de Ceará.
1. INTRODUCTION
Brazil presents the tenth highest GINI index in the world, which confirms a marked social inequality. Additionally, there are significant interstate and regional differences (Barros, 2011). According to Araújo (2009), the focus of inequality lies in the differences between the states of the South and Southeast regions and the other regions of the country. In the Northeastern region, the state of Ceará is the leader in income inequality and is one of the poorest in the country (Soares, 2008, Manso, Barreto and França, 2009).
Bar-el (2005) says that economic growth in the state of Ceará has not contributed significantly to poverty reduction, and that inequalities between urban and rural areas still persist. The low values of the Municipal Human Development Index (MHDI) confirm the fragile socioeconomic situation and a deficient structure when it comes to the application of financial resources from the public sector.
Performance indexes provide decision makers with the elements needed for the assessment of a country or regions. Becker and partners (2017) reinforce the use of indexes to assess human development, sustainability, perceived corruption, innovation, competitiveness and other complex phenomena, which cannot be directly measured or are not solely defined.
Although there are several international efforts, it is questionable which indicators should form a “performance index” capable of assessing the country’s progress towards sustainable development (Tasaki and Kameyana, 2015). After the Rio +20 conference, each government, guided by a global aspiration and multilateral discussions, set its own goals in terms of sustainable development. Sus-tainability is, therefore, more than an aggregation of important issues. It involves interconnections and a structure of government actions in a socio-ecological system.
Floridi and partners (2011) reinforce the tension between the need for simplification and the epis-temological and ontological irreducibility of the use of indicators capable of measuring performance. The evaluation of a multiplicity of economic, social, environmental and institutional aspects can hardly be spatially deciphered by a single index (Di Bella et al., 2016). In the construction of sustainability indexes, it is important to use adequate methods to include indicators to the standardization scheme and the algorithm of insertion of weights to such indicators.
It seems, therefore, that there is a need to develop indexes that allow a spatial assessment of
sus-tainable development, based on the following research question: which indicators should compose a
sustainable development index capable of spatially assessing inequality among municipalities? This study uses confirmatory factorial analysis and spatial econometrics to develop a sustainable development index (SDI), evidencing the inequalities of the municipalities of the state of Ceará, Brazil, through maps of the social, environmental, economic and institutional situations.
The article is structured in the following sections. The theoretical framework addresses the impor-tance of using performance indexes to measure sustainable development and the process of building sustainability indexes. Next, the methodology presents the framework of indicators and techniques for the definition of weights and aggregation of indicators. The results are subdivided into SDI con-struction and spatial econometric modeling for drawing maps of inequality of the municipalities of the state of Ceará. Finally, the discussion and conclusion confirm the usefulness of the sustainable development index as a tool for public policy-making in the semi-arid region of the Northeast of Brazil.
2. IMPORTANCE OF USING PERFORMANCE INDEXES TO MEASURE SUSTAINABLE DEVELOPMENT
The economic, social, environmental and institutional dimensions of sustainable development are complex and involve synergies and relationships of mutual influence. The list of indicators capable of capturing and evaluating sustainability is influenced by the interdependence in these dimensions. Kates and partners (2001) argue that the goal of measuring sustainability is to provide decision makers with elements for assessment at the local and global levels. This measurement should integrate the natural systems with society, and assist decision making processes in the short and long term. According to Segnestam (2002), indicators are used as tools to obtain information on issues involving population health, climate, and economic well-being.
education, equity and security); the economy (patterns of consumption and production) and renewable and non-renewable natural resources. They may also include global environmental issues (climate change, ozone depletion); quality of air, soil and water; globalization and quality of institutions.
In this sense, Becker and partners (2017) argue that performance indexes force institutions and governments to question their standards and act as “driving forces” for behavioral change. Building performance indexes requires the definition of indicators and must also consider the needs and ex-pectations of developed and developing countries.
The United Nations has adopted a new set of targets and indicators for sustainable development (UN, 2106). It is important that the indicators chosen reflect not only the knowledge of government institutions but also the expectations of society. Tasaki and Kameyama (2015) reinforce the need to have available information and promote an ongoing dialogue with society to develop performance indexes, aligned with the particularities of a country or region.
The interconnections between environmental, economic and social aspects are difficult to identify and to be reflected in measurements and trends over time (Cook et al., 2017). According to Moldan, Janouska and Halk (2012), the absolute value of the index (or indicator) is not as important as the possibility of comparing the results achieved. Although the countries have a certain similarity, it is not possible to state which is the best model to achieve sustainable development. According to Cornescu and Adam (2014), there are differences in geographic location, natural resources, governance and economic policies that influence in establishing the goals to be achieved.
2.1 UNDERSTANDING THE PROCESS OF BUILDING SUSTAINABILITY INDEXES
Some indexes are widely used in monitoring public policy, communicating with the public or in gen-erating performance rankings. Examples include the Human Development Index (Jahan, 2015), the Genuine Progress Indicator (Talberth, Cobb and Slattery, 2007), the Index of Sustainable Economic Welfare (Chelli, Ciommi and Gigliarano, 2013); the Environmental Performance Index (HSU, 2016) and the City Development Index (Singh et al., 2012).
The Human Development Index (HDI) was created to be a counterpoint of GDP to measure development. The index presents a general measure of human development, based on three pillars: (a) life expectancy (health); (b) access to knowledge (education); and (c) gross national income per capita (standard of living). It is noted, however, that the HDI does not analyze issues such as democ-racy, participation, equity and sustainability (Jahan, 2015).
The Genuine Progress Indicator (GPI) is another measure to correct GDP deficiencies by incor-porating non-monetary aspects or elements not related to market economy such as social inequality and environmental deterioration (Talberth et al., 2007). The Index of Sustainable Economic Welfare (ISEW) measures the proportion of economic activity that influences well-being (Chelli et al., 2013). The ISEW considers inequalities, public spending on health and education, with attention to environ-mental costs (such as cost of emission of gases or environenviron-mental depreciation). However, Neumayer (2000) criticizes ISEW because of the arbitrary inclusion or exclusion of components that contribute to economic well-being.
vitality. The EPI does not therefore address other dimensions of sustainability and is limited to the environmental dimension. Finally, the City Development Index (CDI) evaluates the infrastructure (households with potable water, plumbing, electricity and telephone) and the index of untreated waste (liquid and solid) (Singh et al., 2012). It is observed that for the context of sustainability, the CDI is limited to an evaluation of poverty and urban governance.
According to Gan and partners (2017), the process of constructing a sustainability index includes three steps: (a) selection of indicators; (b) definition of weights and, (c) aggregation of these indicators into a single index. There are several methods for selecting indicators, usually involving a bottom-up or top-down process. A bottom-up approach involves compiling a final set of indicators after integrating the perception of various stakeholders (Chamaret et al., 2007). The top-down approach is based on expertise to define indicators that meet existing goals.
Cook and partners (2017) propose a five-stage process for selecting the indicators to compose sustainability indexes. In the first stage, there is the formation of the team of experts who have a robust definition of sustainability and clarity about the interactions between the processes, themes and issues that will be addressed. Then, a “set of indicators” is identified using the “focus group” technique and expert brainstorming exercises, regardless of data availability.
In the third stage there is the definition of the criteria for the selection of indicators. Then, the indicators are either chosen or rejected according to the degree of adherence to the selection criteria (i.e., political relevance, utility, multiple aspects, ease of interpretation, availability and quality of data). Finally, in the fifth stage, goals are established for each of the accepted indicators.
After the indicators are selected, the stages of definition of the weights and aggregation of indi-cators occur. These two phases are critical to measure the contribution of different dimensions of sustainability to the construction and reliability of the index. Gan and partners (2017) observed that during the weighting phase of indicators, different criteria can be adopted. Indicators can be attributed the same weight, or statistic methods can be used to determine weights, such as the principal compo-nents analysis, factorial analysis, regression models and unobserved component models. In addition, participatory methods can be used, such as those based on resource allocation, public opinion, joint analysis and hierarchical analytical processes.
For the aggregation of the indicators, additive aggregation methods can be adopted; geometric aggregation (i.e., spatial econometric modeling) or non-compensatory aggregation methods. In this sense, Singh and partners (2012) recommend that the methods for definition of weights and aggre-gation of indicators should be carefully chosen, according to: the purpose of the sustainability index and the goals to be achieved; comparisons made over time, location or situations; and the need to anticipate future conditions or trends.
3. METHODOLOGY
3.1 RESEARCH CHARACTERISTICS AND DEFINING OF THE FRAMEWORK OF THE INDICATORS
Data from population and geography of the state of Ceará, Brazil, were used, covering its 184 municipalities. A cross-sectional study was conducted in 2010 on sustainable development indicators provided by the Brazilian Institute of Geography and Statistics (IBGE), the Ministry of Environment (MMA), the National Institute for Space Research (Inpe), the Research and Strategy Institute (Ipece) and the Department of Information of the Unified Health System (Datasus).
Socioeconomic phenomena are complex and difficult to measure and evaluate. Complexity also implies multidimensionality, and in the case of SDI, it comprises four dimensions: social, environ-mental, economic and institutional. Chart 1 presents the themes, sub-themes, indicators adopted for each dimension of the SDI and the source for data collection. The construction of the sustainable development index was based on the themes proposed in the guidelines of the Commission for Hu-man Development (UN, 2001) and sustainability indicators used by IBGE (2012).
CHART 1 INDICATORS OF SUSTAINABLE DEVELOPMENT ADOPTED IN BUILDING THE SDI
SOCIAL DIMENSION
Theme Sub-theme Indicator Source*
Equity
Poverty
Households with income below poverty line (%) Population living in extreme poverty (%) Average monthly income (ln)
IBGE IPECE IPECE
Gender Equality Ratio between average wages for women and men IPECE
Health
Nutritional
Conditions Portion of underweight children (< 2 years old) DATASUS
Mortality Infant mortality (< 5 years old)
Infant mortality (< 1 year old) DATASUS
Health Care
Vaccinated children (< 1 year old) (%)
Children born with prenatal care (> 7 consultations with the doctor) Rate of beds per thousand inhabitant
Rate of health units per Thousand inhabitants
DATASUS IPECE IPECE
Sewer and Water Supply
Inhabitants with access to sewer system (%)
Inhabitants with access to water supply system (%) IBGE
Education
Level of Education
School enrollment rates in primary education School enrollment rates in basic education School enrollment rates in high school
IPECE
Literacy Literacy rate (10 or more years old) IPECE
Population Population Changes
Urbanization rate (%) Rate of population growth (%)
IPECE IPECE
ENVIRONMENTAL DIMENSION
Theme Sub-theme Indicator Source
Climate Climate Change Risk of fire (frequency of focus of fire in a year) Climatology
INPE IPECE
Soil
Agriculture Cultivated areas (%) IPECE
Desertification
Aridity index Degraded areas (%)
Areas susceptible to desertification (%)
IPECE
Fresh Water Amount of Water
River basins (ln) Surface runoff Rain distribution Observed precipitation
IPECE
Biodiversity Ecosystem Conservation land as % of total area MMA
ECONOMIC DIMENSION
Theme Sub-theme Indicator Source
Economic Structure
Economic Framework
GDP per capita
Union’s total revenues, per municipality (ln) Municipality’s tax revenue (ln)
IPECE
Commerce
Commercial balance (ln)
Value added to basic prices in industry (%) Value added to basic prices in services (%)
IPECE
Patterns of Consumption and Production
Use of Electricity Portion of households with access to electricity Average electricity consumption (ln per capita)
IBGE IPECE
Collection of
Sorted Waste Households with access to waste collection service (%) IBGE
INSTITUTIONAL DIMENSION
Theme Sub-theme Indicator Source
Social Organization
Institutional Capacity
Inter-municipal connections Municipal environmental council
Rate of illiterate voters/voters able to read and write Rate of voters able to read and write
Proportion of abstention in the elections (average of the two runs) Crop loss (%)
IBGE IPECE IPECE
Source: UN (2001); IBGE (2012).
and infrastructure improvement. In the case of environmental indicators, they should reflect physical aspects of the environment or human activities that generate significant impacts on air, water, soil and biodiversity. In the economic dimension, macroeconomic indicators reflect fluctuations in the economy and patterns of production and consumption. Finally, the institutional dimension is repre-sented by the organization of society and the building of institutional capacity to promote well-being.
3.2 WEIGHTING CALCULATION OF THE SUSTAINABLE DEVELOPMENT INDEX
Based on the set of indicators presented in chart 1, the weighting calculation of the Sustainable De-velopment Index (SDI) was conducted using the Confirmatory Factor Analysis (CFA). A reflexive model was adjusted because the level of development in each dimension is reflected in the respective indicators. The relative importance of indicators and dimensions is given by factorial weight and an additive aggregation method was chosen. Thus, the score of each dimension was calculated as the weighted average of the observed values for the respective indicators, considering the factorial weights. Likewise, the SDI represents a weighted average of the scores of the four dimensions.
The choice of using CFA instead of exploratory factor analysis (EFA), is because CFA imposes restrictions on the indicators of the pre-defined dimensions (i.e., social, environmental, economic and institutional). Hair Jr. and partners (2005) justify that the CFA tests a pre-specified relationship, and Marôco (2010) states that CFA can be used to evaluate the quality of adjustment of a predefined structure to the correlational structure observed between the manifested variables (indicators).
The study followed the recommendations of Marôco (2010) in order to verify the validity and reliability of the proposed SDI. The factorial validity was verified by the standardized factorial weights; the convergent validity by the average variance extracted (AVE) and the discriminant validity by
comparing the squared correlation coefficient (R2) between the factors and the AVE of each of them.
The reliability was verified by composite reliability coefficients and Cronbach’s alpha. The quality of the adjustment was evaluated through absolute adjustment indexes (χ² divided by the number of degrees of freedom (χ²/df) and the Goodness of Fit Index or GFI), through relative adjustment indexes (Comparative Fit Index (CFI), and Tuker-Lewis Index, or TLI) and through parsimonious adjustment (Parsimony CFI, or PCFI).
After calculating the scores of the latent variables, a standardization of the indicators was performed in order to convert them into a zero-to-one range. Thus, the standardized SDI of each municipality corresponds to the difference between the value of the index of the municipality and the minimum value of the observations, divided by the difference between the values of the maximum and mini-mum indexes of the municipalities observed. In this way, it is possible to comparatively visualize the results of the municipalities of the state of Ceará.
3.3 AGGREGATING INDICATORS THROUGH SPATIAL ECONOMETRIC MODELING
Dependence and autocorrelation are basic concepts of spatial analysis. They express a relation of dependence between the occurrence of the phenomenon and the distance or geographical space in which it occurs (Embrapa, 2004). Almeida (2012) explains that spatial autocorrelation means that each value presented by a variable of interest in one region tends to be associated with the value of that variable in other neighboring regions. Thus, the spatial analysis is composed of a set of linked procedures, whose purpose is to generate an inferential model that adds the spatial variable as ex-planatory of the phenomenon.
According to Haining (2003), the representation of geographic phenomena is usually identified by four categories: points, lines, areas and surfaces. In this study, the representation by area was adopted, which allowed a comparative analysis of the municipalities of the state of Ceará. After defining the category of spatial representation, the next step is to identify spatial dependence. Spatial autocorrela-tion indexes — such as Moran and Geary global indexes and variograms — are used in estimating the dependence of a region’s attribute towards its neighbors (Embrapa, 2004).
Almeida (2012) shows that to create a statistic of spatial autocorrelation, three elements are necessary: self-covariance measure; measure of data variance; and spatial weighting matrix. In order to identify the spatial autocorrelation, initially, a covariance matrix of the studied regions must be
formed, that is, a matrix with dimension n by n, to measure spatial dependence. This matrix can be
built by using the geo-statistical approach, in which observations are classified from the distance between the studied regions, or by the parametric approach, in which there is the arrangement of the occurrence of spatial interactions.
Next, a spatial weighting matrix (W) is specified, seeking to reflect the spatial arrangement of the interactions, as a result of the observed variable. According to Almeida (2012), each interaction between regions (called “spatial weight”) is observed by a cell of this matrix. In order to measure the degree of connection between the regions, the proximity between them is generally used, and this can be expressed by a geographical, socioeconomic or other criterion that is relevant to the phenomenon studied. The criterion of geographical connection is defined according to the contiguity and/or geographic distance, according to a chosen metric.
According to Almeida (2012), due to the diverse type of spatial weighting matrices, there is the risk of arbitrarily selecting one of them and the selected one is not the best. To circumvent this arbitrariness, a diagnostic test is conductes to try to capture the maximum of spatial dependence. The procedure consists of three steps: estimating the classical linear regression model; to test the residuals of this
model for spatial autocorrelation using the global Moran’s index (I) for a set of W matrices; and finally,
select the matrix of spatial weights that has generated the largest significant value of the Moran’s I.
The Moran’s I expresses the neighbors’ autocorrelation. This index is used to test the hypothesis
of correlation between neighbors, i.e., it is a test of spatial independence. According to Neves and
partners (2000), the global Moran’s I provides a general measure of spatial association, varying its value
from -1 to 1. The values close to zero indicate the absence of spatial autocorrelation, and indicate the absence of interaction between the values of the objects and their neighbors. Positive autocorrelation values indicate that the attribute of an object is similar to that of its neighbors; while negative values indicate negative autocorrelation.
that is, the definition of spatial weights between two regions — so that two geographically close regions have greater spatial interaction. Then, the spatial weighting matrix was created, with the formation of a binary spatial matrix, based on the nearest neighbor considering the geographic distance. In addition, the research used local spatial autocorrelation. Similarly, Shen and Guo (2014) quantified an urban sustainability index using spatial analysis of global and local autocorrelation.
Neves and partners (2000) explain that the Local Indicator of Spatial Association (LISA) provides a specific value for each object, allowing to identify groups of objects with similar values (clusters), anomalous objects (outliers) and another space regime. Almeida (2012) complements that the local
Moran’s I or Lisa is able to capture local patterns of spatial autocorrelation.
Statistical software packages SPSS20® and Amos were used for CFA application and building the Sustainable Development Index. In addition, Programming in R: A Language and Environment for Statistical Computing (R Core Team, 2008) was used in order to carry out spatial statistics, high-lighting the packages spdep (data of the area), splancs and spatstat (point-pattern analysis). The results show the process of building the SDI and the maps of the social, environmental, economic and institutional inequalities of the municipalities of the State of Ceará, Brazil, showing geographic locations and stages of development.
4. RESULTS
4.1 BUILDING THE SUSTAINABLE DEVELOPMENT INDEX
The statistical analysis of the data seeking to create the SDI started with the application of the CFA, considering all the indicators presented in table 1. In order to ensure the factorial validity of the CFA model, indicators with no significant factorial weight at 5% were withdrawn one by one. Then, indicators of a lower factorial weight were excluded, so that AVE of all dimensions reached values higher than 0.5 (i.e., 0.575 for the social dimension; 0.548 for the environmental; 0.605 for economic; and 0.589 for the institutional dimension), which verified the convergent validity of the CFA model.
The first ten indicators withdrawn were: “Municipal environment council”, “Ratio between the average wage of women and men”, “School enrollment rates in primary education”, “School enrollment rates in basic education”, “Infant Mortality (<1 year old)”, “children born with prenatal care”, “Vacci-nated children under 1 year of age”, “Rate of health units per thousand inhabitants”, “Surface runoff ” and “Degraded areas”. After that, eight other indicators were also withdrawn: “Infant Mortality (<5 years old)”, “Rate of beds per thousand inhabitants”, “Conservation land as % of total area”, “Observed precipitation”, “Commercial Balance”, “School enrollment rates in high school”, “River Basins” and “Inter-municipal connections”. From this procedure, 27 indicators prevailed, representing the four dimensions of sustainability.
In order to assess the discriminant validity of the four dimensions of sustainable development
considered, the R2 between pairs was compared for the dimensions, with the respective AVE. Most
of the comparisons indicated good discriminant validity, with R2 values lower than AVE, except
TABLE 1 SQUARED CORRELATIONS AMONG THE SDI DIMENSIONS
Correlations R2 Correlations R2 Correlations R2 Social Environmental .088 Environmental Institutional .365 Institutional Economic .528
Institutional .691 Economic .044
Economic .869
Source: Calculated in SPSS20® based on research data.
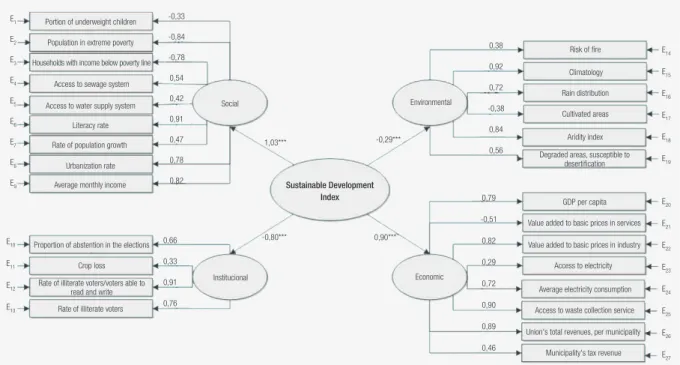
Through the second-order CFA, these dimensions and their indicators were used to estimate factorial weights for calculating the SDI and indexes by dimensions, as shown in figure 1. The social dimension contributes to a positive construction of the index and presents a significant factorial weight of 1.03, constituting the main dimension for the formation of the SDI. Negative weights were observed in the indicators that represent a delay in social development, such as: “households with income below the poverty line”, “population in extreme poverty” and “proportion of underweight children (<2 years old)”. “Indicators with positive weights include components for social development, such as “literacy rate”, “urbanization rate” and “average monthly income”.
FIGURE 1 CONFIRMATORY FACTORIAL ANALYSIS OF SECOND ORDER OF THE SDI AND THE
DIMENSIONS SOCIAL, ENVIRONMENTAL, ECONOMIC AND INSTITUTIONAL FOR THE MUNICIPALITIES OF THE STATE OF CEARÁ, BRAZIL
Portion of underweight children
Population in extreme poverty
Households with income below poverty line
Access to sewage system
Access to water supply system
Literacy rate
Rate of population growth
Urbanization rate
Average monthly income
Proportion of abstention in the elections
Crop loss
Rate of illiterate voters/voters able to read and write
Rate of illiterate voters
Institucional Economic
Social Environmental
Sustainable Development Index
Risk of fire
Climatology
Rain distribution
Cultivated areas
Aridity index
Degraded areas, susceptible to desertification
GDP per capita
Value added to basic prices in services
Value added to basic prices in industry
Access to electricity
Average electricity consumption
Access to waste collection service
Union's total revenues, per municipality
Municipality's tax revenue E14 E15 E16 E17 E18 E19 E20 E21 E22 E23 E24 E25 E26 E27 E1 E2 E3 E4 E5 E6 E7 E8 E9 E10 E11 E12 E13 -0,33 -0,84 -0,78 0,54 0,42 0,91 0,47 0,78 0,82 0,66 0,33 0,91 0,76 0,38 0,92 0,72 -0,38 0,84 0,56 0,79 -0,51 0,82 0,29 0,72 0,90 0,89 0,46 1,03*** -0,80*** -0,29*** 0,90***
Source: Analyzed in Amos based on research data.
The economic dimension has a positive factorial weight of 0.90 and has a significant influence on the formation of the sustainable development index. The indicators that make up this dimension have positive weight, except for the indicator “value added to basic prices in service”. The negative weight can be explained by the trade-off with the indicator “value added to basic prices in industry”, which means that a greater participation of the industry implies in the reduction of the participation of the services.
The institutional dimension has a negative and significant influence on the formation of the SDI, with factorial weight of -0.80. The most influential indicator is “rate of voters able to read and write”, and represents the low citizen participation in political processes. Finally, the environmental dimen-sion presents a significant and negative factorial weight of 0.29. The indicator of greatest influence in this dimension involves “climatology”, and represents the average rainfall of municipalities in the last 30 years.
Table 2 shows the values higher than 0.75 for all composite reliability coefficients and Cronbach’s alphas, indicating good reliability of the SDI and its dimensions.
TABLE 2 RELIABILITY MEASURES OF THE SDI AND ITS DIMENSIONS
Adjustment measures Dimension
SDI Social Environmental Economic Institutional
Composite reliability 0.904 0.918 0.868 0.918 0.839
Cronbach’s alpha 0.796 0.805 0.756 0.871 0.759
Source: Calculated in SPSS20® based on research data.
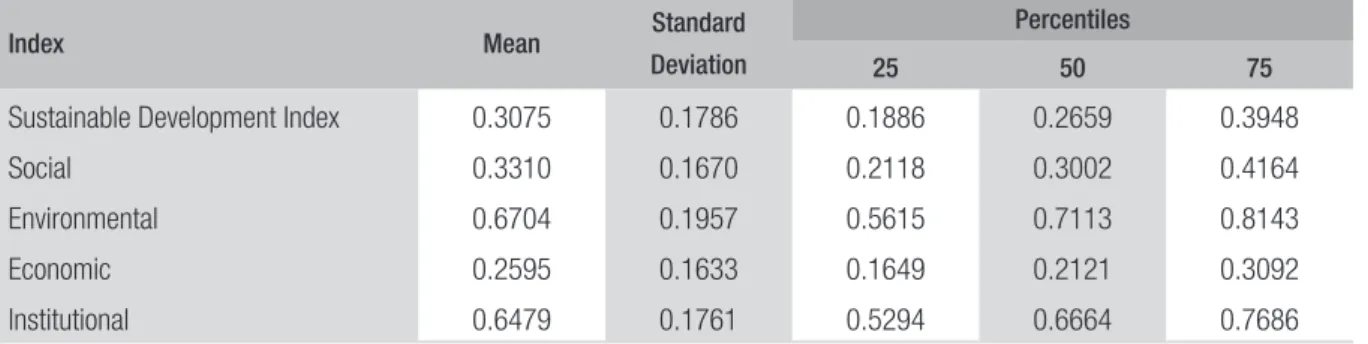
In order to study the SDI and the indexes by the dimension of the sustainable development de-termined based on the CFA, a brief descriptive statistical analysis was carried out and is presented in table 3, followed by its spatial analysis in section 4.2.
TABLE 3 DESCRIPTIVE STATISTIC OF THE SDI AND ITS DIMENSIONS
Index Mean Standard
Deviation
Percentiles
25 50 75
Sustainable Development Index 0.3075 0.1786 0.1886 0.2659 0.3948
Social 0.3310 0.1670 0.2118 0.3002 0.4164
Environmental 0.6704 0.1957 0.5615 0.7113 0.8143
Economic 0.2595 0.1633 0.1649 0.2121 0.3092
Institutional 0.6479 0.1761 0.5294 0.6664 0.7686
It should be noted that the environmental and institutional dimensions have averages above 0.5 and have a negative influence on the SDI, confirming the lack of development in these dimensions. The results also indicate that 75% of the municipalities present low development in the four dimensions.
4.2 SPATIAL MODELING TO MEASURE INEQUALITY IN MUNICIPALITIES OF THE STATE OF CEARÁ
The spatial econometric modeling began with the standardization of the indicators formed by the confirmatory factorial analysis, determining value 1 for the municipality with the highest index and 0 for the municipality with the lowest index. There is evidence of inequality among the municipalities of the state of Ceará, Brazil, according to the geographical position shown in figure 2.
FIGURE 2 GLOBAL SPATIAL ANALYSIS OF THE SUSTAINABLE DEVELOPMENT INDEX AND ITS
DIMENSIONS FOR THE MUNICIPALITIES IN THE STATE OF CEARÁ, BRAZIL
Social
Institutional
Environmental
Economic Sustainable Development
Index
Source: Calculated in R based on research data.
dimension). The most developed municipalities are part of the economic centers (urban and industrial) of the State, with greater industrial presence in the metropolitan regions of Fortaleza, Cariri and Micro region of Sobral.
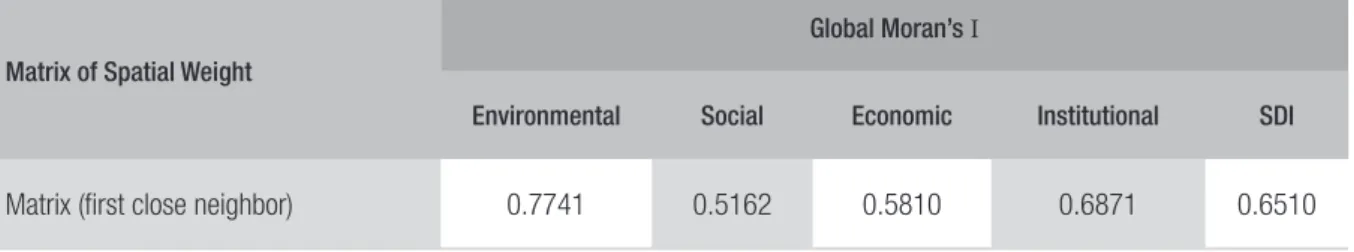
The global Moran’s I identifies the spatial autocorrelation between municipalities. When testing
the matrices of spatial weights that form the global Moran’s I it was identified that the matrix by
geo-graphical distance was the most adequate to observe the associations. The values for the SDI and its environmental, social, economic and institutional dimensions showed a positive association between neighboring municipalities, as shown in table 4. The autocorrelation values indicate a high spatial association between the locations for the analyzed attribute, the value of which is similar between neighboring municipalities.
TABLE 4 GLOBAL MORAN’S I FOR K NEIGHBORS OR DISTANCE
Matrix of Spatial Weight
Global Moran’s I
Environmental Social Economic Institutional SDI
Matrix (first close neighbor) 0.7741 0.5162 0.5810 0.6871 0.6510
Source: Calculated in R based on research data.
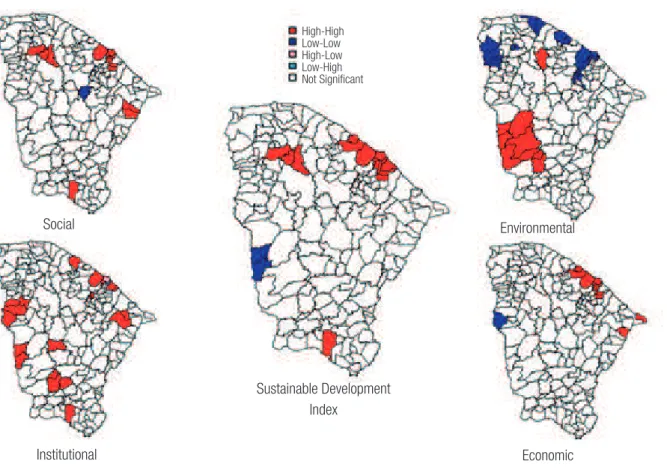
In addition to the information gathered by the global Moran’s I, the local indicator of spatial
association (Lisa), was used as a way of identifying local clusters in the state of Ceará. The Lisa maps analysis (figure 3), shows the groupings of spatial association in the dimensions by the local Moran’s
I with significance of 5%. The key ‘High-High’ is used for positive association between the two
neighboring regions, ‘Low-Low’ for negative association, ‘High-Low’ and ‘Low-High’ are used when the association presents inverse values between neighboring regions.
For the Sustainable Development index, Lisa identified High-High associations in the main urban centers such as in the Metropolitan Region of Fortaleza, Sobral and Cariri. Low-Low associations occur in the municipalities located in the region of Sertão dos Inhamuns. For the Social dimension, Lisa evidenced High-High association in the main municipalities of the state, i.e., in cities with great urban development. A High-High local spatial association was identified in the municipalities of Fortaleza, Maracanaú, Sobral, Caucaia, Eusébio; in the region of Crato and in the region of Sobral. A Low-Low association was identified in the central-western region of the state, the region of Choró.
FIGURE 3 MAPS OF LISA ANALYSIS OF THE SUSTAINABLE DEVELOPMENT INDEX AND ITS DIMENSIONS FOR THE MUNICIPALITIES OF THE STATE OF CEARÁ, BRAZIL
Social
Institutional Economic
Environmental
Sustainable Development Index
High-High Low-Low High-Low Low-High Not Significant
Source: Calculated in R based on research data.
In the economic dimension, the Lisa identified a High-High association in the main municipalities of the State, which are the main urban and economic centers. The Lisa map of the institutional dimension presented High-High and High-Low associations. In the surrounding municipalities encompassing the Metropolitan Region of Fortaleza, the municipalities of Fortaleza and Eusébio presented values below 0.5. The other regions presented High-High association, which indicates need for improvement in the institutional field.
5. DISCUSSION
The research indicated that the public policies implemented in the State of Ceará prioritized the economic and social dimensions. In this context, Tabosa and partners (2008) confirm satisfactory results in cumulative growth and development indexes in the state of Ceará. Manso, Barreto and França (2009) show that between 1995 and 2007, income growth was 19.04% and the number of poor people decreased by 22.8%. However, these values are lower than the performance in the Northeast region of Brazil (in the case of income growth) and lower than the national variation (in the case of the decrease in number of poor people).
The economic dimension of the SDI showed distortions when it comes to income distribution. Evidence of this imbalance was also found in the studies of Macedo, Ferreira and Cípola (2011), Bar-el (2005) and Bar-el and partners (2002). The Lisa analysis confirmed interregional inequalities. Similar results were mentioned by Bar-el and Schwartz (2006), which show that the macroeconomic policy in Ceará did not solve the high levels of poverty and the gaps between the Metropolitan Region of Fortaleza (RMF) and the other municipalities of the rural area of the state. Bar-el and partners (2002) show that only 13 municipalities are responsible for 64.4% of Ceará’s production.
The environmental dimension of the SDI has revealed a high level of vulnerability. Most of the municipalities of the state have a warm semi-arid tropical climate and are in the process of desertification. On the other hand, municipalities with the best results are located in regions with sub-tropical and sub-humid sub-tropical climates, and have areas of environmental protection. The climatic situation, coupled with the precariousness of the income of rural families, corroborates the results of the research by Krol and Bronstert (2007), which identified the potential impacts of climate change on crop yield and crop production.
Following the guidelines of Inácio and partners (2013) and Oliveira, Faleiros and Diniz (2015), the research reinforces the need for changes in the economic structures of the municipalities in the rural areas of the state. Reducing disparity involves developing public policies that meet the needs of the localities and bring balance in terms of regional capacities, raising productivity levels and promoting a process of urbanization with low environmental and social impact.
The academic contributions of this study are similar to the research conducted by Shen and Guo (2014), Andion (2003) and Banos-González and partners (2015). The SDI quantification, based on the calculation of a weighted spatial system of IBGE (2012) and UN (2001) indicators, provided a broad view of the development status quo in the municipalities of Ceará. The SDI reduces the complexity and the conflicts between social, economic, environmental and institutional dimensions. It allows efficient communication between different stakeholders for the elaboration of public policies, urban planning, environmental impact assessment and the establishment of volunteer networks and civil forums.
6. CONCLUSION
The more urbanized areas have a better infrastructure to meet the needs of health, education, energy, water supply and basic sanitation.
In the economic dimension, indicators show better results concentrated in industrialized municipalities or in large urban areas. It is observed that municipalities far from urban areas are based on agriculture, with low added value. In the institutional dimension, low levels of political participation are identified, mainly in the rural areas and municipalities more distant from the main economic regions of the state.
Low values of the SDI confirm the need for a more effective action by the government to provide adequate infrastructure for sustainable development. The maps provide a geo-reference of the specific needs of each region of the state, and allow better assessment of the efficiency of government actions. Spatial analysis confirms a spatial autocorrelation in the development of the municipalities of the state, and associations between neighboring municipalities are identified.
The SDI allows, therefore, to elaborate public policies centered on the joint and associative development of surrounding municipalities. However, Kuyumjian, Moulin and Sant’anna (2014) warn that local development processes, regardless of the size of the municipality, are not consolidated in the short term. According to the authors, it is rare that the government can carry out rigorous planning that results in the accomplishment of goals.
Among the limitations of the study, it was observed the difficulty in the availability of data to allow a more in-depth analysis of the development of the state of Ceará. IBGE is the largest source of data to develop performance indexes. However, some databases are incomplete and do not provide data from municipalities that are not part of the main Brazilian regions and cities.
REFERENCES
ALMEIDA, Eduardo. Econometria espacial aplicada.
Campinas, SP: Alínea, 2012.
ANDION, Carolina. Análise de redes e desenvolvi-mento local sustentável. Rev. Adm. Pública, Rio de Janeiro, v. 37, n. 5, p. 1033-1054, Sept./Oct. 2003.
ARAÚJO, Jair A. Pobreza, desigualdade e crescimento econômico: três ensaios em modelos de painel dinâ-mico. Doctoral thesis — Curso de Pós Graduação em Economia, Universidade Federal do Ceará, Fortaleza, 2009.
BANOS-GONZÁLEZ, Isabel; MARTÍNEZ-FER-NÁNDEZ, Julia; ESTEVE-SELMA, Miguel Á. Dyna-mic integration of sustainability indicators in insular socio-ecological systems. Ecological Modelling, v. 306, p. 130-144, 2015.
BAR-EL, Raphael. Desenvolvimento econômico
regional para a redução da pobreza e desigualdade: o modelo do Ceará. Fortaleza: Secretaria do Desen-volvimento Local e Regional, 2005.
BAR-EL, Raphael et al. Reduzindo a pobreza através do desenvolvimento econômico do interior do Ceará. Fortaleza: Edições Iplance, 2002.
BAR-EL, Raphael; SCHWARTZ, Dafna. Regional development as a policy for growth with equity: the State of Ceara (Brazil) as a model. Progress in Planning, v. 65, p. 131-199, 2006
BARROS, Alexandre R. Desigualdades regionais no
Brasil: natureza, causas, origens e soluções. Rio de Janeiro: Elsevier, 2011.
BECKER, William et al. Weights and importance in composite indicators: closing the gap. Ecological Indicators, v. 80, p. 12-22, 2017.
CHAMARET, Aurelie; O’CONNOR, Martin; RÉCOCHÉ, Gilles. Top-down/bottom-up approach for developing sustainable indicators for mining: application to the Arlit uranium mines (Niger).
International Journal of Sustainable Development, v. 10, n. 1-2, p. 161-174, 2007.
CHELLI, Francesco M.; CIOMMI, Mariateresa; GIGLIARANO, Chiara. The index of sustainable economic welfare: a comparison of two Italian re-gions. Procedia-Social and Behavioral Sciences, v. 81, p. 443-448, 2013.
COLLIS, Jill; HUSSEY, Roger. Pesquisa em
adminis-tração: um guia prático para alunos de graduação e pós-graduação. 2. ed. Porto Alegre: Bookman, 2005.
COOK, David et al. Measuring countrie’s environ-mental sustainability performance — the develop-ment of a nation-specific indicator set. Ecological Indicators, v. 74, p. 463-478, 2017.
CORNESCU, Viorel; ADAM, Roxana. Considera-tions regarding the role of indicators used in the analysis and assessment of sustainable development in the E.U. Procedia Economics and Finance, v. 8, p. 10-16, 2014.
DI BELLA, Enrico et al. Wellbeing and sustainable
development: a multi-indicator approach.
Agri-culture and Agricultural Science Procedia, v. 8, p. 784-791, 2016.
EMBRAPA. Análise espacial de dados geográficos.
Planaltina, DF: Embrapa Cerrados, 2004.
FLORIDI, Matteo et al. An exercise in composite indicators construction: assessing the sustainability of Italian regions. Ecological Economics, v. 70, p. 1440-1447, 2011.
FUJIWARA, Akimasa et al. Evaluating sustainabi-lity of urban development in developing countries incorporating dynamic cause-effect relationships
over time. Journal of the Eastern Asia Society for
Transportation Studies, v. 6, p. 4349-4364, 2005.
GAN, Xiaoyu et al. When to use what: methods for weighting and aggregating sustainability indicators.
Ecological Indicators, v. 81, p. 491-502, 2017.
HAINING, Robert P. Spatial data analysis: theory
and practice. Cambridge: Cambridge University Press, 2003.
HAIR, Joseph F. et al. Análise multivariada de dados. 5. ed. Porto Alegre: Bookman, 2005.
HSU, Angel. Environmental performance index: tech-nical report. New Haven, CT: Yale University, 2016.
IBGE. Indicadores de Desenvolvimento Sustentável. IBGE, 2012. Available at: <www.ibge.gov.br>. Accessed om: 21 Feb. 2013.
INÁCIO, Raoni de Oliveira et al. Desenvolvimento regional sustentável: abordagens para um novo
paradigma. Desenvolvimento em Questão, v. 11, n.
JAHAN, Selim. Human development report, technical report. New Haven, CT: Yale University, 2015.
KATES, Robert W. et al. Sustainability science. Scien-ce, v. 292, n. 5517, p. 641-642, 2001.
KROL, Maarten S.; BRONSTERT, Axel. Regional integrated modelling of climate change impacts on natural resources and resource usage in semi-arid Northeast Brazil. Environmental Modelling & Sof-tware, v. 22, n. 2, p. 259-268, 2007.
KUYUMJIAN, Rodrigo; MOULIN DE SOUZA, Eloisio; SANT’ANNA, Sérgio R. de. Uma análise a respeito do desenvolvimento local: o empreende-dorismo social no Morro do Jaburu-Vitória (ES), Brasil. Rev. Adm. Pública, Rio de Janeiro, v. 48, n. 6, p. 1503-1524, Nov./Dec. 2014.
MACEDO, Marcelo A. da S.; FERREIRA, Antônio F. R.; CÍPOLA, Fabricio C. Análise do nível de sustentabilidade das unidades federativas do Brasil e de suas capitais: um estudo sob as perspectivas
econômica, social e ambiental. Environmental &
Social Management Journal/Revista de Gestão Social e Ambiental, v. 5, n. 3, p. 73-89, 2011.
MANSO, Carlos A.; BARRETO, Flávio A. F. D.; FRANÇA, João M. S. O crescimento econômico no Ceará foi a favor dos mais pobres? Evidências comparativas com o Nordeste e o Brasil a partir do desempenho do mercado de trabalho nas zonas urbanas, metropolitanas e rurais. In: CARVALHO, Eveline B. S.; HOLANDA, Marcos C.; BARBOSA,
Marcelo P. Economia do Ceará em debate 2008.
For-taleza, CE: Ipece, 2009. p. 159-177.
MARÔCO, João. Análise de equações estruturais:
fundamentos teóricos, software & aplicações. Perô Pinheiro: Report Number, Lda, 2010.
MOLDAN, Bedřich; JANOUŠKOVÁ, Svatava; HÁK, Tomáš. How to understand and measure environ-mental sustainability: indicators and targets. Ecolo-gical Indicators, v. 17, p. 4-13, 2012.
NEUMAYER, Eric. On the methodology of Isew, GPI and related measures: some constructive sugges-tions and some doubt on the ‘threshold’ hypothesis.
Ecological Economics, v. 34, n. 3, p. 347-361, 2000.
NEVES, Marcos C. et al. Análise exploratória es-pacial de dados socioeconômicos de São Paulo. Salvador: GIS Brasil2000, 2000.
OLIVEIRA, Lya C. P. de; FALEIROS, Sarah M.; DINIZ, Eduardo H. Sistemas de informação em políticas sociais descentralizadas: uma análise sobre a coordenação federativa e práticas de gestão. Rev. Adm. Pública, Rio de Janeiro, v. 49, n. 1, p. 23-46, Jan./Feb. 2015.
PISSOURIOS, Ioannis A. An interdisciplinar study on indicators: a comparative review of quality-of-life, macroeconomic, environmental,
welfare and sustainability indicators. Ecological
Indicators, v. 34, p. 420-427, 2013.
R CORE TEAM. R:a language and environment for
statistical computing. R Foundation for Statistical Computing, Viena, Áustria, 2014. Available at: <www.R-project.org/>. Accessed on: 21 Feb. 2013.
SEGNESTAM, Lisa. Indicators of environment and
sustainable development: theories and practical expe-rience. Washington, D.C.: The International Bank for Reconstruction and Development; The World Bank, 2002. (Environmental Economics Series, n. 89).
SHEN, Li; GUO, Xulin. Spatial quantification and pattern analysis of urban sustainability based on a subjectively weighted indicator model: a case study
in the city of Saskatoon, SK, Canada. Applied
Geo-graphy, v. 53, p. 117-127, 2014.
SINGH, Rajesh Kumar et al. An overview of
sus-tainability assessment methodologies. Ecological
Indicators, v. 15, n. 1, p. 281-299, 2012.
SOARES, Warley R. F. Desigualdade de renda no Ceará: uma análise a partir do emprego formal. In: HOLANDA, Marcos C.; CARVALHO, Eveline B. S.;
BARBOSA, Marcelo P. Economia do Ceará em debate
2007. Fortaleza, CE: Ipece, 2008. p. 62-78.
TABOSA, Francisco J. S.; MAYORGA, Ruben D.; AMARAL FILHO, Jair do. Desigualdade de renda: uma análise das microrregiões do estado do Ceará: In: HOLANDA, Marcos C.; CARVALHO, Eveline
B. S.; BARBOSA, Marcelo P. Economia do Ceará em
debate 2007. Fortaleza, CE: Ipece, 2008. p. 175-195.
TASAKI, Tomohiro; KAMEYANA, Yasuko. Sustai-nability indicators: are we measuring what we ought to measure? Global Environmental Research, v. 19, p. 147-154, 2015
TALBERTH, John; COBB, Clifford; SLATTERY,
Noah. The genuine progress indicator 2006.
UN. United Nations. Department of Economic.
Indicators of sustainable development: guidelines and methodologies. New York: United Nations Publications, 2001.
UN. United Nations. Economics and Social Council.
Report of the inter-agency and expert group on sus-tainable development goal indicators, E/CN/3.2016/2. New York: United Nations, 2016.
João Felipe Barbosa Araripe Silva
Master in Management and Controllership from Federal University of Ceará (UFC). E-mail: felipe.araripesilva@gmail.com.
Sílvia Maria Dias Pedro Rebouças
PhD in Statistics and Operational Research from the University of Lisbon, Professor at the Faculty of Econo-mics, Administration, Actuarial and Accounting at UFC. E-mail: smdpedro@gmail.com.
Mônica Cavalcanti Sá de Abreu
PhD in Production Engineering from the Federal University of Santa Catarina (UFSC), Associate Professor at the Faculty of Economics, Administration, Actuarial and Accounting at UFC. E-mail: mabreu@ufc.br
Maria da Conceição Rodrigues Ribeiro