Original article
RBAFSPhysical Activity and HealthSOCIEDADE BRASILEIRA DE ATIVIDADE FÍSICA E SAÚDE
RBAFS
Revista Brasileira de Atividade Física & Saúde
SOCIEDADE BRASILEIRA DE ATIVIDADE FÍSICA E SAÚDE
Brazilian Journal of Physical Activity and Health
Rev Bras Ativ Fis Saúde p. 573-584 DOI: http://dx.doi.org/10.12820/2317-1634.2012v17n6p573
1 Escola Superior de Educação Física, Universidade Federal de Pelotas, RS, Brasil 2 Grupo de Estudos em Epidemiologia da Atividade Física, Universidade Federal de Pelotas, RS, Brasil
3 Programa de Pós-graduação em Epidemiologia, Universidade Federal de Pelotas, RS, Brasil
4 MRC Epidemiology Unit, Institute of Metabolic Science, Cambridge, UK 5 Childhood Nutrition Research Centre, UCL Institute of Child Health, UK
Objectively measured physical activity
and body composition indices in Brazilian
adolescents
Atividade física mensurada objetivamente
e índices de composição corporal em
adolescentes Brasileiros
Felipe F Reichert1,2 Ana MB Menezes3 Pedro C Hallal1,2 Ulf Ekelund4 Jonathan CK Wells5 AbstractThe aim of the study was to explore the association between objectively measured physical activity and body composition indices in 13-year old adolescents living in country undergoing rapid nutritional transition. A population-based cross-sectional study nested within the 1993 Pelotas (Brazil) Birth Cohort was undertaken. A total of 457 boys and girls (80.5% of the target sample, 52.1% boys) participated in the study. Physical activity was measured by the Actigraph accelerometer for 5 consecutive days and expressed as total physical activity (i.e. average intensi-ty, counts per minute) and time (min per day) spent at moderate and vigorous intensity activity. The outcomes investigated were sum of triceps and subscapular skinfolds, waist circumference, waist-to-hip ratio and waist-to-thigh ratio. After adjustment for sex, socioeconomic status, age, Tanner stage of sexual maturation, diet pattern, height, and birth weight, time (min/day) spent at vigorous intensity activity was inversely associated with waist circumference and sum of skinfolds. A one minute/day increase in vigorous intensity physical activity was associated, on average, with a reduction of 0.15cm in waist circumference (p=0.007) and 0.20mm in sum of skinfold thicknesses (p=0.02). These associations were stronger in boys than in girls. Total activity and time spent in moderate intensity physical activities were not associated with any of the outcomes in the adjusted analyses. Vigorous physical activity appears to have the strongest association with body composition. Preventive efforts aimed to decrease the obesity in adoles-cents may be more successful if they focus on vigorous intensity, instead of moderate intensity physical activities.
Keywords
Brazil; Accelerometry; Adiposity; Body fat; Motor activity; Activity monitors.
Resumo
O objetivo deste estudo foi explorar a associação entre atividade física mensurada objetivamente e índi-ces de composição corporal em adolescentes de 13 anos de idade residentes em um país sofrendo rápida transição nutricional. Um estudo transversal de base populacional aninhado a Coorte de Nascimentos de 1993 de Pelotas (Brasil) foi realizado. Um total de 457 meninos e meninas (80,5% da população alvo; 52,1% meninos) participaram do estudo. Atividade física foi mensurada pelo acelerômetro Actigraph por 5 dias consecutivos e expressa como atividade física total (intensidade média, counts por minuto) e tempo (min/dia) em atividades moderadas e vigorosas. Os desfechos investigados foram somatório de dobras triciptal e subescapular, circunferência da cintura, razão cintura-quadril e razão cintura-coxa. Após ajustes para sexo, nível econômico, idade, estágio de maturação sexual de Tanner, padrão de di-eta, estatura e peso ao nascer, o tempo (min/dia) em atividades vigorosas foi inversamente associado à circunferência da cintura e somatório das dobras. O aumento de um minuto por dia no tempo em atividades vigorosas foi associado, em média, com uma redução de 0,15cm na circunferência da cintura (p=0,007) e 0,20mm no somatório das dobras (p=0,02). Estas associações foram mais fortes nos meninos comparado as meninas. Atividade física total e tempo em atividades moderadas não foram associados com nenhum dos desfechos na análise ajustada. Atividades vigorosas parecem ter a associação mais forte com composição corporal. Esforços preventivos que visem diminuir a obesidade em adolescentes podem ter mais sucesso se focarem em atividades vigorosas ao invés de atividades de intensidade moderada.
Palavras-chave
INTRODUCTION
Adolescent obesity has increased not only in developed societies, but also in some low- and middle-income countries. In Brazil the prevalence of overweight adoles-cents increased from 2.6% to 11.8% among boys and from 5.8% to 15.3% among girls during the period from 1975 to 1997 1. The consequences of total and central
fat accumulation on health outcomes in young people have been well described 2.
Furthermore, obesity developed in infancy and adolescence tracks into adulthood 2.
Fat accumulation is ultimately a result of chronic positive energy balance. Therefore, physical activity and energy expenditure associated with this behaviour may play a key role. Surprisingly the literature on this subject is conflicting, as some observational 3, 4 and even experimental studies 5 showed no effects of
phys-ical activity on body composition of adolescents. Recent reviews have identified a number of shortcomings in the literature which might contribute to the inconsis-tency among studies 6, 7. In particular, significant limitations derive from the poor
accuracy of the measurements of exposure and outcome variables.
Regarding body composition, body mass index (BMI) is the most frequent out-come used in large-scale studies 7. Although this index is widely used in pediatric
epidemiological research, due to the ease with which the required measurements of weight and height can be acquired in large samples, it has been shown that for a given BMI, a wide range of fat mass may be observed 8, limiting the validity of
BMI as a body composition measure. Furthermore, the association between BMI and physical activity may be difficult to evaluate because of the antagonistic effects of physical activity on fat mass and fat-free mass. Other simple anthropometric measures such as circumferences or skinfolds taken at specific anatomical points may provide more reliable information on body composition. For example, waist circumference is highly correlated with abdominal fat determined by magnetic resonance imaging in adolescents 9, 10.
Accurate measurement of physical activity level in adolescents is also challeng-ing. To date, most data on associations between physical activity and body compo-sition come from studies where physical activity was measured by questionnaires 11.
However, many adolescents are likely to be unable to accurately report their phys-ical activity level. More recently, data from objectively measured physphys-ical activity (i.e. motion sensors) have emerged and results from these studies are important because they are less prone to measurement error. Recent studies have investigat-ed the association between physical activity measurinvestigat-ed by accelerometer and body composition 12, 13, and these studies have been conducted in western industrialized
settings, where the majority of physical activity comprises leisure-time exercise or school-organized physical education. While one could argue that the physiologi-cal effect of a given activity will have the same effect on fatness wherever an ado-lescent lives, it should be noted that the physical activities performed in rich and poorer countries are markedly different. In summary these studies show an inverse association between physical activity level and body fat indicators, which might be intensity-dependent 12-14, however the association between different
sub-compo-nents of physical activity (i.e. time spent sedentary, at light, moderate and vigorous intensity activity) with body fat in adolescents from less economically developed populations remains unclear. The answer to this is important for preventive action and for public health purposes when establishing evidence-based physical activity recommendations aimed to improve body composition.
Therefore, the aim of the present study was to explore the association between physical activity measured by accelerometers and body composition indices in a population-based sample of adolescents living in an area rapidly undergoing nu-tritional transition.
METHODS
Study design and participants
The present study is a cross-sectional study nested within the 1993 Pelotas (Bra-zil) Birth Cohort. Data collection was carried out from August 2006 to January 2007. A detailed description of the cohort, its design, methods and measurements taken at each follow-up until 2004 is available elsewhere 15 and another recent
publication has focused on the methodological aspects of the present follow-up 16.
In brief, all 5249 newborns delivered in Pelotas’ hospitals in 1993 constitute the cohort and sub-samples of the cohort were reexamined at age one, three and six months and at one and four years. Hospital births comprised more than 99% of all births in the city in 1993. In 2004, all individuals belonging to the cohort were eligible for another follow-up and 87.5% could be traced. Five hundred and sixty eight boys and girls who were examined at all five previous follow-ups comprise the target sample of the present study. These individuals show no substantial dif-ferences from the original cohort in terms of sex (p=0.26) and birth weight (mean difference 66g), although the difference regarding birth weight is statistically sig-nificant (p=0.01). Compared to data from the entire 2004 follow-up, these indi-viduals had similar prevalence of self-reported physical inactivity (<300min/wk of moderate to vigorous intensity activity) but were slightly more overweight than the remaining cohort members (25.2% versus 23.2%; p=0.005). The Ethical Com-mittee of the Federal University of Pelotas Medical School approved the study protocol and written informed consent was obtained from parents or guardians
Anthropometric measures
Triceps and subscapular skinfolds were measured to the nearest 0.1mm using Scientific Cescorf® calipers following the recommendations of Lohman 17. Three
measurements were taken at each site and the average of these was calculated and used in analyses. Waist circumference was measured at the smallest circumference midway between the lower rib margin and iliac crest; hip circumference was mea-sured at the maximal circumference over the buttocks, and thigh circumference at the mid-point between the iliac crest and mid-patella. All circumferences were taken using a flexible steel metric tape to the nearest 0.5cm. Data were collected at the adolescent’s home by research assistants specifically trained by a highly experienced anthropometrist. All research assistants achieved the criteria of the National Center for Health Statistics (United States) for intra- (maximal error allowed = 1.83 and 0.80 mm for subscapular and triciptal skinfolds, respectively) and inter-interviewer (maximal error allowed = 1.53 and 1.89 mm for subescap-ular and triciptal skinfolds, respectively) skinfold measurement errors 18 and had
previous experience in face-to-face interviews with adolescents. During the train-ing sessions, ten adolescents of comparable age to the cohort members were mea-sured. The mean intra-and inter-interviewer errors for the skinfold measurements in these subjects were 0.35 mm (sd=0.17) and 0.60 mm (sd=0.15).
Outcomes
Based on these anthropometric variables the following outcomes were included in our analyses: waist circumference (cm), sum of triceps and subscapular skin-folds (mm), and waist-to-hip and waist-to-thigh ratios 17. Whereas a large waist
circumference increases cardiovascular risk 19, having an increased thigh
circum-ference has been shown to be protective against type 2 diabetes and cardiovascular disease in adults 20. Combining information from these two body regions, sagittal
diameter adjusted for thigh girth appears most strongly associated with cardiovas-cular risk in adults 21.
Physical activity assessment
A detailed description of physical activity assessment is available elsewhere 16.
Free-living physical activity was assessed with the Actigraph accelerometer (mod-el GT1M, Actigraph Inc, Fl, US) for 5 consecutive days (Wednesday to Monday). Output from this motion sensor is significantly correlated with physical activity energy expenditure measured during free-living conditions by the doubly labeled water method in children and adolescents 22, 23. Activity data from the
accelerom-eter were recorded every 5 seconds. A customised program (MAHUffe; www. mrc-epid.cam.ac.uk) was used for analysis of the Actigraph data. Only days on which >600min of data were recorded were included in further analyses. The phys-ical activity variables investigated were total counts divided by registered time (counts per minute (cpm)), time (min/day) spent sedentary (<100cpm), time spent at light intensity activities (100-2000cpm), time spent at moderate intensity phys-ical activity (MPA, 2001-3999 cpm) and time spent at vigorous intensity physphys-ical activity (VPA, ≥4000 cpm). This intensity classification is in accordance with pre-vious studies in young people 12, 24.
Potential confounding factors
Several factors were considered as potential confounders of the associations under study. These factors are described below:
Diet
Consumption of fiber and fat was investigated by the Block food frequency ques-tionnaire 25. This questionnaire collects information on the consumption of 15
fat-rich foods (hamburgers, beef steaks/roasts, fried chicken, hot-dog, ham, may-onnaise, margarine/butter, eggs, bacon, cheese, integral milk, fried potatoes, pop-corn, ice-cream, bread/rolls/ crackers) and 12 fiber-rich foods (orange juice, fruits, salad, potato (not fried), dried beans, other vegetables, cereals, grain-bread, white bread, soda, diet soda, candies/dessert) within the last year.
Socioeconomic status
Socioeconomic status was estimated at the 2004 follow-up according to the Bra-zilian Criterion of Economic Classification. This classification takes into account the number of specific household assets such as TV, DVD, radios, vehicles, and freezer, presence of domestic servants and education of the head of the family. Individuals were categorized into one of five categories, from A (wealthiest) to E.
Sexual maturity
imag-es reprimag-esenting the different Tanner’s stagimag-es of maturation were primag-esented to the adolescent and he/she was instructed to mark the one that most closely matched with his/her appearance. This strategy has been used in other epidemiological studies with no evidence of bias 26. Pubertal stage was based on the amount of
pubic hair and stage of genital development. Girls were also questioned whether they already had attained menarche or not.
Height
Skinfolds and waist circumference are correlated with height 27, so we included
this variable as a potential confounding factor in the multivariable models. Height was measured without shoes to the nearest 0.1cm using a portable stadiometer.
Birth weight
Low birth weight has been linked with adverse health outcomes in adolescence, including both lean mass and abdominal adiposity 28. Therefore, we considered
birth weight as a possible confounder of the association between physical activity and body composition. Birth weight was measured by a trained research assistant in the hospitals using a calibrated scale within a few hours after delivery. This strategy was chosen because bias from the hospitals’ staff measurements was a concern.
Statistics
We tested sex-interaction through linear regression and all the p values for the interaction term were higher than 0.14. However, we present both whole sample and sex stratified analyses because the data suggested some differences between boys and girls. Differences between boys and girls were tested using T tests for continuous variables and qui-square tests for categorical ones.
Simple and multiple linear regressions for the whole sample and stratified by sex were run to test the association between sub-components of physical activity (accelerometers total cpm; time spent in MPA and time spent in VPA) and body composition variables (outcomes). Three multivariable models were built for the whole sample analysis. The first model included only socioeconomic status as a covariate, while the second model included sex. The third model included socio-economic status, sex, age, Tanner stage of sexual maturation, diet pattern (i.e. fat and fibers scores), height, and birth weight. In the sex-stratified analyses, the mul-tivariable model included all variables of the third model (except sex). Diagnostics of the final models were verified by the examination of the residuals, homoscedas-ticity and collinearity (by checking the Variance Inflation Factor, which must be around 1 for the full model and below 10 for each variable in the model). The re-gression coefficients shall be interpreted as the mean change in the outcome (in its unit of measurement) according to every change in the unit of measurement of the exposure. For example, considering vigorous-intensity activity (min/day) as the ex-posure variable and waist circumference (cm) as the outcome, a regression coeffi-cient of -0,15 means that for each extra minute/day spent with vigorous-intensity physical activities, the waist circumference is decreased, on average, by 0,15cm.
We also calculated the average of waist circumference and sum of skinfold thickness according to quintiles of minutes per day spent in VPA. The percentage of individuals who practiced ≥60min/day of at least moderate intensity activities is described.
All analyses were performed using Stata 9.2 and a p value < 0.05 was consid-ered as statistically significant.
RESULTS
Out of the 568 individuals eligible to participate in the study, 511 were inter-viewed and 457 (80.5% of the target sample, 52.1% boys) provided valid data on physical activity. Over 90% of individuals wore the accelerometer for two or more days. Individuals who did not provide valid physical activity data did not differ significantly from the remaining sample in terms of current weight (p=0.42), height (p=0.79), and sum of triceps and subscapular skinfolds (p=0.52). Table 1 shows a description of the sample in terms of socio-demographic, sexual maturity, and dietary variables. Most of participants were aged 13 years (84.3%) and 43.6% belonged to categories D and E (the lowest one) of socioeconomic status.
Table 1 – Socio-demographic characteristics, sexual maturity indicators and dietary habits of the sample. Whole sample n (%) Boys n (%) Girls n (%) Sex Boys 265 (51.9) - Girls 246 (48.1) - -Age (years) 12 77 (15.1) 39 (14.7) 38 (15.5) 13 431 (84.3) 224 (84.5) 207 (84.1) 14 3 (0.6) 2 (0.8) 1 (0.4) Socioeconomic level A (highest) 16 (3.2) 9 (3.4) 7 (2.9) B 93 (18.3) 55 (20.8) 38 (15.6) C 177 (34.9) 88 (33.3) 89 (36.6) D 187 (36.9) 97 (36.7) 90 (37.0) E 34 (6.7) 15 (5.7) 19 (7.8)
Tanner maturation stage for amount of hair in genitals
II 57 (11.3) 31 (12.0) 26 (10.6)
III 118 (23.4) 105 (40.7) 13 (5.3)
IV 271 (53.8) 116 (45.0) 155 (63.0)
V 58 (11.5) 6 (2.3) 52 (21.1)
Tanner maturation stage for size and shape of genitals
I 15 (3.1) 13 (5.3) 2 (0.8) II 43 (8.8) 27 (11.0) 16 (6.6) III 126 (25.8) 65 (26.5) 61 (25.0) IV 224 (45.8) 92 (37.6) 132 (54.1) V 81 (16.6) 48 (19.6) 33 (13.5) Menarche Yes - - 189 (76.8) No - - 57 (23.2)
Low consumption of fiber in diet
Yes 70 (13.7) 35 (13.2) 35 (14.2)
No 441 (86.7) 230 (86.8) 211 (85.8)
High consumption of fat in diet
Yes 260 (50.9) 134 (50.6) 126 (51.2)
Table 2 shows a description of the sample regarding the physical activity and body composition variables. Accumulated time (min/day) spent at MPA and VPA was significantly higher in boys than girls. In contrast, boys had lower values of skinfolds in comparison to girls. Waist circumference and to-hip and waist-to-thigh ratios were significantly higher in boys than girls.
Table 2 –Descriptive analyses of physical activity and body composition data. Whole sample (n=457) Boys (n=238) Girls (219) p-valuea Physical activity related-variables
Mean days wearing the accelerometer 4.1 4.2 4.0 0.009 Mean time spent at sedentary activities
(min.day-1)
660 660 661 0.97
Mean time spent at moderate intensity activities (min.day-1)
63 69 58 <0.001
Mean time spent at vigorous intensity activities (min.day-1)
9 11 7 <0.001
Total counts 396511 436924 352592 <0.001
Counts.min-1 428 463 391 <0.001
Percentage of individuals who prac-ticed ≥60min.day-1 of moderate to vigorous intensity activities
61.3% 69.8% 52.1% <0.001
Body composition related-variables
Mean triceps skinfold (mm) 14.9 13.1 16.9 <0.001 Mean subscapular skinfold (mm) 10.6 9.3 12.0 <0.001 Mean waist circumference (cm) 68.6 69.5 67.7 0.02 Mean hip circumference (cm) 87.3 85.5 89.2 <0.001 Mean thigh circumference (cm) 47.1 46.2 48.1 <0.001
Waist-to-hip ratio 0.79 0.81 0.76 <0.001
Waist-to-thigh ratio 1.46 1.51 1.41 <0.001
a T tests for comparison between sexes.
Crude and adjusted regression coefficients for the associations between physi-cal activity variables with body composition outcomes are shown in Table 3 (whole sample) and Table 4 (stratified by gender). Overall, VPA was more strongly asso-ciated with the outcomes than MPA was. Table 3 shows that vigorous intensity physical activity was significantly and inversely associated with waist circumfer-ence and sum of skinfolds in both crude and adjusted analyses, whereas moderate intensity activity and accelerometer counts/minute were not associated with any of the outcomes in the adjusted analyses (models 3). A one minute increase in vig-orous intensity physical activity was associated with a reduction of 0.15cm in waist circumference. The association between sum of skinfolds and vigorous intensity physical activity was attenuated after adjustment for the potential confounders (mainly due to the sex variable). Further, all physical activity variables were sig-nificantly and directly associated with waist-to-hip and waist-to-thigh ratios in the crude analyses, but not after adjustments for confounding factors. Time spent at sedentary or at light intensity activity were not significantly associated with any of the outcomes in crude or adjusted analyses. No significant interaction between physical activity variables with sex was observed for any of our analyses.
In the gender-stratified analyses (Table 4), most of the associations were non-significant. In fact, none of the crude or adjusted analyses were statistically
Table 3 – Crude and adjusted regression coefficients (standard error) of the association between physical activity and body composition indices (whole sample).
Accelerometer
counts/min p value
Moderate activities
(min/day) p value
Vigorous
Activities (min/day) p value Circumference (cm) Waist crude -0.002 (0.003) 0.42 -0.001 (0.01) 0.94 -0.15 (0.05) 0.007 Waist model 1 -0.0008 (0.003) 0.76 0.009 (0.01) 0.53 -0.14 (0.05) 0.009 Waist model 2 -0.003 (0.003) 0.18 -0.007 (0.01) 0.62 -0.20 (0.06) <0.001 Waist model 3 0.009 (0.003) 0.75 0.02 (0.01) 0.18 -0.15 (0.06) 0.007 Ratios Waist-to-hip crude 0.00007 (0.00002) <0.001 0.0004 (0.0001) <0.001 0.001 (0.0004) <0.001 Waist-to-hip model 1 0.00007 (0.00002) <0.001 0.0004 (0.0001) <0.001 0.001 (0.0004) 0.001 Waist-to-hip model 2 0.00004 (0.00002) 0.03 0.0002 (0.00009) 0.006 0.0002 (0.0003) 0.56 Waist-to-hip model 3 0.00001 (0.00002) 0.39 0.0001 (0.00009) 0.11 -0.0001 (0.0004) 0.76 Waist-to-thigh crude 0.0001 (0.00004) 0.008 0.0005 (0.0002) 0.02 0.002 (0.0008) 0.01 Waist-to-thigh model 1 0.00009 (0.00004) 0.02 0.0004 (0.0002) 0.05 0.002 (0.0008) 0.02 Waist-to-thigh model 2 0.00002 (0.00003) 0.49 0.0001 (0.0002) 0.46 -0.0002 (0.0007) 0.82 Waist-to-thigh model 3 -0.00002 (0.00004) 0.53 -0.00007 (0.0002) 0.72 -0.0006 (0.0008) 0.38 Skinfold (mm) TR + SB crude -0.007 (0.004) 0.07 -0.03 (0.02) 0.28 -0.39 (0.08) <0.001 TR + SB model 1 -0.005 (0.004) 0.26 -0.008 (0.02) 0.75 -0.38 (0.08) <0.001 TR + SB model 2 -0.002 (0.004) 0.58 -0.0006 (0.02) 0.98 -0.28 (0.09) 0.002 TR + SB model 3 0.004 (0.004) 0.36 0.04 (0.02) 0.11 -0.20 (0.09) 0.02 TR + SB = sum of triceps (TR) and subscapular (SB) skinfolds. Model 1 is adjusted for socioeconomic status. Model 2 is adjusted for sex. Model 3 is adjusted for sex, socioeconomic status, age, Tanner stage of sexual maturation, diet pattern, height, and birth weight.
Table 4 – Crude and adjusteda regression coefficients (standard error) of the association between physical activity and body composition indices in boys and girls.
BOYS GIRLS Accelerom-eter counts/ min p Moderate activities (min/day) P Vigorous Activities (min/day) p Acceler-ometer counts/min p Moderate activities (min/day) p Vigorous Activities (min/day) p Circumferences (cm) Waist crude -0.007 (0.003) 0.05 -0.03 (0.02) 0.11 -0.21 (0.07) 0.002 0.001 (0.004) 0.76 0.02 (0.02) 0.28 -0.18 (0.10) 0.09 Waist adjusted 0.002 (0.003) 0.51 0.02 (0.02) 0.34 -0.09 (0.06) 0.17 0.003 (0.004) 0.50 0.02 (0.02) 0.28 -0.15 (0.10) 0.15 Ratios Waist-to-hip crude 0.00004 (0.00002) 0.03 0.0003 (0.0001) 0.007 0.0004 (0.0003) 0.23 0.00003 (0.00003) 0.26 0.0002 (0.0002) 0.18 -0.0003 (0.0007) 0.67 Waist-to-hip adjusted 0.00002 (0.00002) 0.23 0.0002 (0.0001) 0.06 0.0002 (0.0004) 0.53 0.00001 (0.00003) 0.61 0.0001 (0.0002) 0.53 -0.0003 (0.0007) 0.61 Waist-to-thigh crude -0.000004 (0.00004) 0.93 0.00007 (0.0002) 0.78 -0.0003 (0.0008) 0.74 0.00007 (0.00006) 0.25 0.0002 (0.0003) 0.43 0.00009 (0.001) 0.95 Waist-to-thigh adjusted -0.00006 (0.00005) 0.22 -0.0002 (0.0003) 0.53 -0.0009 (0.0009) 0.37 0.00003 (0.00006) 0.66 0.00006 (0.0003) 0.84 -0.0004 (0.001) 0.75 Skinfold (mm) TR + SB crude -0.006 (0.005) 0.27 -0.03 (0.03) 0.30 -0.30 (0.11) 0.005 -0.006 (0.005) 0.27 0.04 (0.03) 0.23 -0.22 (0.16) 0.17 TR + SB adjusted 0.003 (0.006) 0.59 0.02 (0.03) 0.60 -0.17 (0.11) 0.14 0.009 (0.006) 0.15 0.06 (0.03) 0.09 -0.12 (0.15) 0.43 TR + SB = sum of triceps (TR) and subscapular (SB) skinfolds
significant for girls. In boys, the time spent in vigorous activity was significantly and inversely associated with waist circumference and skinfolds in the crude analyses. However, the association between waist circumference and vigorous activities was no longer significant (p=0.17) in the adjusted analyses, and the association between vigorous intensity activity with skinfold thicknesses presented a p value of 0.14.
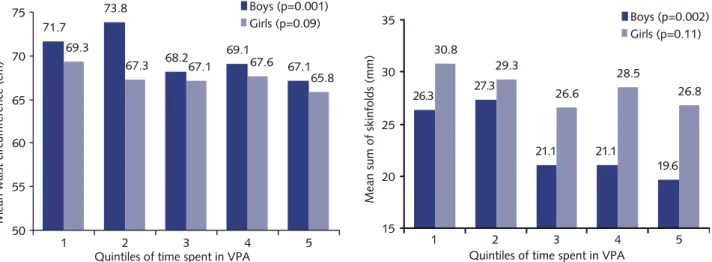
Figure 1 shows the mean waist circumference (cm) and sum of skinfold thick-ness according to quintiles of time spent in vigorous intensity activities for boys and girls separately. A significant inverse linear trend was found for boys but not girls. In the whole-sample (boys and girls combined), the mean waist circumference (cm) was 69.9, 70.0, 67.7, 68.6, and 66.8 in quintiles 1 to 5 of VPA, respectively (p=0.005) and the mean of sum of skinfolds (mm) was 29.6, 28.5, 23.9, 23.6, and 21.4 in quin-tiles 1 to 5 of VPA, respectively (p<0.001) (data not shown in the Figure).
Figure 1 – Mean of waist circumference (cm) and sum of skinfold thickness according to quintiles of time spent in vigorous-intensity physical activities (VPA) in boys and girls. The mean time (min/day) of VPA in the whole sample was 2.1, 4.7, 7.4, 11.1, and 20.9 to quintiles 1 to 5, respectively. Black bars represent boys while white bars represent girls
DISCUSSION
In a cross-sectional analysis of data collected in adolescent members of the 1993 Pelotas (Brazil) birth cohort study, we showed that objectively measured physical activity of vigorous intensity is inversely associated with waist circumference and sum of skinfold thicknesses, while weaker and non-significant associations were found in terms of moderate intensity activities and total body movement defined as accelerometer cpm. Furthermore, associations were stronger in boys than in girls, although there was no statistically significant interaction with sex. These findings suggest that promotion of improvements in body composition in ado-lescents may focus on vigorous intensity, rather than on participation in moderate intensity physical activities.
Our data are in accordance with findings from previous studies in developed societies. In a cross-sectional study, Dencker et al 29 reported that only vigorous
intensity activities was associated with body fat determined by X-ray absorptiom-etry in 8 to 11 years-old Swedish boys and girls. Ekelund et al 12 found a small
but significant inverse association between time spent at moderate and vigorous intensity activities and sum of five skinfolds thicknesses, even after adjustment for sex, sexual maturation, birth weight, parental BMI and study location in 9 to 10
year-old Europeans. However, the association between physical activity and BMI was not significant. Ness et al.13 studied 5500 adolescents aged 12 years. Physical
activity was measured by the Actigraph accelerometer and body composition by the Lunar Prodigy dual X-ray absorptiometry scanner. The authors found an in-verse association between time spent at moderate to vigorous intensity activities with fat mass, and this association was stronger for boys than girls. In the present study, no significant association among girls was observed. However, this finding must be interpreted with caution as it might be due to lack of statistical power rather than lack of a physical activity effect on body composition. Supporting this rationale is the fact that the direction of the regression coefficients (Table 3) was similar in boys and girls yet the coefficients were weaker for girls. An experimental study with adults found that vigorous activities might be more effective in improv-ing fitness and coronary risk factors than moderate activities of equal energy cost
30. The effects of physical activity on body composition may also be age-dependent,
but studies usually include a narrow range of ages and, therefore, extrapolation of findings to the whole adolescence period is hampered. On the other hand, a nar-row age range may aid in discerning the association between physical activity and body composition more reliably, given natural changes in activity patterns during maturation.
These findings do not necessarily imply that only vigorous intensity physical activities should be promoted among adolescents. A recent review demonstrated several mechanisms by which moderate and vigorous intensity adolescent physical activity can affect health, both in the short and in the long-term 11. However,
strat-egies in which body composition improvements are a priority should take into account the fact that vigorous intensity activities are more likely to be effective. Our data suggest that even modest increases in daily time spent in VPA may have important impact on obesity levels and this is consistent with other studies 13, 29.
Some methodological aspects of our study should be considered when inter-preting our findings. First, although nested within a prospective cohort study, our analyses are cross-sectional and we cannot infer causality from our findings. Al-though it is known that physical activity affect body composition, it is also possible that the nutritional status of a given adolescent will either increase or decrease his/ her activity levels. Second, we decided not to analyze BMI as an outcome vari-able, despite it being the most frequent outcome in the literature 7. This decision
was based on the fact that our dataset includes variables which are more sensitive than BMI at estimating body composition. Further, it was previously shown that BMI is a poor index of fatness in individuals 8, particularly when exploring the
association with physical activity because physical activity practice is associated with decreased fat mass and also with increased fat-free mass. A major strength of our study was to measure physical activity by accelerometry in a population-based sample from a middle-income country over several consecutive days, including the weekend. Thirty one individuals (6,8%) had less than three days of monitoring and such a few days of monitoring is not recommended for studies aiming to de-termine physical activity patterns of adolescents. However, as the main objective of this study was to explore the associations of physical activity practice with body composition, we do not believe this issue constitutes an important limitation. Fur-thermore, we used 5s epoch so that very short bouts of physical activities, which may be typical of adolescents’ physical activity behavior, could be detected. How-ever, accelerometer measurements also have limitations. First, individuals might
modify their behavior when using a device (i.e. reactivity). In order to address this issue we compared the self-reported physical activity level of the current study with the 2004 follow-up and found similar results. Thus, we believe that our as-sociations are not affected by this issue. Second, motion sensors do not accurately measure some activities (i.e. cycling, upper body movement, and uphill walking) and were not worn during swimming. However, these activities are performed by less than 10% of Brazilian adolescents and thus we are confident in the ability of accelerometer data to rank individuals accurately. Finally, a series of body compo-sition indices were available and rigorous standardization sessions were carried out in order to guarantee data quality.
In summary our data showed an inverse association between vigorous intensity activity and waist circumference and sum of skinfolds thicknesses which persisted after adjustment for several potential confounders. Total activity and time spent in MPA were not associated with any of the outcomes in the adjusted analyses. The 1993 Pelotas (Brazil) Cohort is an ongoing study that constitutes a distinctive opportunity to investigate several research questions in a middle-income setting. In future follow-up visits of the same cohort, we plan to collect the same physical activity data and other anthropometric variables. This will allow us to explore the longitudinal association between physical activity measured by accelerometers in early and mid-adolescence and body composition indices to be collected in late adolescence and early adulthood.
REFERENCES
1. da Veiga GV, da Cunha AS, Sichieri R. Trends in overweight among adolescents living in the
poorest and richest regions of Brazil. Am J Public Health. 2004; 94: 1544-8.
2. Reilly JJ. Obesity in childhood and adolescence: evidence based clinical and public health
per-spectives. Postgrad Med J. 2006; 82: 429-37.
3. Mundt CA, Baxter-Jones AD, Whiting SJ, et al. Relationships of activity and sugar drink
in-take on fat mass development in youths. Med Sci Sports Exerc. 2006; 38: 1245-54.
4. Must A, Bandini LG, Tybor DJ, et al. Activity, inactivity, and screen time in relation to weight
and fatness over adolescence in girls. Obesity (Silver Spring). 2007; 15: 1774-81.
5. Gortmaker SL, Peterson K, Wiecha J, et al. Reducing obesity via a school-based
interdisciplin-ary intervention among youth: Planet Health. Arch Pediatr Adolesc Med. 1999; 153: 409-18.
6. Must A, Tybor DJ. Physical activity and sedentary behavior: a review of longitudinal studies of
weight and adiposity in youth. Int J Obes (Lond). 2005; 29 Suppl 2: S84-96.
7. Reichert FF, Baptista Menezes AM, Wells JC, Carvalho Dumith S, Hallal PC. Physical
activi-ty as a predictor of adolescent body fatness: a systematic review. Sports Med. 2009; 39: 279-94.
8. Wells JC. A Hattori chart analysis of body mass index in infants and children. Int J Obes Relat
Metab Disord. 2000; 24: 325-9.
9. Ball GD, Huang TT, Cruz ML, et al. Predicting abdominal adipose tissue in overweight
Lati-no youth. Int J Pediatr Obes. 2006; 1: 210-6.
10. Benfield LL, Fox KR, Peters DM, et al. Magnetic resonance imaging of abdominal adiposity
in a large cohort of British children. Int J Obes (Lond). 2008; 32: 91-9.
11. Hallal PC, Victora CG, Azevedo MR, Wells JC. Adolescent physical activity and health: a
systematic review. Sports Med. 2006; 36: 1019-30.
12. Ekelund U, Sardinha LB, Anderssen SA, et al. Associations between objectively assessed
phys-ical activity and indicators of body fatness in 9- to 10-y-old European children: a popula-tion-based study from 4 distinct regions in Europe (the European Youth Heart Study). The American journal of clinical nutrition. 2004; 80: 584-90.
13. Ness AR, Leary SD, Mattocks C, et al. Objectively measured physical activity and fat mass in
Corresponding author
Felipe Fossati Reichert Escola Superior de Educação Física -
Universidade Federal de Pelotas. Rua Luiz de Camões, 625 - Tablada CEP: 96055-630 Pelotas/RS. Tel +55 53 3273.2753 E-mail: [email protected] Received 11/02/2013 Revised 01/03/2013 Approved 02/03/2013
14. Gutin B, Yin Z, Humphries MC, Barbeau P. Relations of moderate and vigorous physical
activity to fitness and fatness in adolescents. The American journal of clinical nutrition. 2005; 81: 746-50.
15. Victora CG, Hallal PC, Araujo CL, et al. Cohort profile: the 1993 Pelotas (Brazil) birth cohort
study. Int J Epidemiol. 2008; 37: 704-9.
16. Reichert FF, Menezes AM, Kingdom Wells JC, et al. A methodological model for collecting
high-quality data on physical activity in developing settings-the experience of the 1993 Pelotas (Brazil) Birth Cohort study. J Phys Act Health. 2009; 6: 360-6.
17. Lohman TG. Applicability of body composition techniques and constants for children and
youths. Exerc Sport Sci Rev. 1986; 14: 325-57.
18. Cameron N. The measurement of human growth. London: Croom-Helm; 1984.
19. Yusuf S, Hawken S, Ounpuu S, et al. Obesity and the risk of myocardial infarction in 27,000
participants from 52 countries: a case-control study. Lancet. 2005; 366: 1640-9.
20. Snijder MB, Dekker JM, Visser M, et al. Associations of hip and thigh circumferences
inde-pendent of waist circumference with the incidence of type 2 diabetes: the Hoorn Study. The American journal of clinical nutrition. 2003; 77: 1192-7.
21. Smith DA, Ness EM, Herbert R, et al. Abdominal diameter index: a more powerful
anthropo-metric measure for prevalent coronary heart disease risk in adult males. Diabetes Obes Metab. 2005; 7: 370-80.
22. Ekelund U, Sjostrom M, Yngve A, et al. Physical activity assessed by activity monitor and
doubly labeled water in children. Med Sci Sports Exerc. 2001; 33: 275-81.
23. Trost SG, Way R, Okely AD. Predictive validity of three ActiGraph energy expenditure
equa-tions for children. Med Sci Sports Exerc. 2006; 38: 380-7.
24. Ekelund U, Anderssen SA, Froberg K, et al. Independent associations of physical activity and
cardiorespiratory fitness with metabolic risk factors in children: the European youth heart study. Diabetologia. 2007; 50: 1832-40.
25. Block G. Improving diet methods, improving epidemiologic methods. Ann Epidemiol. 1994;
4: 257-8.
26. Butte NF, Cai G, Cole SA, et al. Metabolic and behavioral predictors of weight gain in
His-panic children: the Viva la Familia Study. The American journal of clinical nutrition. 2007; 85: 1478-85.
27. McCarthy HD, Ashwell M. A study of central fatness using waist-to-height ratios in UK
children and adolescents over two decades supports the simple message--’keep your waist cir-cumference to less than half your height’. Int J Obes (Lond). 2006; 30: 988-92.
28. Wells JC, Chomtho S, Fewtrell MS. Programming of body composition by early growth and
nutrition. Proc Nutr Soc. 2007; 66: 423-34.
29. Dencker M, Thorsson O, Karlsson MK, et al. Daily physical activity related to body fat in
children aged 8-11 years. J Pediatr. 2006; 149: 38-42.
30. O’Donovan G, Owen A, Bird SR, et al. Changes in cardiorespiratory fitness and coronary
heart disease risk factors following 24 wk of moderate- or high-intensity exercise of equal energy cost. J Appl Physiol. 2005; 98: 1619-25.