AbstrAct: A cross sectional study to investigate the prevalence of obesity, overweight and abdominal obesity and its association with the level of physical activity (PA) measured in employees of a Rio de Janeiro University according to the International Physical Activity Questionnaire (IPAQ).299 employees selected by random sampling were interviewed. The association between PA and anthropometric markers was estimated by Poisson models (robust variance). The prevalence of obesity was 27.4% (men 22.8% and 36.3% women), the prevalence of overweight was 63.5% (men 65.0% and women 65.8%) and the prevalence of abdominal obesity was 45.2% (men 35.5% and 63.7% women). Women reported a higher prevalence of low PA (42.2%) compared to men (33.0%). The models adjusted for socio-demographic and behavioral variables and habits related to health, showed a signiicant association between PA and the outcomes analyzed. The low level of practice of PA (high level reference) has remained associated with the occurrence of obesity (PR = 1.89; 95%CI 1.05 – 3.42) and overweight (PR = 1.40; 95%CI 1.08 – 1.80). For the abdominal obesity, both the mid level (PR = 1.70; 95%CI 1.11 – 2.58) and the low level (PR = 1.74, 95%CI 1.14 – 2.66) were related. This study found inverse association between the practice of PA and obesity in line with what has been recommended by the WHO, and it reinforces the use of IPAQ in population studies. Speciically in relation to abdominal obesity, a remarkable gradient was not observed between levels of PA, suggesting that what is important is the high level of practice of PA.
Keywords: Obesity. Abdominal obesity. Overweight. Motor activity. Prevalence. Sedentary lifestyle.
Prevalence of obesity, overweight and
abdominal obesity and its association with
physical activity in a federal University
Prevalência de obesidade, excesso de peso e obesidade abdominal e
associação com prática de atividade física em uma universidade federal
Miguel Ataide Pinto da CostaI, Ana Gloria Godoi VasconcelosI, Maria de Jesus Mendes da FonsecaI
IDepartment of Epidemiology and Quantitative Methods in Health of the Sergio Arouca National School of Public Health of the Oswaldo Cruz Foundation - Rio de Janeiro (RJ), Brazil.
Corresponding author: Miguel Ataíde Pinto da Costa. Universidade Federal Rural do Rio de Janeiro. Rua UBC, 8, CEP 23897-015, Seropédica (RJ), Brasil. E-mail: [email protected]
IntroductIon
The obesity and sedentariness represent a major public health problem, due to the accelerated increase in its prevalence and association with adverse efects on the cardiovascular and metabolic health at increasingly early ages1-3.
High prevalence of obesity (BMI ≥ 30 kg/m²) and overweight (BMI ≥ 25 kg/m²) have been observed in the adult Brazilian population. In 2002-2003, data from the Household Budget Survey (HBS) showed that obesity afected 11.1% of the adult population, with prevalences of 8.9% in men and 13.1% in women. According to the same survey, about 40% of adults were overweight, with no diferences between men and women4. In 2008 – 2009, HBS data showed an increased prevalence of obesity, overall and by gender (overall 14.8%, 12.5% of men and 16.7% of women) and overweight (overall 49.0%, 50.1% of men and 48.0% of women)5.
The VIGITEL (Telephone-Based Surveillance of Risk and Protective Factors for Chronic Diseases) survey, in 2009, found prevalence of obesity of 13.9% in the general population and 48.0% of overweight i.e. 52.6% of men and 44.1% of women6.
Studies have identiied the sedentary lifestyle, smoking, unhealthy eating habits, reproductive history for women, alcohol intake, socioeconomic conditions and genetic factors as factors associated with the occurrence of obesity and/or overweight in diferent populations7-11.
resumO: Estudo transversal para investigar a prevalência de obesidade, excesso de peso e obesidade abdominal, e a associação com o nível de prática de atividade física (AF), mensurada segundo o Internacional Physical Activity Questionnaire
(IPAQ), em funcionários de uma universidade do Rio de Janeiro. Participaram 299 funcionários, selecionados por amostragem aleatória simples. A associação entre a AF e os marcadores antropométricos foi estimada por modelos de Poisson (variância robusta). A prevalência de obesidade foi de 27,4% (homens 22,8% e mulheres 36,3%), a prevalência de excesso de peso foi de 63,5% (homens 65,0% e mulheres 65,8%) e a prevalência de obesidade abdominal foi de 45,2% (homens 35,5% e mulheres 63,7%). As mulheres reportaram prevalência maior de nível baixo de AF (42,2%) em comparação com os homens (33,0%). Os modelos ajustados, por variáveis sociodemográicas e de comportamentos e hábitos relativos à saúde, mostraram associação signiicante entre AF e os desfechos analisados. O nível baixo de prática de AF(referência nível alto) manteve-se associado à ocorrência de obesidade (RP = 1,89; IC95% 1,05 – 3,42) e excesso de peso (RP = 1,40; IC95% 1,08 – 1,80). Para a obesidade abdominal tanto o nível médio (RP = 1,70; IC95% 1,11 – 2,58) quanto o nível baixo (RP = 1,74; IC95% 1,14 – 2,66) apresentaram-se associados. Este estudo encontrou associação inversa entre prática de AF e obesidade em consonância com o preconizado pela OMS, e reforça o uso do IPAQ em estudos populacionais. Especiicamente em relação à obesidade abdominal, não se observou um gradiente marcante entre os níveis de AF, sugerindo que o importante é o nível elevado da prática de AF.
The conditions associated with the increase in obesity occurred in recent years are not yet well deined. One of the main hypotheses relates the increase in obesity to the decline of energy expenditure in individuals. That decline would be linked to changes in working conditions and also to decreased practice of physical activity (PA)12.However, despite the inverse relationship pointed out between obesity and PA, (by the fact that it is the main variable component in the calculation of energy expenditure), studies have found conlicting results as to the magnitude of this relationship13,14.
These divergent results can partly be explained by the use of diferent instruments to measure the PA and diferent cut-of points for determining its levels. Dumith15, in a recent systematic review involving the use of PA, points out that most studies use their own questionnaires or adapted ones, which complicates their comparability. The author mentions the importance of the use of standardized instruments, highlighting the International Physical Activity Questionnaire (IPAQ), translated and validated for the Brazilian Portuguese16.
In Brazil, we identiied only one nationwide study using the IPAQ17.The vast majority of studies on the adult population are of a regional nature and aim at describing the prevalence and distribution standard of PA18,19, in addition, studies evaluating the association between anthropometric indices of body fat and PA, using the IPAQ, are scarce.20,21In speciic population of Brazilian workers, studies evaluating this association are rare, and they didn’t ind any of them using the IPAQ22,23.
This study aims at estimating the prevalence of overweight, obesity and abdominal obesity and investigating the association between these and the practice of PA on a regular basis, making use of the IPAQ and anthropometric measurements on technical administrative staf of a public University of Rio de Janeiro. Collective environments may be especially appropriate for the development and implementation of health actions directed to the prevention of obesity and encouragement to the practice of PA.
MEtHodoLoGY
The studied University was made up of about 1,900 employees, including teachers and administrative technicians, distributed in three cities. The target population for this study was made up of 955 technical administrative employees, of both sexes, which formed part of the in-house staf in December 2009, and worked in the main campus of the University.
20.0% among those practicing PA in moderate or high level (unexposed), 95% of conidence and power of 80.0%.
Information to apply the exclusion criteria (pregnant employees, employees on leave or disabled people) were not included in the list provided by the personnel department. This list included only the name and the location where they worked. So, to deal with possible losses and exclusions, 10.0% was added to the total of the initial sample, thus obtaining a total of 333 employees. Out of this total of samples, seven employees (2.1%) were considered ineligible by the exclusion criteria (two pregnant employees; ive employees on medical leave) and 27 employees (8.1%) were considered as losses (two were away from their duties; four retired during the survey period; two resigned; ive transferred; two oicials were not located; and twelve refused to participate).
Data were collected during the months of April and September 2010 by trained professional and standardized according to protocol proposed by Habitch26.
For the collection of data was applied a structured questionnaire composed of three blocks of questions. The irst block was made up of questions about habits and behaviors (smoking, alcohol intake and food consumption), and about reported morbidities, taken from the VIGITEL survey questionnaire6. The second block referred to the practice of PA made up of the long format IPAQ27. Socio-demographic data (age, sex, skin color, marital status, education level and household income) were part of the third block.
The questionnaire pre-test was conducted with employees outside of their work hours, and there was no need to adapt or change any questions. The pilot study was conducted with eight employees, members of two University departments. This showed a lack of motivation of respondents in answering the block regarding the self-completed PA (IPAQ), since it is a longer block. Thus, this block of questions was conducted in the form of interview, with questions read in their entirety by the interviewer, which is available for any questions.
To measure the height, a Welmy stadiometer, portable model 220, was used.To measure the Waist Circumference (WC), which deines the abdominal obesity (AO) was used a lexible steel tape measure, brand Cescorf. To measure the weight, a Tanita portable scale, model HS 301 digital, was used. The WC measurement was determined at the midpoint between the last intercostal arch and the iliac crest. The evaluated individual was instructed to breathe normally and the measurement was performed at the end of a normal exhalation28 The height measurement was performed by positioning the respondent standing, with their backs to the stadiometer, barefoot, no head ornaments, upright, with the arms along the body and with the head positioned on the Frankfurt plane.
The measurement was then performed at the end of a deep inhalation, with the movable piece of the stadiometer pressed against his head, enough to compress the hair29.The weight measurement was performed with the respondent barefoot, naked, and with any kind of extra weight removed (keys, wallet, glasses, etc.).
• obese (BMI ≥ 30 kg/m2) versus non-obese (BMI < 30 kg/m2);
• appropriate weight (BMI < 25 kg/m2) versus overweight (BMI ≥ 25 kg/m2).
For AO, the WC was classiied diferently according to gender: • men with AO (WC ≥ 102 cm), and without AO (WC < 102 cm); • women with AO (WC ≥ 88 cm), and without AO (WC < 88 cm)30,31.
The exposure variable (PA) was analyzed in a classiied way, following the original proposal of the IPAQ authors. For each activity described by the individual, there is a ixed amount of preset METs (metabolic equivalents). So, by multiplying the information of the time spent on each activity by METs, the PA assumes three categories according to the following criteria:
• high level of PA practiced (reference category):
a) individuals practicing vigorous intensity PA for at least three days a week, and reaching a minimum total of at least 1,500 MET-minutes/week;
b) individuals performing seven or more days of any walking combination, moderate or vigorous intensity PA, and reaching a total of at least 3,000 MET-minutes/week;
• medium level of PA practiced:
a) individuals practicing three or more days of vigorous intensity PA for at least 20 minutes a day;
b) ive or more days of moderate intensity PA, and/or walk at least 30 minutes a day; c) ive or more days of any walking combination, moderate or vigorous intensity
activity, which reaches a minimum of 600 MET-minutes/week;
• low level of PA practiced: individuals not meeting the criteria to be classiied as medium or high level of PA, or not reporting any PA32.
In the bivariate analysis, the crude prevalence and association (using Pearson’s χ² test) of obesity, overweight and AO were estimated according to the following groups of variables: • socio-demographic variables: gender; monthly income in minimum wages; schooling;
marital status;
• habit and consumption variables: self-assessment of health; smoking habit; consumption of vegetables in ive or more days per week; consumption of soft drinks in ive or more days per week; abusive consumption of alcohol; consumption of meat with visible fat; consumption of whole milk;
• reported morbidities: hypertension; diabetes; cholesterol or high triglycerides; osteoporosis.
mentioned in previous studies as potential confounders (sex, age, smoking and dietary intake variables)33,34, even if they do not meet the above criteria, they were also evaluated in regression models.
To estimate the association set between PA and the outcomes, we used Poisson regression models with robust variance, since they provide, as a measurement of association, PR, measurement of interest in cross-sectional studies, and estimation of standard error (corrected)35,36. The modeling was applied separately to each of the outcomes. The multivariate modeling process, for confounding control, followed the forward approach, based on Greenland and Rothman’proposal37.
In this way, the irst variable to be inserted in the model was the one who changed the association estimates between PA and the outcome, provided that this change was greater than 10%. Subsequently, each of the other variables selected as potential confounders (following the criteria mentioned above) was evaluated in the same way, remaining in the model if they changed the estimate of association between PA and the outcome (estimate already adjusted to the variable included in the previous step). This process continued successively, until no variable changed the association estimates adjusted of the PA with the outcomes in more than 10%, thus obtaining the inal model.
In each final model, possible interactions between the PA variable and other variables were evaluated. The models were adjusted considering the total samples, and not separately for men and women. This approach increases the power in statistical tests in relation to analysis stratified by sex, since the estimates are obtained based on a larger sample (men and women). In addition, it is possible to assess whether the prevalence of the outcomes differ significantly between men and women, and estimate this difference. To investigate whether the association between PA and the outcomes differ according to sex, the interaction term (involving PA and sex) was included in multiple regression models and its significance was tested, by using the analysis of deviance, comparing models fitted (with and without the interaction term) to the significance level of 5%. For the diagnosis of the fitted model, they observed, graphically, the standardized residues (versus the linear predictors), the normality of residuals and the existence of influential observations (Leverage and Cook’s Distance)38.
Prior to data collection, the protocols relating to the Project research were approved by the Research Ethics Committee of the National School of Public Health CEP/ ENSP, protocol 08/10, opinion No. 0008.0.031.000-10.
rEsuLts
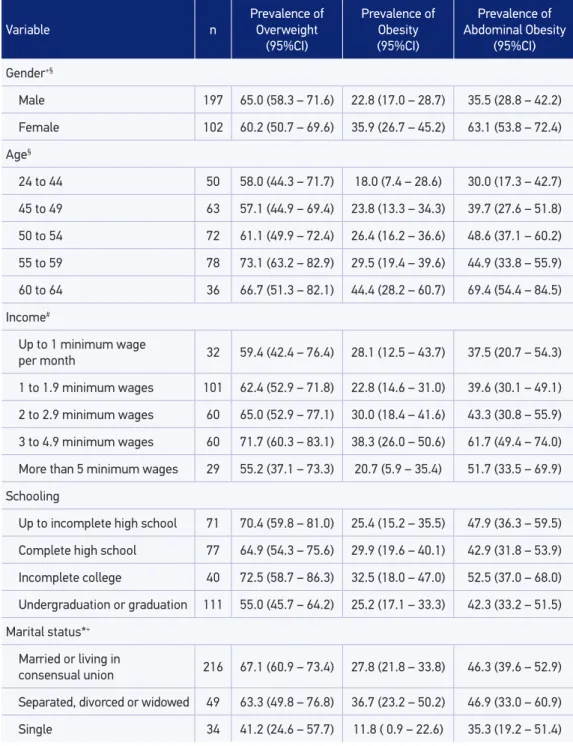
The overall prevalence of overweight was 63.5% (95%CI 57.9 – 68.8), being slightly higher in men compared to women, and the general prevalence of obesity was 27.4% (95%CI 22.7 – 29.3), being this prevalence higher in women compared to men (36 and 23%, respectively). The prevalence of AO was almost double in women compared to men, being the general prevalence of 45.2% (95%CI 39.6 – 50.8). The marital status was strongly associated with overweight and obesity, being the prevalence of the two outcomes in single individuals, 41.8 and 11.8% respectively (Table 1).
With respect to the practice of PA, 36.1% (95%CI 30.1 – 41.7) of employees were considered with low level of PA practiced, 37.5% (95%CI 32.1 – 43.0) with medium level of PA practiced, and 26.4% (95%CI 21.7 – 31.7) with high level of PA practiced. Women had a higher prevalence of low level of PA as compared to men. Men had identical prevalence in the medium and high level of PA. It is observed that the PA was inversely associated with the occurrence of the three outcomes of the study, and this association is stronger and more significant with AO. In the same way as PA, the self-assessment of health proved to be associated with the three outcomes studied (Table 2).
The occurrence of high cholesterol or triglycerides showed a stronger association with overweight and AO (p < 0.001). The diabetes showed a borderline association with overweight and obesity (p < 0.1) and signiicant association with AO. The hypertension proved to be signiicantly associated to the three outcomes studied (Table 3).
For the model with obesity outcome, among the nine potential confounders evaluated, six were included in the final model. In relation to the overweight outcome, among the ten potential confounders, eight were included in the final model. And for the AO outcome, among the ten potential confounders, five were included in the final model (Table 4). In each model, the other variables did not reach the variation of 10% in the adjusted estimate, and so they were not included.
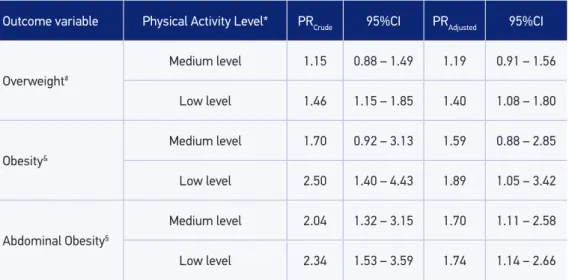
It is observed in Table 4 that, after adjustment, there was a decrease in the strength of association between PA and the three outcomes. In the case of overweight and obesity, adjusted PR estimates were more associated with the low level of PA. Individuals classified with low level of practice of PA showed a prevalence of overweight 1.40 (95%CI 1.08 – 1.80) times greater and prevalence of obesity 1.89 (95%CI -3.42 – 1.05) times greater when compared to individuals who had a high level of practice of PA.
For the AO outcome, a relatively larger reduction in the strength of association between the PA and the outcome in the two levels of practice of PA was observed, tending the adjusted PR estimates to approximate values (adjusted PR of 1.70 (95%CI 1.11 – 2.58) and 1.74 (95%CI 1.14 – 2.66), to medium and low levels, respectively).
Table 1. Prevalence and conidence interval for obesity, abdominal obesity and overweight according to socio-demographic variables. Employees of a public University of Rio de Janeiro - 2010.
Variable n
Prevalence of Overweight
(95%CI)
Prevalence of Obesity (95%CI)
Prevalence of Abdominal Obesity
(95%CI)
Gender+§
Male 197 65.0 (58.3 – 71.6) 22.8 (17.0 – 28.7) 35.5 (28.8 – 42.2)
Female 102 60.2 (50.7 – 69.6) 35.9 (26.7 – 45.2) 63.1 (53.8 – 72.4)
Age§
24 to 44 50 58.0 (44.3 – 71.7) 18.0 (7.4 – 28.6) 30.0 (17.3 – 42.7)
45 to 49 63 57.1 (44.9 – 69.4) 23.8 (13.3 – 34.3) 39.7 (27.6 – 51.8)
50 to 54 72 61.1 (49.9 – 72.4) 26.4 (16.2 – 36.6) 48.6 (37.1 – 60.2)
55 to 59 78 73.1 (63.2 – 82.9) 29.5 (19.4 – 39.6) 44.9 (33.8 – 55.9)
60 to 64 36 66.7 (51.3 – 82.1) 44.4 (28.2 – 60.7) 69.4 (54.4 – 84.5)
Income#
Up to 1 minimum wage
per month 32 59.4 (42.4 – 76.4) 28.1 (12.5 – 43.7) 37.5 (20.7 – 54.3)
1 to 1.9 minimum wages 101 62.4 (52.9 – 71.8) 22.8 (14.6 – 31.0) 39.6 (30.1 – 49.1)
2 to 2.9 minimum wages 60 65.0 (52.9 – 77.1) 30.0 (18.4 – 41.6) 43.3 (30.8 – 55.9)
3 to 4.9 minimum wages 60 71.7 (60.3 – 83.1) 38.3 (26.0 – 50.6) 61.7 (49.4 – 74.0)
More than 5 minimum wages 29 55.2 (37.1 – 73.3) 20.7 (5.9 – 35.4) 51.7 (33.5 – 69.9)
Schooling
Up to incomplete high school 71 70.4 (59.8 – 81.0) 25.4 (15.2 – 35.5) 47.9 (36.3 – 59.5)
Complete high school 77 64.9 (54.3 – 75.6) 29.9 (19.6 – 40.1) 42.9 (31.8 – 53.9)
Incomplete college 40 72.5 (58.7 – 86.3) 32.5 (18.0 – 47.0) 52.5 (37.0 – 68.0)
Undergraduation or graduation 111 55.0 (45.7 – 64.2) 25.2 (17.1 – 33.3) 42.3 (33.2 – 51.5)
Marital status*+
Married or living in
consensual union 216 67.1 (60.9 – 73.4) 27.8 (21.8 – 33.8) 46.3 (39.6 – 52.9)
Separated, divorced or widowed 49 63.3 (49.8 – 76.8) 36.7 (23.2 – 50.2) 46.9 (33.0 – 60.9)
Single 34 41.2 (24.6 – 57.7) 11.8 ( 0.9 – 22.6) 35.3 (19.2 – 51.4)
*p-value < 0.05 in χ ² Test for association with overweight; + p-value < 0.05 in the χ² Test for association with obesity;
§ p-value < 0.05 in the χ ² Test for association with abdominal obesity; #variable with loss of 17 subjects (5.7%) who
Table 2. Prevalence and conidence interval for obesity, abdominal obesity and overweight according to habit and consumption variables. Employees of a public University of Rio de Janeiro - 2010.
Variable n
Prevalence of Overweight
(95%CI)
Prevalence of Obesity
(95%CI)
Prevalence of Abdominal Obesity
(95%CI) Practice of Physical Activity*+§
High level# 79 51.9 (40.9 – 62.9) 15.2 (7.3 – 23.1) 24.1 (14.6 – 33.5)
Medium level& 112 59.8 (50.7 – 68.9) 25.9 (17.8 – 34.0) 49.1 (39.8 – 58.4)
Low level† 108 75.9 (67.9 – 84.0) 38.0 (28.8 – 47.1) 56.5 (47.1 – 65.8)
Health Self-Evaluation*+§
Very good or good 187 55.1 (48.0 – 62.2) 16.0 (10.8 – 21.3) 33.2 (26.4 – 39.9)
Fair ou poor 112 77.7 (70.0 – 85.4) 46.4 (37.2 – 55.7) 65.2 (56.4 – 74.0)
Smoking habit*
Smoker 36 36.1 (20.4 – 51.8) 22.2 (8.6 – 35.8) 33.3 (17.9 – 48.7)
Never smoked 175 65.7 (58.7 – 72.7) 28.0 (21.3 – 34.7) 45.1 (37.8 – 52.5)
Ex-smoker 88 70.5 (60.9 – 80.0) 28.4 (19.0 – 37.8) 50.0 (39.6 – 60.4)
Vegetable intake on ive or more days per week
No 141 63.8 (55.9 – 71.8) 26.2 (19.0 – 33.5) 39.7 (31.6 – 47.8)
Yes 158 63.3 (55.8 – 70.8) 28.5 (21.4 – 35.5) 50.0 (42.2 – 57.8)
Fruit consumption on ive or more days per week
No 176 63.1 (55.9 – 70.2) 26.7 (20.2 – 33.2) 40.9 (33.6 – 48.2)
Yes 123 64.2 (55.8 – 72.7) 28.5 (20.5 – 36.4) 51.2 (42.4 – 60.1)
Soda consumption on ive or more days a week+
No 273 63.4 (57.7 – 69.1) 25.6 (20.5 – 30.8) 44.7 (38.8 – 50.6)
Yes 26 65.4 (47.1 – 83.7) 46.2 (27.0 – 65.3) 50.0 (30.8 – 69.2)
Abusive alcohol consumption#
No 243 62.1 (56.0 – 68.2) 27.6 (22.0 – 33.2) 44.0 (37.8 – 50.3)
Yes 56 69.6 (57.6 – 81.7) 26.8 (15.2 – 38.4) 50.0 (36.9 – 63.1)
Consumption of meat with visible fat
No 205 60.5 (53.8 – 67.2) 26.8 (20.8 – 32.9) 46.3 (39.5 – 53.2)
Yes 94 70.2 (61.0 – 79.5) 28.7 (19.6 – 37.9) 42.6 (32.6 – 52.5)
Whole milk consumption
No 148 66.2 (58.6 – 73.8) 29.1 (21.7 – 36.4) 46.6 (38.6 – 54.7)
Yes 151 60.9 (53.1 – 68.7) 25.8 (18.8 – 32.8) 43.7 (35.8 – 51.6)
*p-value < 0.05 in the χ² test for association with overweight; +p-value < 0.05 in the χ² test for association with
obesity; §p-value < 0.05 in the χ² test for association with abdominal obesity; #(A) physical activity of vigorous intensity,
three days a week and with a minimum of 1,500 MET-minutes/week or (B) seven or more days of walking, moderate or vigorous physical activity and 3,000 MET-minutes/week; &(A) three or more days of vigorous physical activity of
20 minutes per day or (B) ive or more days of moderate physical activity and/or walk for 30 minutes per day or (C) ive or more days of walking, moderate or vigorous, of 600 MET-minutes/week; †individuals who do not meet criteria for
being classiied as medium or high level of physical activity or do not report any physical activity; #individuals who
tables) i.e. women practicing the same level of PA than men have adjusted prevalence of obesity and AO significantly higher.
Only in models with obesity outcome and AO, the health self-assessment variable showed a significant interaction term at the level of 5%, by the Wald test. However, when comparing the models with and without interaction (deviance analysis), the
Table 3. Prevalence and conidence interval for obesity, abdominal obesity and overweight according to morbidities. Employees of a public University of Rio de Janeiro - 2010.
Variable n
Prevalence of Overweight
(95%CI)
Prevalence of Obesity (95%CI)
Prevalence of Abdominal Obesity
(95%CI)
Hypertension*+§
No 196 54.1 (47.1 – 61.1) 18.4 (12.9 – 23.8) 32.7 (26.1 – 39.2)
Yes 103 81.6 (74.1 – 89.0) 44.7 (35.1 – 54.3) 68.9 (60.0 – 77.9)
Diabetes§
No 270 61.9 (56.1 – 67.6) 25.9 (20.7 – 31.2) 42.6 (36.7 – 48.5)
Yes 29 79.3 (64.6 – 94.1) 41.4 (23.5 – 59.3) 69.0 (52.1 – 85.8)
High cholesterol or triglycerides+&†
No 211 59.2 (52.6 – 65.9) 24.2 (18.4 – 29.9) 36.5 (30.0 – 43.0)
Yes 88 73.9 (64.7 – 83.0) 35.2 (25.2 – 45.2) 65.9 (56.0 – 75.8)
Osteoporosis
No 283 64.3 (58.7 – 69.9) 26.9 (21.7 – 32.0) 43.8 (38.0 – 49.6)
Yes 16 50.0 (25.5 – 74.5) 37.5 (13.8 – 61.2) 68.8 (46.0 – 91.5)
*p-value < 0.05 in the χ² test for association with overweight; +p-value < 0.05 in the χ² test for association with
obesity; §p-value < 0.05 in χ² test for association with abdominal obesity; &p-value < 0.001 in χ² test for association
Table 4. Crude and adjusted prevalence ratios of obesity, overweight and abdominal obesity according to the physical activity level estimated by Poisson regression with robust variance.
Outcome variable Physical Activity Level* PRCrude 95%CI PRAdjusted 95%CI
Overweight#
Medium level 1.15 0.88 – 1.49 1.19 0.91 – 1.56
Low level 1.46 1.15 – 1.85 1.40 1.08 – 1.80
Obesity&
Medium level 1.70 0.92 – 3.13 1.59 0.88 – 2.85
Low level 2.50 1.40 – 4.43 1.89 1.05 – 3.42
Abdominal Obesity§
Medium level 2.04 1.32 – 3.15 1.70 1.11 – 2.58
Low level 2.34 1.53 – 3.59 1.74 1.14 – 2.66
*reference category of high level of physical activity; #adjusted by education, health self-assessment, income, cigarette
smoking, age, marital status, consumption of meat with visible fat and gender; &adjusted by health self-assessment,
gender, age, marital status, soda consumption, and income; §adjusted by sex, health self-assessment, age, cholesterol or
high triglycerides, and income; PR: prevalence ratio.
interaction term did not provide significant contribution to the adjustment, thus opting to keep the models without the interaction term because of the parsimony.
The models with AO and overweight outcomes showed adequate adjustment on graphical analysis of waste. Only the model with the obesity outcome showed outliers on the graphic “Leverage”, but it proved to be suitable in the analysis of Cook’s distance and standardized waste. The exclusion of these outlying observations did not influence the final adjustment of the model significantly, nor changed the estimates of parameters relevantly, thus opting for model with all observations.
dIscussIon
The main finding of this study was the independent association between the levels of PA and the anthropometric markers related to body fat. This association is differentiated depending on the anthropometric marker analyzed. For models with overweight and obesity outcome, the prevalences wers higher for the low level of PA. While for the AO outcome, the low and medium level of PA showed prevalences of similar magnitude.
not found22,23. The discordant results can partly be explained by the different way of measuring the PA, in this study through the IPAQ, while in Oliveira’s study22 by his own instrument, and in Oliveira’s study23 by instrument proposed by Kriska and Caspersen39.
Although most of the studies using IPAQ have been conducted in the general population, they have pointed out significant independent associations between PA and markers of body composition, only in men21,40. One reason for this is the higher prevalence of practice of high-level PA observed in men compared to women, since this PA mode tends to have greater impact in reducing obesity41,42. The population of this study consists mostly of men (66%), which may partly explains the associations found between PA and the outcomes analyzed. In addition, we observed that men practiced about three times more high-level PA than women (33.5 and 12.7%, respectively).
The lowest proportion of women found in the sample of this study reflects the pattern of distribution by sex in the population of employees investigated, and can be attributed to the nature of the institution. The University studied is located in a rural area and has elementary and secondary level jobs specifically related to agriculture. Until recently, the town where the University is located didn’t have a good infrastructure (transportation, hotel chain, etc.), and the in-house staff has not been renovated over the years. These characteristics can partly explain the lower proportion of women within the in-house staff.
Although the interaction between the sex variable and PA in the final models has not been statistically significant, it was observed in the models with only main effects that women showed adjusted prevalence of obesity and AO significantly higher than those observed in men. This result deserves to be highlighted, considering that most of the studies on factors associated with obesity opt for stratified analyses, which makes it impossible to obtain estimates of the effect of the stratification variable and perform inferences for the population as a whole. Besides, this approach is not recommended when you have layers of reduced size, as is the case of this study for women43.
It is noteworthy that, in relation to the AO, it’s observed, in the analyses adjusted, that the practice of PA in medium or low level had PRs of similar magnitudes when compared to the high level of PA. Thus, the striking gradient found for other outcomes is not observed, suggesting that for OA, the high level of PA is the most relevant.
The classification for inactive ones include those individuals who do not report any PA, thus becoming a subclassification of low-level category of PA used in this study.
The prevalence of obesity in this study (27.4%) was higher than those found in the city of Rio de Janeiro in INCA’s investigation17 (2002/2003) — 12.9% — in VIGITEL survey6 (2009) — 17.7% —, and in POF5 (2008 – 2009) — 14.8%. The same occurred for the prevalence of overweight (in this study 63.5%, in INCA 46.4%, in VIGITEL 50.4%, and in POF 49%). A possible explanation lies in the age composition of the populations. The age composition of this study involves workers older (24 to 69 years old, being 90% over 40 years old) than the VIGITEL’s population (from 18 years old), and also the INCA’s population (from 16 years old). The POF’s population is also younger (from 20 years old), with more than 60% of respondents under the age of 40.
This study has some limitations. The cross-sectional design does not allow to check the time relations between the main exhibition (PA levels) and the outcomes analyzed, and the phenomenon of reverse causality may occur. In this study, the reverse causality could explain, in part, the underestimation of observed associations between PA and the outcomes analyzed. Some individuals in this study may have started the practice of PA for having found themselves obese at some point, however, until the completion of the survey, there wouldn’t have been enough time for the PA takes effect in reducing obesity. Thus, it is likely that among the individuals classified as practitioners of PA on a regular basis, are included obese individuals that actually practice PA relatively recently, and thus the association between PA and obesity may have its magnitude underestimated. In addition, some of the associations found may not have shown significance due to the fact that the size of the sample was not sufficient to detect PRs smaller than 1.76.
Analyzing the information available to the losses (distribution by section and by gender), we observe that these did not influence the results, because for these, the distribution by section of work inside the University showed no specificity (distributed in 22 different sections), and the distribution by gender approximately follows the trend of those included in the study (60% of men).
In relation to external validity, it must be considered that the results obtained are valid for the group of workers analyzed, with socio-demographic characteristics and specific and distinct PA patterns of the general population.
We stand out as positive points of the study, even though it is a sectional study, it was possible to find independent association between PA and the three outcomes related to excess of body fat, which is differentiated depending on the anthropometric marker analyzed, and a proper analysis methodology was applied to investigate the specific relationship between PA and the outcomes.
1. Silva KS, Nahas MV, Hoefelmann LP, Lopes AS, Oliveira ES. Associações entre atividade física, índice de massa corporal e comportamentos sedentários em adolescentes. Rev Bras Epidemiol 2008; 11(1): 159-68.
2. Rezende FAC, Rosado LEFPL, Ribeiro RCL, Vidigal FC, Vasques ACJ, Bonard IS, et al. Índice de massa corporal e circunferência abdominal: associação com fatores de risco cardiovascular. Arq Bras de Cardiol 2006; 87(6): 728-34.
3. Flegal KM, Graubard BI, Williamson DF, Gail MH. Cause-specific excess deaths associated with underweight, overweight, and obesity. JAMA 2007; 298(17): 2028–37.
4. Instituto Brasileiro de Geografia e Estatística (IBGE). Pesquisa de orçamentos familiares, 2002-2003 (POF): análise da disponibilidade domiciliar de alimentos e do estado nutricional no Brasil. Rio de Janeiro; 2004.
5. Instituto Brasileiro de Geografia e Estatística (IBGE). Pesquisa de orçamentos familiares, 2008-2009 (POF): antropometria e estado nutricional de crianças, adolescentes e adultos no Brasil. Rio de Janeiro; 2010.
6. Ministério Da Saúde. Vigitel Brasil 2009. Vigilância de fatores de risco e proteção para doenças crônicas por inquérito telefônico. Brasília (DF): Secretaria de Vigilância em Saúde; 2010.
7. Rosa MI, da Silva FML, Giroldi SB, Antunes GN, Wendland EM. Prevalência e fatores associados à obesidade em mulheres usuárias de serviços de pronto-atendimento do Sistema Único de Saúde no sul do Brasil. Ciênc saúde coletiva 2011; 16(5): 2559-66.
8. Sá NNB, de Mour a EC . Excesso de peso: d e t e r m i n a n t e s s o c i o d e m o g r á f i c o s e comportamentais em adultos, Brasil, 2008. Cad Saúde Pública 2011; 27(7): 1380-92.
9. Wannamethee SG, Shaper AG. Alcohol, body weight, and weight gain in middle-aged men. Am J Clin Nutr 2003; 77(5): 1312-7.
10. Fonseca MJM, Faerstein E, Chor D, Lopes CS, Andreozzi VL. Associações entre escolaridade,
renda e Índice de Massa Corporal em funcionários de uma universidade no Rio de Janeiro, Brasil: estudo Pró-Saúde. Cad Saúde Pública 2006; 22(11): 2359-67.
11. Mustelin L, Silventoinen K, Pietiläinen K, Rissanen A, Kaprio J. Physical activity reduces the influence of genetic effects on BMI and waist circumference: a study in young adult twins. Int J Obes (Lond) 2009; 33(1): 29–36.
12. Pinheiro ARO, Freitas SFT, Corso ACT. Uma abordagem epidemiológica da obesidade. Rev Nutr 2004; 17(4): 523-33.
13. Wareham NJ, Van Sluijs EM, Ekelund U. Physical activity and obesity prevention: a review of the current evidence. Proc Nutr Soc 2005;64(2): 229–47.
14. Fogelholm M, Kukkonen-Harjula K. Does physical activity prevent weight gain – a systematic review.
Obes Rev 2000; 1(2): 95–111.
15. Dumith SC. Physical activity in Brazil: a systematic review. Cad Saude Publica 2009; 25 Suppl 3: S415-26.
16. Craig CL, Marshall AL, Sjöström M, Bauman AE, Booth ML, Ainsworth BE, et al. International physical activity questionnaire: 12-countr y reliability and validity. Med Sci Sports Exerc 2003; 35(8): 1381-95.
17. Instituto Nacional do Câncer (INCA). Inquérito domiciliar sobre comportamento de risco e morbidade referida de doenças e agravos não transmissíveis: Brasil, 15 capitais e Distrito Federal, 2002-2003. Rio de Janeiro: Instituto Nacional de Câncer; 2004.
18. Matsudo SM, Matsudo VR, Araújo T, Andrade D, Andrade E, Oliveira LC, et al. Nível de atividade f ísica da população do Estado de São Paulo: análise de acordo com o gênero, idade, nível sócio-econômico, distribuição geográfica e de conhecimento. Revista Brasileira de Ciência e Movimento 2002; 10: 41-50.
19. Hallal PC, Matsudo SM, Matsudo VK, Araújo TL, Andrade DR, Bertoldi AD. Physical activity in adults from two Brazilian areas: similarities and differences. Cad Saude Publica 2005; 21(2): 573-80.
rEfErEncEs
20. Vedana EHB, Peres MA, Neves J, Rocha GC, Longo GZ. Prevalência de obesidade e fatores potencialmente causais em adultos em região do sul do Brasil. Arq Bras Endocrinol Metab 2008; 52(7): 1156-62.
21. Thomaz PMD, Costa THM, Silva EF, Hallal PC. Fatores associados à atividade física em adultos, Brasília, DF.Rev Saude Publica 2010; 44(5): 894-900.
22. Oliveira CCM. Atividade Física de Lazer e sua Associação com Variáveis Demográficas e Outros Hábitos Relacionados à Saúde em Funcionários de Banco Estatal [dissertação de mestrado]. Rio de Janeiro: Escola Nacional de Saúde Pública, Fundação Oswaldo Cruz; 2000.
23. Oliveira ESA. Atividade física habitual e outros compor tamentos relacionados à saúde dos servidores da Universidade Federal de Santa Catarina: tendência secular 1994-2004 [dissertação de mestrado]. Florianópolis (SC): UFSC; 2005.
24. Fonseca MJM, Faerstein E, Chor D, Lopes CS, Andreozzi VL. Associações entre escolaridade, renda e Índice de Massa Corporal em funcionários de uma universidade no Rio de Janeiro, Brasil: estudo Pró-Saúde.Cad Saúde Pública 2006; 22(11): 2359-67.
25. Cochran WG. Sampling Techniques. New York: John Wiley & Sons, Inc; 1963.
26. Habitcht JP. Estandarización de métodos epidemiológicos cuantitativos sobre el terreno. Bol Oficina Sanit Panam 1974; 76(5): 375 – 84.
27. International Physical Activity Questionnary (IPAQ); 2004. Disponível em http://www.celafiscs. institucional.ws/65/questionarios (Acessado em dezembro de 2009).
28. I n t e r n a t i o n a l s o c i e t y fo r t h e a dva n c e o f kinanthropometry (ISAK). International standards for anthrometric assessment. ISAK; 2001.
29. Lohman TG, Roche AF, Martorell R. Anthropometric standardization reference manual. Campaign (IL): Human kinects books; 1988.
30. Oliveira LPM, Assis AMO, Silva MCM, Santana MLP, dos Santos NS, Pinheiro SMC, et al. Fatores associados a excesso de peso e concentração de gordura abdominal em adultos na cidade de Salvador, Bahia, Brasil. Cad Saúde Pública 2009; 25(3): 570-82.
31. Han TS, van Leer EM, Seidell JC, Lean ME. Waist circumference action levels in the identification of cardiovascular risk factors: prevalence study in a random sample. BMJ 1995; 311(7017): 1401-5.
32. Guidelines for Data Processing and Analysis of the International Physical Activity Questionnaire
(IPAQ); 2005. Disponível em http://www.ipaq.ki.se/ scoring.pdf (Acessado em dezembro de 2009).
33. Oliveira LPM, Assis AMO, Silva MCM, Santana MLP, Santos NS, Pinheiro SMC, et al. Fatores associados a excesso de peso e concentração de gordura abdominal em adultos na cidade de Salvador, Bahia, Brasil. Cad Saúde Pública 2009; 25(3): 570-82.
34. Gigante DP, Moura EC, Sardinha LMV. Prevalência de excesso de peso e obesidade e fatores associados, Brasil, 2006. Rev Saúde Pública 2009; 43(suppl 2): 83-9.
35. Hirakata VN. Estudos transversais e longitudinais com desfechos binários: qual a melhor medida de efeito a ser utilizada? Rev HCPA & Fac Med Univ Fed Rio Gd do Sul 2009; 29(2): 174-6.
36. Coutinho LMS, Scazufca M, Menezes PR. Métodos para estimar razão de prevalência em estudos de corte transversal. Rev Saúde Pública 2008; 42(6): 992-8.
37. Greenland S, Rothman KJ. Introduction to stratified analysis. In: Rothman KJ, Greenland S, Lash TL, eds. Modern Epidemiology. Philadelphia: Lippincott-Raven; 2008.
38. Fox, J. An R and S-Plus Companion to Applied Regression. Thousand Oaks: Sage Publications; 2002.
39. Kriska AM, Caspersen CJ. Introduction to a collection of physical activity questionnaires. Med Sci Sports Exerc 1997; 29(6): S5-9.
40. Gómez LM, Hernández-Prado B, Morales MdelC, Shamah-Levy T. Physical activity and overweight/ obesity in adult Mexican population. The Mexican National Health and Nutrition Survey 2006. Salud Publica Mex 2009; 51 Suppl 4: S621-9.
41. Saris WH, Blair SN, van Baak MA, Eaton SB, Davies PS, Di Pietro L, et al. How much physical activity is enough to prevent unhealthy weight gain? Outcome of the IASO 1st Stock Conference and consensus statement. Obes Rev 2003; 4(2): 101–14.
42. Physical Activity Guidelines Advisory Committee. Physical Activity Guidelines Advisory Committee Report; 2008. Washington (DC): U.S. Department of Health and Human Services; 2008. Disponível em http://www.health.gov/paguidelines/Report/ pdf/CommitteeReport.pdf (Acessado em janeiro de 2011).
44. Stamatakis E, Hirani V, Rennie K. Moderate-to-vigorous physical activity and sedentary behaviours in relation to body mass index-defined and waist circumference-defined obesity. Br J Nutr 2009; 101(5): 765–73.
45. World Health Organization. Global Recommendations on Physical Activity for Health. Geneva; 2010.
Disponível em http://whqlibdoc.who.int/ publications/ 2010/9789241599979_eng.pdf (Acessado em janeiro de 2011).
Received on: 05/22/2012