UNIVERSIDADE DA BEIRA INTERIOR
Ciências
Bioremediation of liquid effluents using synergy
between Chlorella vulgaris and bacteria
Henrique Castanheira Guilherme
Dissertação para obtenção do Grau de Mestre em
Biotecnologia
(2º ciclo de estudos)
Orientador: Prof. Doutor Rogério Simões
III
Agradecimentos
Esta dissertação só pode ser conseguida com a ajuda de certas pessoas a quem gostaria de agradecer:
Ao Prof. Rogério Simões por ter aceite que eu fizesse parte deste trabalho e pelo tempo e dedicação e disponibilidade em ajudar-me sempre que precisei.
Ao Prof. Arlindo Gomes pela ajuda que me facultou durante este ano de trabalho. À Profª Paula Coutinho, do Instituto Politécnico da Guarda, pela disponibilização das amostras do efluente doméstico.
Aos meus amigos, em especial o Parente, o Diogo o Vasco e o Cahilo por me terem ajudado e fornecido apoio e bons momentos durante esta etapa e à Daniela pela paciência e apoio que me facultou durante o mesmo tempo.
À minha família, com destaque aos meus pais, os meus tios na Suíça e à minha irmã Madalena pelo apoio que me deram durante todo este ano.
À Aqualgae, à FibEnTech e à Universidade da Beira Interior por me terem facultado as condições necessárias para eu poder desenvolver este trabalho.
V
Resumo Alargado
Hoje em dia, devido ao elevado crescimento da população mundial, assiste-se ao esgotamento dos recursos, à utilização intensiva dos espaços e à poluição decorrente das atuais atividades humanas, tornou-se necessário procurar novos meios e métodos de produção de bens, nomeadamente alimentares, com vista a minorar o impacto ambiental e económico das atividades humanas.
Uma das respostas pode passar pela produção de microalgas, tais como a Chlorella vulgaris. No entanto, apesar de se reconhecer que estes microrganismos apresentam um elevado crescimento e potencial na produção de compostos de grande interesse para a alimentação humana e animal, hoje em dia a sua produção não é ainda, em muitos casos, economicamente viável, ou seja, a sua rentabilidade não compensa os elevados custos de produção associados, nomeadamente o enorme consumo de recursos hídricos e de macronutrientes.
Como tal, um dos objetivos deste trabalho foi utilizar efluentes provenientes de 3 fontes diferentes para fornecer os macronutrientes necessários para o crescimento e paralelamente testar o potencial de biorremediação destas microalgas. Neste contexto, procurou-se ainda avaliar as sinergias entre a microalga e as bactérias, quer do próprio efluente, quer introduzidas propositadamente, de modo a analisar a eficácia desta cultura mista no crescimento algal e na biorremediação do efluente utilizado como substrato. Esta abordagem decorre de se saber que existe uma vasta gama de interações entre estes dois microrganismos que data praticamente desde o seu surgimento na história evolutiva da Terra. Tais interações podem ser benéficas ou não, dependendo da espécie de bactéria em questão dado que muitas são parasíticas e como tal podem levar à morte da cultura de microalgas onde estão presentes. No entanto, o uso correto de uma sinergia entre algas e bactérias pode, decorrente da maior acessibilidade a nutrientes de outra forma inacessíveis às algas existentes em culturas, gerar um melhor crescimento de microalgas que irá aumentar o rendimento em biomassa e simultaneamente proporcionar, o tratamento do efluente utilizado como substrato pela cultura.
Neste trabalho, os substratos utilizados foram três efluentes, um de lagar de azeite, outro lixiviado proveniente de um aterro e ainda águas residuais urbanas. Estes efluentes de origens diferentes apresentam, como é natural, características diferentes entre si, o que foi tido em conta na sua utilização como substrato.
O processo foi avaliado com base nas seguintes monitorizações: concentração de células, concentração de macronutrientes, nomeadamente N e P, COD, entre outros.
O efluente de lagar de azeite (OMWW) foi o primeiro a ser utilizado e devido às suas características físico-químicas foi o que sofreu uma diluição maior para garantir que haveria
VI
condições mínimas de sobrevivência das microalgas na cultura. Foram feitas duas séries de ensaios com este efluente (a segunda com maior diluição), tendo-se verificado que o crescimento das microalgas é afetado negativamente pela presença do efluente; como esperado os ensaios com maior diluição (0.25—0.5% v/v) foram aqueles que apresentaram um crescimento bastante aceitável, comparável com a referência (sem efluente e com nutrientes sintéticos). Nesta série de ensaios verificou-se uma diminuição significativa do COD e um correspondente up-take de N e P, o que representa uma efetiva biorremediação.
O segundo efluente utilizado foi um lixiviado (LWW), tendo sido incorporado a níveis entre 5% (v/v) e 10% (v/v). Tal como com o efluente anterior, foram realizadas duas séries de ensaios. Na 1ª série testou-se a adição ou não de macronutriente, N e P, ao efluente LWW. O crescimento das microalgas foi, em qualquer dos casos, significativamente inferior ao verificado para o controlo (sem efluente e com nutrientes sintéticos). O ensaio com 10% de LWW foi o que apresentou os piores resultados de crescimento. Na 2ª série de ensaios foram introduzidas propositadamente bactérias proveniente de um meio misto (aeróbio/anaeróbio), tendo verificado uma influência positiva, ainda que modesta, sobre o crescimento microalgal. Em contrapartida o seu efeito na biorremediação foi misto, com os valores de CQO a manterem-se elevados e estáveis durante o ensaio, enquanto os valores de assimilação de macronutrientes foram superiores às culturas xénicas utilizadas.
O último efluente utilizado foram as águas residuais urbanas (MWW). De facto, não se ensaiou um efluente, mas sim dois proveniente de duas etapas distintas do processo de tratamento de águas residuais: após crivagem e após tratamento aeróbio. Estes efluentes foram incorporados sem e com esterilização e ainda, no caso do esterilizado, adicionando bactérias aeróbias externas. Os resultados obtidos com estes efluentes foram satisfatórios, com os biorreactores com substrato proveniente dos primeiros passos do tratamento de águas residuais a registarem elevados rácios de crescimento, com particular destaque na cultura axénica onde se encontravam bactérias do próprio efluente; as culturas mistas de algas com bactérias alóctones ao efluente por sua vez registaram picos de crescimento, mas depois entraram numa longa fase de crescimento reduzido. No que respeita à biorremediação, apenas o CQO pôde ser testado e o que se verificou foi um declínio lento, mas constante do valor deste.
Os dados obtidos no final do trabalho levaram-nos à conclusão que apesar de na maioria dos casos os efluentes utilizados resultarem em crescimento de biomassa algal, os melhores resultados ocorreram nas culturas mistas de bactérias e microalgas, particularmente as existentes no efluente MWW, onde as culturas indígenas foram testadas. Isto leva-nos a concluir que de modo a se obter um melhor rendimento global de microalgas, assim como um simultâneo tratamento do efluente, a melhor solução será utilizar culturas mistas destes organismos.
VII
Palavras Chave
VIII
Abstract
Nowadays, excessive population growth, overexploitation of resources and increased industrial activity has put a huge stress on several ecosystems, with problems such as occupation of arable land and pollution of watercourses endangering human populations and habitats. One of the answers for this is the use of microalgae as it is known that they have huge potential as food and organic compounds source while occupying non-arable land as well as a largely untapped bioremediation potential. However, despite all this potential its cultivation is still largely not cost effective, as such, several methods to augment its potential are suggested. One of these is by using effluents as substrate, as several of them are rich in macronutrients. Still, one underexploited method is the use of synergy between microalgae and bacteria to increase culture growth. To this end, the microalgae Chlorella vulgaris and three different effluents were used, each with different origins and therefore different physicochemical characteristics in a series of essays. The process was evaluated by analysing parameters such as microalgae growth, COD value and macronutrient assimilation in order to depict the cultures potential as a bioremediation and microalgae growth enhancing assets. The results obtained showed that in the effluents studied, microalgae cultures were able to achieve moderate to strong growth notwithstanding problems such as high organic compounds such as phenols or high macronutrients concentration that characterize the effluents OMWW and LWW respectively. The bioremediation results depend on the parameter analysed, as microalgae showed extremely high nutrients assimilation capability while it is not the case for COD. Within these positive results differences were observed between axenic and xenic cultures, as the presence of bacteria generally served as an enhancer of growth. This was especially the case in cultures where a bacterial population indigenous to the effluent was used as it was the case with MWW. Nonetheless, as far as COD bioremediation regards, the presence of these mixed cultures while did not revealed significant divergences from pure microalgae cultures. Thus, it can be said that the use of mixed bacteria-microalgae culture in effluents is a very effective tool to enhance culture growth while simultaneously decreasing associated costs of this kind of industry and possessing good bioremediation capabilities.
IX
Keywords
XI
Index
Chapter 1 – Introduction……….…….1
Chapter 2 – Literature Review………..………3
2.1 – Chlorella vulgaris………..3
2.1.1 – Taxonomy and General Characteristics………..3
2.1.2 – Reasons for choosing Chlorella vulgaris………...……….4
2.2 – Wastewater………...……….………..5
2.3 – Treatment of Wastewater………..….6
2.4 – Synergy between Bacteria and Microalgae………..……..………7
2.4.1 – Economical Applications of Microalgae-Bacterial Synergism………9
2.4.1.1 – Bioremediation and Bloom Control……….…9
2.4.1.2 – Wastewater Treatment……….………10
2.4.1.3 – Biotechnological Applications……….……….11
2.4.1.4 – Importance for the consumption of macronutrients……….11
Chapter 3 – Materials and Methods……….…...13
3.1 – Materials………..13 3.1.1 – Algae……….………13 3.1.2 – Reagents……….13 3.1.3 – Installation………..14 3.1.4 – General Equipment……….16 3.2 – Methods………..16 3.2.1 – Growth Evaluation………..16
3.2.2 – Chemical Oxygen Demand……….17
3.2.3 – Nitrogen and Phosphorous Determination………...18
3.2.4 – Production of Algal Biomass in different wastewaters……….19
3.2.4.1 – Olive Mill Wastewater (OMWW)………...………..20
XII
3.2.4.3 – Municipal Wastewater (MWW)………23
3.2.5 – Recovery of Algal Biomass………...24
3.2.6– Preparation of Microbial Biomass……….24
Chapter 4 – Results and Discussion………25
4.1 – Olive Mill Wastewater……….…25
4.1.1 – Growth………..…24 4.1.2 – COD Content……….28 4.1.3 – N and P Assimilation………30 4.2 – Leachate Wastewater………....33 4.2.1 – Growth………33 4.2.2 – COD Content……….36 4.2.3 – N and P Assimilation………..38 4.3 – Municipal Wastewater………..……….41 4.3.1 – Growth………..…41 4.3.2 – COD Content……….………..44
Chapter 5 – Conclusions and Future Perspectives……….…47
XIII
List of Figures
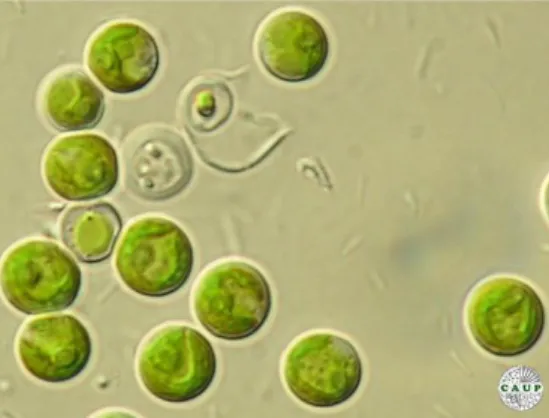
Fig. 2.1 – Microscopic picture of C.vulgaris taken from Charles University Prague culture
collection database. ………..……3
Fig. 2.2 – Different Types of Wastewater and their General Characteristics………5
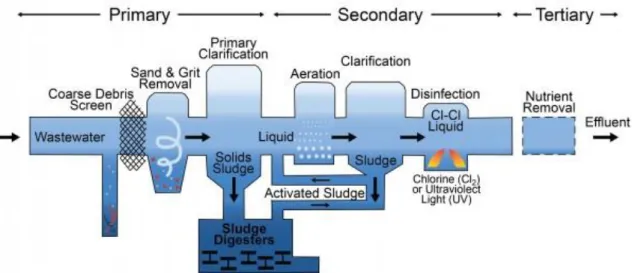
Fig. 2.3 - Scheme of a common Wastewater Treatment Process with Activated Sludge, by University of Michigan………7
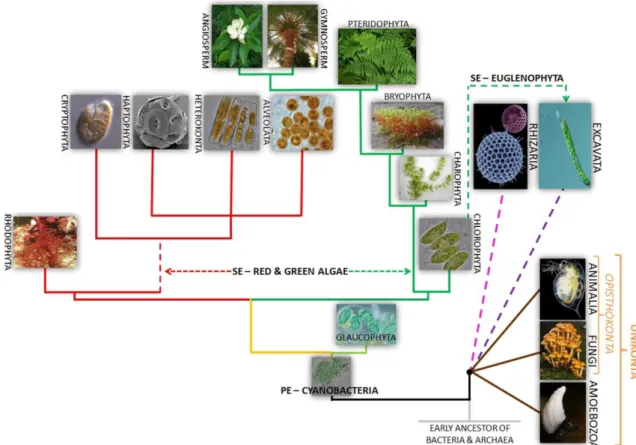
Fig. 2.4 - Diagram with the current evolutionary tree of algae, adapted from Ramanan et al. (2016)……….….8
Fig. 2.5 - Example of a Harmful Algae Bloom (HAB) in Sichuan, China (adapted from Felix Andrews)……….10
Fig. 2.6 - Scheme of a typical Nitrogen Cycle………..…12
Fig. 2.7 - Scheme of a typical Phosphorous Cycle………....……….12
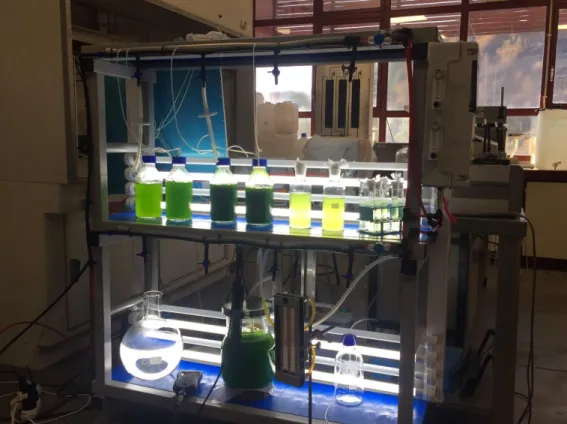
Fig. 3.1 - The installation used for the culture and growth of microalgae for all our essays………...15
Fig. 3.2 - Neubauer Chamber as seen in microscope. The areas used for counting are the corner ones in blue(adapted from the site Celoromics)………..17
Fig. 3.3 - Protocol followed for COD value analyses………17
Fig. 3.4 – Titrator used for titulation of the samples for COD measurement……….….18
Fig. 3.5 - The kits used to analyse the Nitrogen and Phosphorous concentrations……….18
Fig. 3.6 - Spectophotometer used for the analysis of the N and P assimilation………19
Fig. 4.1 - Average cell growth in the different bioreactors in the first series of essays with OMWW………26
Fig. 4.2 - Average cell growth for the different dilutions in the second series of essays of OMWW………..27
Fig. 4.3 - Average COD value for the different substrates used for the first series of essays with OMWW……….….28
Fig. 4.4 - Average COD values for the different samples used for the second series of essays with OMWW………..29
Fig. 4.5 - Nitrogen assimilation in the first series of essay with OMW….………..30
XIV
Fig. 4.7 – Nitrogen assimilation in the second series of essays with OMWW……….32
Fig. 4.8 – Phosphorous assimilation in the second series of essays with OMWW………..32
Fig. 4.9 - Average cell growth for the different samples of the first series of essays with LWW……….…….33
Fig. 4.10 – Average cell growth for the different samples of the second series of essays with LWW………..35
Fig. 4.11 - – Average COD values for the different samples during the first series of essays with LWW……….……….36
Fig. 4.12 – Average COD values for the different samples during the second series of essays with LWW………..37
Fig. 4.13 - Nitrogen assimilation in the first series of essays with LWW……….…38
Fig. 4.14 – Phosphorous assimilation in the first series of essays with LWW………..39
Fig. 4.15 – Nitrogen assimilation in the second series of essays with LWW……….40
Fig. 4.16 – Phosphorous assimilation in the second series of essays with LWW………..40
Fig. 4.17 - Average cell growth in the essay with MWW………..42
Fig. 4.18 - COD evolution for the duration of the essay with MWW substrate……….45
XV
List of Tables
Table 1 - Taxonomy of Chlorella vulgaris……….……….…4
Table 2 - Nutrients present in the stock solutions used and their respective concentrations…14 Table 3 - – Other equipment’s used for the duration of the essays……….16
Table 4 - OMWW characteristics………21
Table 5 - Leachate wastewater characteristics………..22
XVII
Acronyms List
IAA – Indol-3-Acetic Acid
COD – Chemical Oxygen Demand
WW – Wastewater
MWW – Municipal Wastewater
AWW – Agricultural Wastewater
IWW – Industrial Wastewater
WTP – Wastewater Treatment Plant
MPGB – Microalgae Promoting Growth Bacteria
DDT - Dichlorodiphenyltrichloroethane
HAB – Harmful Algae Bloom
HRAP – High Rate Algae Ponds
DNA – Deoxyribonucleic Acid
RNA – Ribonucleic Acid
ATP – Adenosine Triphosphate
FAS – Ferrous (II) Ammonium Sulphate
OMWW – Olive Mill Wastewater
1
Chapter 1 – Introduction and objective
Currently we have been seeing an increasing amount of evidence that the current global population growth will cause massive stress upon the world`s food and fuel supply and consequently social, political and economic instability in both developed and developing worlds. One of the answers to this problem are microalgae. These are photosynthetic microorganism that inhabit both marine and freshwater environments and are among the oldest living organisms on Earth. Its potential as a food and fuel source and their limited impact to the environment and very flexible cultivation make it a target for many companies and researchers [1]. Besides, due to their specific macro/molecular composition several valuable primary and secondary metabolites can be acquired for almost no additional costs [2].However, we have the problem that the cultivation of this kind of microorganism needs significant initial financial resources and most importantly, of ever more precious hydric resources. In fact, in many cases it is still not economically feasible to make large scale productions of this kind.
As such, several ways are being researched in order to make this culture more accessible; among them, the use of nutrients rich wastewater as a substrate, and the usage of mixed cultures of microalgae and bacteria to enhance growth and reducing costs, are being exploited. Another very important way to reduce costs is in fact the correct choice of microalgae. In our case, Chlorella vulgaris was chosen due to its common use among several biotechnological applications thus making the experiment more easily replicable by us in the future or easier to adopt by others. This common usage of C.vulgaris is also due to its biochemical and physiological properties that indeed makes it a valuable and interesting choice for axenic and xenic cultures.
In the case of wastewaters, they can be further divided in accordance with their origin; these being industrial, agricultural and municipal which leads to effluents having different compositions between them such as a higher nitrogen and overall nutrient composition.
The usage of mixed cultures is however more complex. The history of interactions between these two kinds of microorganisms is an ancient one, going back practically to the first ancestors of microalgae, billions of years ago, an interaction that it is thought dramatically affected the course of Evolution and the chemical composition of Earth´s atmosphere, with all the consequences that followed. To use mixed cultures however, there is a need of more advanced bioreactors, as a matter of fact several of them already exist, but their success largely depends on the culture types [3], as most of bacteria are prejudicial to algae causing competition and subsequent decrease of growth, to death due to parasitism and presence of
2
pathogenic substances. The use of the correct ones though will increase growth for both microalgae and bacteria; the firsts releasing organic carbon such as proteins and carbohydrates while the later release 𝐶𝑂2 and consume oxygen, easing the photosynthetic
oxygen tensions for the microalgae. Bacteria also decompose organic matter into mineral, especially essential macronutrients such as nitrogen (N) and phosphorous (P) and even micronutrients that, due to absence of proper fixing process algae are unable to acquire, and releasing growth hormones such as indol-3-acetic-acid (IAA) and vitamins that are found to further promote growth of microalgae [3]. A careful approach to these interactions will thus increase yield and reduce costs of the cultures with great impact to the industry.
With all these factors in mind, our goal was to analyse the synergy between microalgae and aerobic and mixed cultures of bacteria and their potential for substrates.
Thus, experiments were carried out in batch photobioreactors with light intensity, air flow and pH closely monitored to ensure a relatively stable environment. Culture effectiveness was analysed by following the COD evolution, cell growth and macronutrients consumption.
3
Chapter 2 – Literature Review
2.1 – Chlorella vulgaris
The selected microalgae, the species Chlorella vulgaris (Beijerinck,1890) (Fig. 2.1). It is a species of green eukaryotic photolithoautotroph unicellular organism with a high protein content, currently one of the most widely studied algae [4].
Fig. 2.1 – Microscopic image of C.vulgaris taken from Charles University Prague culture collection database
2.1.1 – Taxonomy and General Characteristics
The microalgae per se has a spherical morphology, approximately 5-10µm in diameter. It is composed of a cell wall which serves several biophysiological functions, chiefly recognition of nutrient intake and protection. Inside the cell we have then the cytoplasm that holds the organelles of the microalgae, namely the several vacuoles, the mitochondria, the Gobi complex and the chloroplast; as expected from microalgae it reproduces asexually and rapidly [4]. The following table (Table 1) shows us the taxonomy of the organism in question.
4
Table 1 – Taxonomy of Chlorella vulgaris
Empire
Eukaryota
Kingdom
Plantae
Phylum
Chlorophyta
Class
Trebouxiophycae
Order
Chlorellales
Family
Chlorellaceae
Gender
Chlorella
Species
Chlorella vulgaris (Beijerinck,1890)
This microorganism has existed on the planet for about 2.5 billion years and has a very large geographical distribution; furthermore, it was revealed that it has a genomic structure that is responsible for cell division similar to one found on E.coli as well as segments that are found on terrestrial plants, but at the same time no homologue sequences in red and brown algae were found [5], thus helping to correlate the theory that land vegetation evolved from green algae.2.1.2 – Reasons for choosing Chorella vulgaris
There were several reasons to choosing C.vulgaris in our study. On one part it is an organism studied since the 1900s catching attention then due to its high protein content, as attested by Safi et al (2014) [4], with several different experiments being done since its discovery culminating in the sequencing of its chloroplast genome [5]. As such, it is a well-known organism with defined properties and characteristics. The other part is intimately connected to the first one, and it is the cost. Because it is a microalgae used since early 20th century it is one of the cheapest and most widely used in biotechnology which also plays on one of our main objectives, that is increasing the cost-effectiveness of this kinds of treatment.
5
2.2. – Wastewater
As mentioned above there are several kinds of wastewaters (WW) that can be used, generally divided along its place of origin and each one with different biochemical properties (Fig.2.2) that differently affect the targeted microalgae culture.
Fig. 2.2 - Different types of wastewaters and their general characteristics
As the above diagram shows, effluents that arrive at watercourses can be generally divided along the lines of Municipal Wastewater (MWW), which usually comes from urban waste in cities, Agricultural Wastewater (AWW), usually originated from agropecuary and agricultural sources, and Industrial Wastewater (IWW), this one originated from the wide range of industries, from refineries to textile and steel mills. As such, all of them have variable chemical and organic properties [6], however, due to the large amount of different sources, even among the same types of WW, differences can be found depending on the source and surrounding environments.
Given the rate of human population growth and their expanding activities, it is common knowledge that the rate of effluents produced will increase, which will cause severe problems, first from an environmental and then from a social point of view. Currently, Wastewater Treatment Plants (WTP), while effective, do not completely satisfy the criteria of having a completely treated wastewater [7]; due to this, several areas, especially in poorer countries, where WTPs are not up to standard, are extremely vulnerable with severe problems such as excessive eutrophication. This is serious, as it will cause a loss of diversity and severely impact the quality of life from human populations in the area. Therefore, finding
Wastewaters
Agricultural
Municipal
Industrial
● Low
concentration of organic compounds ● High concentration of metallic ions such as Zi, Co and Fe ● Low to inexistent concentration of suspended and dissolved solids ●Very variable COD value● Small
concentrations of suspended and dissolved solids. ● Average concentration of organic compounds ● Low to medium concentration of metallic ions ● Average to high COD value● High
concentration of organic compounds ● Average concentration of metallic ions ● High concentration of suspended and dissolved solids ● High to Very High COD value6
ways to ensure a successful and cost-effective treatment of effluents can be seen as crucial factor to ensure a sustainable environment for both human, animal and plant populations.
2.3 – Treatment of Wastewater
To safely discharge treated WW to the aquiferous basin and posing little to no problems to the ecosystem and human life, it must first pass through a rigorous treatment. This treatment consists mainly of 3 steps. Primary treatment, Secondary treatment and Tertiary treatment (fig. 2.3). Occasionally the WW will pass through what is called Preliminary treatment; this treatment involves the removal of contents or material that can easily clog the aerification tanks, tubes and pumps that abound in the latter steps of the process, such as rags, woods and/or fecal matter in the case of Municipal Wastewater [8].
The next phase of the process is known as the Primary Treatment, also known as Clarification, and consists on flowing the effluent through large tanks in which settable solids will be removed by action of gravity, with varying degrees of success depending on the effluent used and its chemical and biochemical composition.
Following Primary Treatment, the effluent will pass to the Secondary Treatment which reduces organic matter by means of a population of heterotrophic bacteria indigenous to the effluent that will digest the organic compounds still present [8]; a variation of this treatment is called activated sludge which is less common tough more effective, albeit vulnerable to toxic wastes.
The Tertiary Treatment consists in removal of organic ions, chiefly ammonium nitrate and phosphate, by either biological or chemical processes as mentioned by Abdel-Raouf et al. (2012) [8]. However, this final process is very expensive, with the biological treatment, being cheaper, and therefore being the most common to find in sewage treatment plants for this reason.
7
Fig. 2.3 - Scheme of a common Wastewater Treatment Process with Activated Sludge, by University of Michigan
A far more uncommon treatment also exists and is called Quaternary Treatment, whose main function is to remove metallic ions, remaining organic compounds and soluble minerals; thus, it exists mainly in sewage plants close to industrial or other heavy metals rich areas as this is the most expensive treatment, costing as much as 16 times the primary treatment.
2.4. – Sinergy between Bacteria and Microalgae
In terms of total numbers and biomass it is accepted that photosynthetic organisms and other bacterias are the dominant lifeforms on Earth, inhabiting almost every habitat possible, forming the basis of marine and freshwater food webs; as such, its study for understanding and eventual use are of primary interest for research [9]
It is known that in the case of terrestrial organisms, like plants, there are symbiotic relationships between them and bacteria such as Azotobacter while in the case of microalgae, recent studies showed than in several cases, bacteria not only help fix nitrogen, but also produce hormones such as Indole-3-acetic Acid (IAA), an auxin whose function is growth and development in plants that can be also produced in bacteria and was shown also have similar effects in microalgae through yet unknown means [10] [11]. In fact, there are fossil records that showed that algae-bacterial interaction is very ancient, and may in fact been responsible for an event called Great Oxygen Event [9], that marks the beginning of biologically induced oxygen in the atmosphere and the rise of aerobic organisms to the detriment of anaerobic ones. Further fossil records indicate that early eukaryotic organisms also evolved from cyanobacteria/early microalgae-bacterial (or Archaea) interactions, thus further contributing to the evolution of Life on Earth (Fig. 2.4) Furthermore, more recent genetic studies indicate that horizontal gene transfer from bacteria and archaea may be responsible for the microalgae survivability in extreme environments [12].
8
Fig. 2.4 – Diagram with the current evolutionary tree of algae, adapted from Ramadan at al (2016). Note; green lines represent organisms with green pigments (where C.vulgaris is included), while red indicates algae known as Rhodophyta that possess red pigments
Besides their importance to the evolutionary pathway, far more important to the current biotechnology industries is understanding the nature, or rather the ecology of microalgae-bacterial relationships. These relationships cover a wide range of interactions, but can be subsided in three major ones: Mutualism, Commensalism and Parasitism [9]. The first one, Mutualism, broadly refers to interactions between two individuals from different species that benefits both; this interaction goes from the facultative ones, in which they benefit from each other but is not obligatory for survival to as far as symbiotic relationships in which both organisms must obligatory cooperate with each other for their survival. Many cases exist in this relationship, where the bacteria commonly supplies inorganic macronutrients such as Nitrogen (its importance will be explained further ahead), which microalgae, in normal conditions cannot easily access them, as they do not possess nitrogen fixing mechanisms [9]; however, as the name says, mutualism in not a one way road that benefits only one organism, bacteria also benefit from this relationships in a variety of ways, just like microalgae, namely by uptaking the organic carbon compounds produced by them. This enables both of to exist in oligotrophic environments and thus expands the number of habitats both organisms can colonize, thus this bacteria that are recognized as having potential to enhance microalgae growth are known as MPGB (Microalgae Promoting Growth Bacteria). The second relationship
9
mentioned, commensalism, is one in which only one partner will benefit from the situation, however this puts a thin line between this and either parasitism and mutualism. It is hypothesized that when competing with one another, the algae allowed bacteria to outcompete and eventually outnumbering them in N and P limited environments, as such, this relationship may be described as positively affecting one organism, while the other will have neither benefits nor negatives from such interaction. The third one, parasitism, consists of an interaction in which an organism negatively affects the other to its benefit. This is the most common interaction between microalgae and bacteria, and in it, the parasitic organisms will over time cause cell wall lysis, killing the affected microalgae. Another form of parasitism may simply be competition for nutrients that will slow microalgae growth and can severely affect the economic impact of microalgae cultures [9].As such, we can see that algae-microbial synergism is very complex in which both the microalgae and the bacteria must be carefully chosen as not all of them are capable of positive synergy between them and even the positive aspects can collide with the final objective of the process. Consequently, it is very important to take in account the presence of indigenous bacteria in microalgae applications as they can dramatically alter the economic and environmental costs of using microalgae for a variety of industrial, environmental and pharmaceutical practices, as will be described below.
2.4.1 – Economical Applications of Microalgae-Bacterial Synergism
2.4.1.1 – Bioremediation and Bloom Control
Due to the fact that microalgae do need micronutrients at very small amounts for an effective growth and metabolism they can be used to effectively degrade metallic compounds [13] and even crude oil [14]. Therefore, they have a great potential for bioremediation, an important aspect through much of the developed and developing world due haphazard industrial growth. A combination of culture from both microalgae and bacterial microorganisms has proven to be even more effective than single strain microalgae. According to Subashchandrabose et al., (2013) [15], such cultures were able to degrade dangerous pesticides such as DDT. This kind of interactions should be viewed as a powerful tool to enhance current attempts to clean several of existent pollutants in areas dangerously affected by them, ensuring a recovery of the previous ecosystems to the benefit of its previous or current inhabitants, including human beings.
Closely related to bioremediation, but standing apart we have Bloom Control, one of the first areas of study in this category, that involves the use of bacteria to control explosive growth of microalgae (Fig. 2.5) that will severely diminish available oxygen to
10
Fig. 2.5 – Example of a Harmful Algae Bloom (HAB) in Sichuan, China, adapted from Felix Andrews
the populations of the surrounding marine or freshwater habitat thus causing widespread
mortality of animal and plant life and interdiction of consumption of hydric resources by humans in what are referred as Harmful Algae Blooms (HAB) [9] . By using predatory or
competing bacteria it is possible to diminish algae population to safer levels thus precluding the complete collapse of the surrounding ecosystem. However, such acts must be carefully planned, as the increase of microbial populations can contribute to a lowering of available oxygen due to the decomposition of microalgae, additionally contributing to HAB.
2.4.1.2 – Wastewater Treatment
As microalgae do not possess chemolithotrophic properties they are dependent on the environment to supply them with the macronutrients nitrogen and phosphorous for survival and growth; in their absence, microalgae growth will stagnate and eventually die [16].
However, wastewaters, as mentioned in the previous section 2.2, are rich in these macronutrients and thus can damage natural waters where they are discharged. Since the 1950s there are studies that refer to the abilities of a mixed microalgae-bacterial culture to treat wastewaters, however, such works mostly occurred in High Rate Algal Ponds (HRAP), thus being available only on more large-scale works. In newer studies nevertheless the use of bioreactors such as the ones we will be using proved successful in enhancing microalgae growth and reducing costs [17] demonstrating the potential of microalgae-bacterial in lower scale processes.
11
2.4.1.3 – Biotechnological Applications
As previously said, due to the ability of certain bacteria to release growth hormones typically found in plants such as IAA, they have demonstrated effect on algae and therefore potential to enhance the microalgae cultivation system. According to Ramadan et al. this can increase microalgae growth rate to an average of 10% and in some cases even to 70%. This of course would ensure a higher yield and an easier harvesting process, this way reducing cultivation costs.
Another way that bacteria are useful to the harvesting process is by increasing the flocculation of the algae cells. This may be possible due to the binding of calcium ions (positively charged) of the algae cell wall to the teichoic acid residues (negatively charged) that exist in several Gram-positive microorganisms. Regardless the entire mechanism that bacteria use to increase flocculation is still not totally understood and therefore can be an interesting area for future research, as harvesting is one of the main costs associated for biorefineries [18]. This synergy also has an enormous potential for the production of common primary and the more valuable secondary metabolites [17]. Further research showed that the bioenergy sector stands a lot to gain, with even bacteria such as Geobacter, that are capable of electricity production, and coexist synergistically with algae with improved results [19].
Also, another application that is widespread but commonly overlooked in place of the previously mentioned is the aquaculture. Microalgae are used to control pathogenic bacteria with the added bonus of helping in the wastewater treatment.
2.4.1.4 – Importance to the consumption of macronutrients
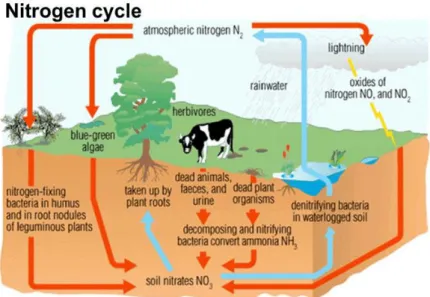
As previously mentioned, microalgae are photosynthetic organisms that, as all living creatures, need a constant supply of macronutrients, that are needed in large scale, and micronutrients, that are needed in small scale to survive and thrive. Two of the most important macronutrients are Nitrogen and Phosphorous; as such, every experiment with microalgae must take in account the amount of these elements that are available in the substrate to ensure culture growth. Nitrogen (N) is the most common element on the atmosphere, comprising around 80% of the total composition of it, although it is largely inaccessible, so, the one present in the soils and water has huge importance to the normal running of a stable ecosystem as it is constantly interchangeable between several forms. The disruption of this nitrogen cycle (Fig. 2.6) would have dramatic consequences for the targeted ecosystems eventually leading to the destruction of fauna and flora populations in the affected areas
.
12
Fig. 2.6 – Scheme of a typical Nitrogen Cycle
Phosphorous (P) meanwhile is never found as a free element on Earth due to its highly reactive nature and it is commonly found as either red phosphorous or white phosphorous. Biologically speaking, it is a key component on known life, as a key element of such basic structures as DNA, RNA, and ATP. Like nitrogen, phosphorous circulates through the several spheres that compose the planet (Fig. 2.7), but unlike the nitrogen, the atmosphere does not play an important part on it.
Fig. 2.7 – Scheme of a typical Phosphorous Cycle
That said, despite the extreme importance both nitrogen and phosphorous have for the continued existence of life, both have very negative consequences if there is excessive amount. A clear example of this is the HAB (Harmful Algae Bloom), that is generally caused by an excessive amount of nitrogen in a body of water that left untreated and will severely affect both its immediate habitat and the surrounding system. As mentioned in subsection 2.4.1, algae are known to be a very decent mean of bioremediation by themselves and can remove the nutrients from the aqueous systems. Great care must be taken however, because microalgae are also affected if the nutrient contents are too high. Although several studies have shown that the supposedly ideal Redfield Ratiois 15:1 (N:P ratio), it is not a set rule for
13
using substrate because several species of algae having better growth rates at different ratios [20], and their removal rates are not affected by the existence of the optimal N/P ratio [21]: However, it is known the concentration of N is serious factor that affects the rate of removal of P from the substrate by microalgae [22].In addition, the microalgae-bacterial interactions were viewed as a way minimize the risks inherent to the fluctuation of macronutrients in a determined substrate. Indeed, one of the most examples of mutualism between microalgae and several bacteria is in nutrients poor environments, in which, bacteria with a nitrogen fixing mechanism (inexistent in microalgae) supplies nitrogen in exchange of fixed carbon originated from the algae´s photosynthetic mechanism [23].
Based in this information a microalgae-bacterial mixed culture could have a higher yield than a xenic one due to the fact that bacteria may fix nitrogen normally inaccessible in substrates like wastewater and thus guarantying continued growth. However, like it was mentioned before, these are all steps that must be carefully thought as not all bacteria benefit microalgae and even then, many may have different survival conditions such as pH, luminosity and macronutrients level.
Chapter 3 - Materials and Methods
3.1 - Material
3.1.1 - Algae
The microalgae used in these tests was the freshwater Chlorella vulgaris. These were obtained from Aqualgae (Viana do Castelo, Portugal). and then grown until we had a sufficient amount that enabled several studies without risk of running out of stock.
3.1.2 - Reagents
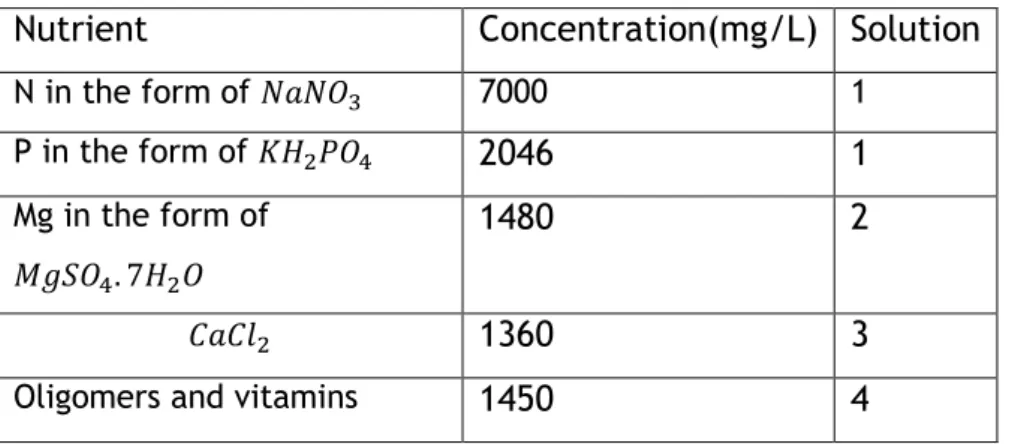
The medium we used was the GOLDMEDIUM-FWS, using as reagents, distilled water from the system RIOsTM 3 (Millipore, Waters), and 4 stock solutions as mentioned in table 2. Each
14
Table 2 - Nutrients present in the stock solutions used and their respective concentrations
Nutrient
Concentration(mg/L) Solution
N in the form of 𝑁𝑎𝑁𝑂
37000
1
P in the form of 𝐾𝐻
2𝑃𝑂
42046
1
Mg in the form of
𝑀𝑔𝑆𝑂
4. 7𝐻
2𝑂
1480
2
𝐶𝑎𝐶𝑙
21360
3
Oligomers and vitamins
1450
4
To serve as bioreactors we used several bottles of 500 mL capacity connected to an air pump in order to generate needed air flow to keep stirring conditions in the bioreactors, in addition to supply CO2. Occasionally we also supplied 𝐶𝑂2 (from pressurised tubes) via gas flow meters
in order to balance the bioreactors pH and provide the macronutrient C (carbon).
For the analyses of treated and untreated effluents, several other reagents like Ferrous (II) AmmoniumSulphate (FAS) and Potassium Dichromate were used as well as 𝐻2𝑆𝑂4 0.5 M and
NaOH 0.2 M for controlling the bioreactors pH.
3.1.3 – Installation
The microalgae were grown in 500mL gas washing bottles in shelfs for microalgae growth supplied by Aqualgae (Viana do Castelo, Portugal) comprising an air pump model V-60 (Hailea, Guangdong, China), a control unit for the light-dark cycles (12:12) using 4 fluorescent cylindrical LED. The shelf also possesses 3 air flow meters and 3 flow lines of 𝐶𝑂2, all of them
15
16
3.1.4 - General Equipment
Table 3 resumes other lab required equipment.
Table 3 – Other equipment’s used for the duration of the essays
Table of Equipments
Designation
Series
Autoclave
Tuttnauer 2540ML
Spectrophotometer
Helios-Omega UV-VIS
Neubauer Chamber
Zuzi Neubauer Improved
Heat Block
Lovibond ET125
Titrator
Metrohm 682 Titroprocessor
Dosimat
Mettrohm 665 Dosimat
Stirrer
Metrohm 728 Stirrer
Vacuum Pump
GMBH+CO KG
3.2 - Methods
3.2.1 - Growth Evaluation
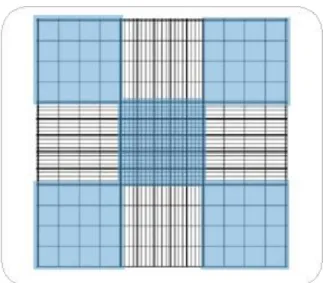
In order to evaluate the growth of C.vulgaris two methods were used to analyse this parameter. These methods were Cell Counting with the use of a Neubauer Chamber and Spectrophotometry, albeit only the first one was deemed efficient enough to get an accurate reading of the microalgae growth; thus only data obtained from the first method will be used in this study. To use the Neubauer Chamber a sample was taken from the bioreactors and diluted (see section 3.5); subsequently 10µL were putted on the Chamber with the help of a 10µL pipette and analysed with a microscope by counting the number of cells present in each square present on a larger square in the Chamber as shown in fig.3.2.
17
Fig. 3.2 – Neubauer Chamber as seen in microscope. The areas used for counting are the corner ones in blue,(adapted from the site Celoromics)
After counting the number of cells present in each square the following formula was used to estimate the number of microalgae cells present in the bioreactors, assuming that each volume in the larger squares is 0.1µL:
𝑇𝑜𝑡𝑎𝑙 𝑁𝑢𝑚𝑏𝑒𝑟 𝑜𝑓 𝐶𝑒𝑙𝑙𝑠
𝑁𝑢𝑚𝑏𝑒𝑟 𝑜𝑓 𝑙𝑎𝑟𝑔𝑒𝑟 𝑠𝑞𝑢𝑎𝑟𝑒𝑠 𝑐𝑜𝑢𝑛𝑡𝑒𝑑
∗ 𝐷𝑖𝑙𝑢𝑡𝑖𝑜𝑛 𝐹𝑎𝑐𝑡𝑜𝑟 ∗ 10000
The coefficient of variation of Growth measurement was close to 15%.3.2.2 – Chemical Oxygen Demand
The effectiveness of this microalgae for effluent treatment was analysed by using Chemical Oxygen Demand (COD) determination, by means of the closed reflux titrimetic method (Fig. 3.3) as described below according to the Standard Methods for the Examination of Water and Wastewater.
Fig. 3.3 - Protocol followed for COD value analyses
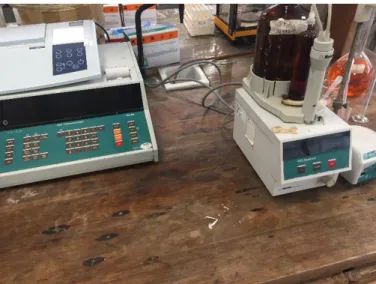
After titration using the Titrator Metrohm 682 Titroprocessor as shown in Fig. 3.4 the COD was calculated with the following formula, as required by the book Standard Methods:
(𝐵𝑙𝑎𝑛𝑘 𝑆𝑎𝑚𝑝𝑙𝑒 − 𝑆𝑎𝑚𝑝𝑙𝑒 𝑓𝑟𝑜𝑚 𝑡ℎ𝑒 𝐵𝑖𝑜𝑟𝑒𝑎𝑐𝑡𝑜𝑟) ∗ 𝑀𝑜𝑙𝑎𝑟𝑖𝑡𝑦 𝑜𝑓 𝐹𝐴𝑆 ∗ 8000
𝑉𝑜𝑙𝑢𝑚𝑒 𝑜𝑓 𝑡ℎ𝑒 𝑆𝑎𝑚𝑝𝑙𝑒
2.5 ml Sample 1.5 mL Potassium Dichromate 3.5 mL Sulphuric Acid Reagent Tightly closing the vial and gently agitateDigestion at 150ºC during
120 min
Cooldown Titrate with FAS 0.033m
18
Fig. 3.4 – Titrator used for titulation of the samples for COD measurement
The coefficient of variation of the COD measurement was close to 20%.
3.2.3 – Nitrogen and Phosphorous Determination
As mentioned in section 2.4.1.3 N and P consumption is a method to analyse bioremediation potential, as high N and P concentrations are a general indicator of pollution, and its consumption found to be correlated to growth and bioremediation [24]. As such, initial and final N and P concentrations were determined and used to calculate the N and P removal.
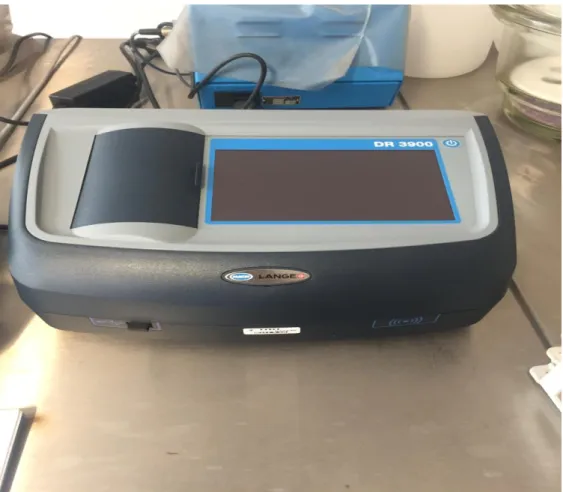
To measure N and P concentrations kits LCK 138 and LCK 350 respectively (Fig. 3.5), were used by following the protocol described in the kits instructions and then analysed in a spectrophotometer (Fig.3.6). The coefficient of variation of the N and P measurement was close to 5%.
19
Fig. 3.6 – Spectophotometer used for the analysis of the N and P assimilation.
3.2.4 – Production of Algal Biomass in different wastewaters
The algal biomass was cultivated with the main goal of effluent treatment; in addition, the microalgae produced can be used in other industries such as pharmaceutical, bioenergy, food.
Gas washing bottles (500 mL) with gas injection adaption were used as photobioreactors in a batch culture. For an effective volume of 500 mL, the bottle has a surface area of 547.65𝑐𝑚2/𝐿, but considering that light was supplied only through one side, we consider that
its effective area was of 273.83 𝑐𝑚2/𝐿. Air was supplied through an air pump model V-60
(Hailea, China), filtrated by a nylon membrane with a 0.45µm porosity (Membrane Solutions, USA) with an air flow of 250mL air/ 𝐿−1min to each bottle with the help of dispersers with a
diameter of 2mm located close to the bottom; when required, 𝐶𝑂2 was supplied through
dispersers with a diameter of 1mm in 7 second pulses with intervals of 10 min and a flow of 0.4mL/min,. Luminosity for its turn was supplied through 4 cylindrical fluorescent LED with and intensity of 400 µmol photons/𝑚2𝑠.
For each series of experiments, several bottles were placed in the microalgae growth shelf, under controlled light intensity and light cycles. In general, replicates were used for each tested condition. Each series had control essays, using artificial nutrients and sterilized distilled water and essays with different effluents under different dilution. In general, 50 mL
20
of stock microalgae were added to each reactor to obtain a given initial microalgae concentration.
Daily samples were taken from each reactor to determine cell and COD concentrations; at specific moments, N and P determination were also carried out.
To choose a wastewater to use as a source substrate, we must place careful attention on the effluents N and P contents, that, as said in chapter 2.4.1.3, are essential to the survivability of organism and whose concentration and ratio influences growth rate.
As a reference, we used GOLDMEDIUM-FWS to serve as our Control against leachate wastewater (LWW), olive mill wastewater (OMWW) and municipal wastewater (MWW) from primary and secondary treatment.
The wastewaters used, OMWW, LWW and MWW, were analysed in respect to COD, pH, phosphorous, nitrogen and other micronutrients to determine its capability to serve as C.vulgaris substrate.
3.2.4.1 – Olive Mill Wastewater (OMWW)
In areas of Mediterranean climate were olive trees are autochthonous they have become a main industrial and economic activity. However, this industry is responsible for the production 3.0*107 𝑚3 of OMWW worldwide [25] a staggering amount that consumes a large
quantity of resources for its treatment.
From previous work we know that the properties of OMWW depend on a wide range of factors, including, oil extraction process, environmental conditions and cultivation techniques. However, the most serious problem we face in using it as substrate for algae growth, is his very high COD content. As such we were forced to dilute our substrates in order to obtain different concentrations that were then experimented on. These concentrations were decided based on biochemical data determined in a previous studies by the same research group [25]. Table 3 resumes the biochemical composition of the OMWW, after coarse filtration. As we can see, the Chemical oxygen demand (COD) is extremely high (127000 mg/L), whereas the total nitrogen and phosphorus content are 250 mg/L and 211.5 mg/L, respectively, which gives a unfavourable C:N:P of 3051:16:13; the defined recommended ratio is 106 C:16N:1P. In addition, considering the extremely high COD concentration we decided to test OMWW incorporations of 0.5%, 1% and 2% (v/v), which mean dilution of 1:200; 1:100 and 1:50. Despite these dilution factors, the initial COD should be around 635 mg/L, 1270 mg/l and 2540 mg/L. The unbalanced C:N:P ratio was corrected by adding N and P from the artificial stock solution 1, in order to attain an initial concentration of 70 mg N/L and 20.4 mg P/L. Due to the high number of particles present in the effluent, filtration, using a nylon membrane Hydrophobic PTFE Membrane Filter with a diameter of 47mm and pore size
21
of 0.45µm was used the eliminate the biggest particles that could adversely affect the essays utilising this effluent.The first series of essays consisted of 8 bottles of 500mL, including:
2 Controls (Controlo) (Initial concentrations ([N]0; [P]0 ) of 70 mg N/L, from 𝑁𝑎𝑁𝑂3;
20.4 mg P/L, from 𝐾𝐻2𝑃𝑂4; 14.8 mg mg/L, from 𝑀𝑔𝑆𝑂4.7H20; 13.6 mg Ca/L,
from 𝐶𝑎𝐶𝑙2.2 𝐻2𝑂; 14.5 mg/L of oligoelements and vitamins);
2 bottles (I and II) 0.5%(v/v) of OMWW and [N]0 = 71.25 mg N/L and [P]0 = 21.6 mg
P/L;
2 bottles (I and II) with 1%(v/v) of OMWW and [N]0 = 72.5 mg N/L and [P]0 = 22.58 mg
P/L;
2 bottles (I and II) 2%(v/v) of OMWW and [N]0 = 75 mg N/L and [P]0 = 24.69 mg P/L;
All the bottles above were further supplied with 𝐶𝑂2 in pulses of 7 seconds in intervals
of 10 minutes each.
Due to the obtained results in the first series of tests, it was decided to try different concentrations in a new series of essays with the concentrations of 0.5% (v/v) and 0.25% (v/v), the latter corresponding to a dilution of 1:400. This second series of essay consisted of 6 bottles of 500 mL, including:
2 Controls (Controlo) (Initial concentrations of 70 mg N/L, from 𝑁𝑎𝑁𝑂3; 20.4 mg
P/L, from 𝐾𝐻2𝑃𝑂4; 14.8 mg Mg/L, from 𝑀𝑔𝑆𝑂4.7H20; 13.6 mg Ca/L, from 𝐶𝑎𝐶𝑙2.2
𝐻2𝑂; 14.5 mg/L of oligoelements and vitamins);
2 bottles (I and II) 0.25%(v/v) of OMWW and [N]0 = 70.63 mg N/L and [P]0 = 21 mg
P/L;
2 bottles (I and II) 0.5%(v/v) of OMWW and [N]0 = 71.25 mg N/L and [P]0 = 21.6 mg
P/L;
Unlike the first series of essays, in this second series no 𝐶𝑂2was added to the bottles.
Concentration (g/L)
COD
127
BOD
62
TN
0.25
TP
0.21
22
3.2.4.2 – Leachate Wastewater (LWW)
Leachate is generally a type of effluent occurring from leaching in decomposing waste, thus being very common in landfills [26]. These types of effluents, due to their variable origins have similar variable composition, but all of the nonetheless possess very high concentrations of macronutrients as can be seen in the table below (Table 5). Thus, it presents a challenge for the use of microalgae for bioremediation.
This wastewater from a nearby landfill previously was electrochemically treated to reduce its naturally high COD, P and N contents to more manageable levels for C. vulgaris.
Table 5 – Leachate wastewater composition.
Concentration (mg/L)
COD
8753
TN
2665
TP
26.1
The table clearly shows that while the main characteristic of this wastewater is an extremely high Total Nitrogen (2665 mg/L) that by itself leads to a very unfavourable C:N:P ratio of 126:102:1, which together a still high COD concentration led to the need to test LWW incorporations of 5% (v/v) with and without added stock solution 1, and 10% (v/v) with added stock solution 1, corresponding approximately to dilutions of 1:20 and 1:10.
To this end, in the first series of essays, 8 bottles of 500 mL were used:
2 Controls (Controlo) (Initial concentrations ([]0) of 70 mg N/L, from 𝑁𝑎𝑁𝑂3; 20.4 mg
P/L, from 𝐾𝐻2𝑃𝑂4; 14.8 mg Mg/L, from 𝑀𝑔𝑆𝑂4.7H20; 13.6 mg Ca/L, from 𝐶𝑎𝐶𝑙2.2
𝐻2𝑂; 14.5 mg/L of oligoelements and vitamins);
2 bottles (I and II) 5%(v/v) (Controlo+5%) of LWW and [N]0=203 mg N/L and [P]0=21.7
mg P/L;
2 bottles (I and II) 5%(v/v) (5% EF.) of LWW with no added macronutrients from stock solution 1, which corresponds to [N]0=133.2 mg N/L and [P]0=1.3 mg P/L;
2 bottles (I and II) 10%(v/v) (Controlo+10%) of LWW and [N]0=336.5 mg N/L and
[P]0=23.0 mg P/L;
The results obtained in the end of the first essay led us to try a new one, this time without added stock solution 1 and using mixed aerobic microbial cultures as a mean to help the microalgae to consume the high N values of LWW.
23
2 Controls (Initial concentrations of 70 mg N/L, from 𝑁𝑎𝑁𝑂3; 20.4 mg P/L,
from 𝐾𝐻2𝑃𝑂4; 14.8 mg Mg/L, from 𝑀𝑔𝑆𝑂4.7H20; 13.6 mg Ca/L, from 𝐶𝑎𝐶𝑙2.2 𝐻2𝑂;
14.5 mg/L of oligoelements and vitamins);
2 bottles (I and II) 5%(v/v) of LWW with no added macronutrients from stock solution 1;
2 bottles (I and II) 5%(v/v) (5% m.) of LWW with no added macronutrients from stock solution 1; 15 Light Expanded Clay Aggregate (LECA) biofilm coated, as a result of several years of cork boiling wastewater treatment under mix conditions aerobic/anaerobic, were also added;
2 bottles (I and II) 10%(v/v) of LWW with no added macronutrients from stock solution 1; 15 Light Expanded Clay Aggregate (LECA) biofilm coated, as a result of several years of cork boiling wastewater treatment under mix conditions aerobic/anaerobic, were also added to this samples
3.2.4.3– Municipal Wastewater (MWW)
MWW is the most commonly used wastewater for this kind of studies due to its easiness of acquiring and known properties. It was also used in this work to test the feasibility of effluent treatment and microalgae growth ability. Its composition tends to vary from region to region depending on several factors like the main economic activity and general quality of life of the population.
From the municipal waste water treatment plant (Guarda, Portugal), we received effluent from several stages of treatment identified as A1 (Preliminary Treatment), A2 (Secondary Treatment), A3 (Decanters Exit) and A4 (Filtration and UV Radiation Treatment); its characteristics were then analysed like we did in the previous wastewaters, as showed in table 5.
Table 6 – Municipal wastewater composition
A1 (mg/L) A2(mg/L)
A3(mg/L)
A4(mg/L)
COD
518.6
--- 446.8
---
TN
162.9
396.0
92.7
97.2
TP
3.9
53.8
1.8
1.8
The data obtained showed us that MWW for A1 and A3 are more balanced (C:N:P=50:42:1, and 93:52:1 respectively) than either OMWW or LWW. Indeed, MWW is the most commonly used as a substrate due to that factors as the N:P ratio is far more favourable that either one of the others that were previously used
.
24
Due to the lower values of phosphorous and nitrogen in effluent A3 regarding effluent A1(table 5), it was decided to evaluate the contribution of the aerobic biomass in effluent A3. Use of biomass, as mentioned before (chapter 2.4), can help microalgae by increasing the available nutrients available in an oligotrophic environment. In resume, it was also decided to test the effectiveness of aerobic biomass by supplying them to the sample with the least amount of macronutrients available, that means A3; different initial aerobic biomass concentrations were also tested.
So, in this experiment we used 8 bottles as bioreactors:
Controls, one 100% A1 (A1 Control) and the other 100% A3 (A3 Control) with no additional nutrients;
2 bottles (I and II) 100% A1 sterilised, with no additional nutrients (A1);
2 bottles (I and II) 100% A3 sterilised, with no additional nutrients, but with 2mL of aerobic microbial biomass added (A3 + 2mL);
2 bottles (I and II) 100% A3 sterilised, with no additional nutrients, but with 4 mL of aerobic microbial biomass added (A3 + 4 mL).
All the bottles were also supplied in 𝐶𝑂2 in pulses of 7s with 10 min of interval between them.
3.2.5 – Recovery of algae biomass
The biomass resultant from the different series of experiments were recovered by centrifuge at 7500 rpm during 30 min to ensure a clean supernatant for COD and macronutrients determination.
For growth evaluation 100µL were withdrawn from the bioreactors. This volume was then diluted 1:30 using distilled water and used for cell counting.
3.2.6 – Preparation of Microbial Biomass
The microbial biomass used for the essays with mixed culture (algae and bacteria) was available in the lab, maintained with sugar under aerobic conditions during the last years.
The aerobic culture was washed 5 times and cultivated during a period of 15 days until nutrient depletion, namely the sugar used to maintain the biomass. The final SST concentration was 5.71 mg/L. Assuming a microalgae/aerobic microbial ratio of 2:1 and considering the initial microalgae concentration of 0.2 g/L, the required volumes of microbial biomass was calculated to be around 1mL. To play safe it was decided to use 2mL for the bottle with higher N levels and 4mL for the one with lower levels, this corresponded to by using the formula described below 0.027 mg/L and 0.055 mg/L respectively for the amount of biomass inserted in the substrates.
(𝑆𝑎𝑚𝑝𝑙𝑒 𝑉𝑜𝑙𝑢𝑚𝑒 ∗ 𝐵𝑖𝑜𝑚𝑎𝑠𝑠 𝐶𝑜𝑛𝑐𝑒𝑛𝑡𝑟𝑎𝑡𝑖𝑜𝑛)
25
Chapter 4 – Results and Discussion
4.1. – Olive Mill Wastewater
4.1.1 – Growth
The first experiment had to take in account a very high COD value existent in OMWW [25] that would negatively affect microalgae survivability and growth. As such, dilution was carried out preceded by filtration to remove particulate materials. As during the experiment, the volume change with time due to evaporation, the real volume was always taken in account to guarantee accurate calculation, growth was measured using Neubauer Chamber with a dilution on 1:30.
The first experiment with OMWW lasted for 17 days and consisted of 8 bioreactors of 500 mL operated in batch mode, using as substrate 0.5%(v/v) of OMWW, 1% (v/v) of OMWW, and 2%(v/v) of OMWW, in addition to the blank essay without OMWW (only artificial nutrients and distilled water); 2 replicas for each condition was carried out and 5 samples collected from each replica; despite this procedure, some parameters exhibits high variability. The bioreactors were fed with a continuous supply of air and an intermittent one of 𝐶𝑂2, and the
illumination was as described in experimental section. Due to the OMWW natural acidic pH, it was adjusted to around 6.5 in the bioreactors, keeping in mind that in normal growth conditions with C.vulgaris, its pH will be around 7 to 7.5, a neutral to slightly alkaline one. As seen in fig. 4.1, the introduction of a very small amount of OMWW had a clear negative effect on the microalgae grow. In fact, the microalgae grow as expected in the control essay, but little growth was seen with different dilutions of OMWW.
26
Fig. 4.1 – Average cell growth in the different bioreactors in the first series of essays with OMWW
By analysing the data in Fig. 4.1, there was indeed minimal growth among dilutions 1% and 2%. Di Caprio, Altimari, & Pagnanelli (2018) [26] noted that this behaviour may be due to several factors, mainly the high phenol concentration, that possesses anti-microbial activity. In batch culture, Di Caprio et al. (2018) [26] used around 9% (v/v) of OMWW and reportedly, their cultures stopped growing around days 5-6. Our dilution was greater, but no significant improvement in microalgae grow were observed. As mentioned in table 4 in subsection 3.2.4.1, OMWW has a very unfavourable C:N:P ratio that certainly has affected growth. Indeed while this ratio alone may be a strong inhibitor, the fact that this effluent has a high phenol content that functions as a potent anti-microbial agent can also play a role [28]. Other factors that may have had influence was pH; the effluent has an initial pH of 5.30, but the culture medium was adjusted to 6.5 which is the recommended pH threshold for microalgae survival. However the studies of Rachlin & Grosso (1991) [29] showed that the ideal pH, is around 7.5 to 8.3, which is attained when C. vulgaris has a sizable growth rate, like it happened on Control. Other factor that could had had a more significant impact was the reduced light penetration in the culture medium, as OMWW possesses a dark brown colour therefore limiting the available light. Indeed, Hodaifa et al, (2009) [30] in their study also mentioned that the use of this particular effluent leads to a lower light penetration affecting growth.
Considering the experimental results obtained in this first series of essays it was decided to try another series with a higher dilution of OMWW, namely 0.25% (v/v) and 0.5%(v/v) in addition to Control (fig. 4.2). The points in the figure represent the mean value of 5 samples.
0,00E+00 5,00E+07 1,00E+08 1,50E+08 2,00E+08 2,50E+08 0 2 4 6 8 10 12 14 16 18 ce lls /m L Days
Average cell growth in the different samples
27
Fig. 4.2 – Average cell growth for the different dilutions in the second series of essays of OMWW
This second series of experiments is different than the previous series, because no significant differences was detected between the control and the essays with OMWW extremely diluted. In the previous one, the differences in growth between Control and OMWW were rapidly noted; here however the growth rates are rather very similar between them. This may be due to the fact that, unlike the first essay, no 𝐶𝑂2 was supplied to the cultures in the second
series of experiments. Adding further C to the cultures would further disrupt an already unbalanced ratio that was at least moderately corrected by the addition of stock solution 1 to the cultures with OMWW. These last results were rather similar to the experiment made in batch culture by DiCaprio et al (2018) [27], although, as mentioned, they used a lower dilution value than us. Noteworthy, as Fig. 4.2 shows, is that in day 20 an abrupt decrease in cell/ number was recorded to all the bioreactors although it rebounded in day 22 when the experiment was terminated; we cannot have definitive answers about what caused such an abrupt change, but during that time, pH was slightly acidic, and as mentioned before, C.vulgaris grows better in a slightly alkaline environment. pH was thus corrected to neutral levels with NaOH solution because CO2 was no longer added. This is important as it can be
seen as a trade-off. As mentioned, adding C to an already unbalanced C:N:P ratio would disrupt microalgae growth, but not adding it leads to a more uncontrolled pH which must be taken in account in future studies with wastewater where the ratio is very unbalanced. Also, during this time, abnormal weather conditions were recorded, and being in a non-controlled environment, temperatures in the lab varied accordingly which may have affected growth.
Thus, from the data collected from the two series of essays, OMWW can be seen as valuable substrate for microalgae growth. In fact, Sanchezvillasclaras at al. (1996) [31] mention its potential, using lower dilutions than the ones we used here. Nonetheless, for our effluent the
0,00E+00 5,00E+07 1,00E+08 1,50E+08 2,00E+08 2,50E+08 3,00E+08 0 5 10 15 20 25 ce lls /m L Days