Indirect methods for determining
the area index of forage cactus cladodes
1Karina Mendes Pinheiro2, Thieres George Freire da Silva2,
Wellington Jairo da Silva Diniz2, Herica Fernanda de Sousa Carvalho2, Magna Soelma Beserra de Moura3
INTRODUCTION
The productive performance of a crop can be assessed throughout its growth by monitoring the plant leaf area (Sanpedro et al. 2008), as the photosynthetic process depends on the interception of photosynthetically active radiation and its conversion capacity into chemical energy (Favarin et al. 2002, Godoy et al. 2007).
For annual broadleaf species, total leaf area, in general, increases up to a limit, in which it remains
ABSTRACT
RESUMO
for some time, decreasing thereafter due to leaf senescence. Thus, crop yield will be greater the faster the plant reaches the maximum leaf area and the longer it remains active (Manfron et al. 2003). Regarding forage cactus, the photosynthetic function
is carried out by the cladode, a modified stem with flat structure to absorb light and store water that
presents different morphological characteristics of emission and linear dimensions, with canopy remaining until harvest time (usually a two-year cycle).
1. Manuscript received in Jun./2014 and accepted for publication in Apr./2015 (http://dx.doi.org/10.1590/1983-40632015v4530617). 2. Universidade Federal Rural de Pernambuco (UFRPE), Unidade Acadêmica de Serra Talhada, Serra Talhada, PE, Brasil.
E-mails: k.agro20@yahoo.com.br, thieres_freire@yahoo.com.br, wellingtonjairo@hotmail.com, hericafernanda_17@hotmail.com. Methods for determining leaf area index have been applied to various agricultural crops. However, their uses are limited to broadleaf plants, with no record for forage cactus, whose radiation interception is performed by the cladode. This study aimed to evaluate the use of different indirect methods to estimate the area index of forage cactus cladode. Cladodes from clones of Nopalea cochenillifera
Salm Dyck, Nopalea cochenillifera Salm Dyck and Opuntia stricta (Haw) Haw were used, being sampled sixty plants per clone, distributed in five sub-areas with 12 plants. Light interception methods with different measurement techniques were evaluated, as well as the planimetric, leaf discs and modeling methods. The estimate of area index of the forage cactus cladode by the modeling method was considered the most accurate one, for presenting precision coefficient values and accuracy above 0.90, as well as a performance varying from very good to excellent. However, its applicability depends on the use of estimated parameters or adjusted value equations. The methods of light interception and its derivations, leaf discs of medium cladodes and planimetry of medium cladodes are not recommended, due to their low precision and accuracy.
KEY-WORDS: Nopalea sp.; Opuntia sp.; canopy analyzer; destructive method.
Métodos indiretos para determinação do índice de área do cladódio da palma forrageira
Métodos de determinação do índice de área foliar têm sido aplicados a várias culturas agrícolas. Todavia, os seus usos limitam-se a plantas folhosas, não havendo registro para a palma forrageira, em que a interceptação da radiação é realizada pelo cladódio. Assim, este estudo objetivou analisar o uso de diferentes métodos indiretos na estimativa do índice de área do cladódio da palma forrageira. Foram utilizados cladódios dos clones
The relation among total leaf area, one-side photosynthetic tissue and the surface that the plant holds above soil characterizes the leaf area index (LAI) (Jonckheere et al. 2004, Monteiro et al. 2005). In forage cactus, the parameter is known as cladode area index (CAI). The LAI or CAI of plants varies according to species, stage of development and seasonality. Moreover, it is highly dependent on local growing conditions and cultural practices (Jonckheere et al. 2004). Portable integrators of leaf area can be used to indirectly obtain LAI or CAI (Blanco & Folegatti 2003).
The estimation of leaf area can be accomplished by direct and indirect methods (Gower et al. 1999). Direct methods are mostly destructive and slow, requiring the collection of leaves in such a manner that it limits its application, due to the low number of samples feasible and the inability to use the same sample over time (Araújo et al. 2005, Adami et al. 2008, Lucena et al. 2011). Indirect methods enable monitoring the growth and leaf expansion of the same plant until the end of the cycle. However, their calibration and evaluation are crucial to guarantee the reliability of results (Lima et al. 2008, Zucoloto et al. 2008).
Indirect methods are based on radiation transmittance measurements through crowns or canopies (Jonckheere et al. 2004, Antunes Júnior et al. 2009). Other methods comprise planimetric measurement, leaf discs and modeling. The first one is used, in some studies, as a reference in the evaluation of other indirect methods (Araújo et al. 2005). It is destructive, laborious and not recommended for application in samples with limited availability. The leaf discs method allows the estimation of the total leaf area by extrapolating the data collected with a puncher with known area and mass from the rest of the leaf (Souza et al. 2012). The modeling method estimates the leaf area with one or more dimensional variables applied to an equation that represents, in a simple way, the leaf area. These equations are also used for studying the plant morphogenesis (Lima et al. 2008).
There is no record of the application of these methods to forage cactus. Thus, this study aimed to
evaluate the efficiency of indirect methods to estimate
the cladode area index (CAI) of three forage cactus clones.
MATERIAL AND METHODS
Data were collected between September and November 2013 from a forage cactus growing area in Serra Talhada, Pernambuco State, Brazil (7º59’S, 38º50’W and altitude of 489 m). The local climate is characterized as BSh, according to the Köppen
classification.
The indirect methods used to estimate the cladode area index of forage cactus clones were: 1) solar radiation interception with different measurement techniques; 2) planimetry of medium cladodes; 3) leaf discs of medium cladodes; 4) modeling based on the total morphogenesis of the plant, representative branching or medium cladode.
These methods were applied to three forage cactus clones: IPA Sertânia (IPA; Nopalea cochenillifera Salm Dyck; spacing: 1.5 m x 0.3 m;
age: 5 years and 1 month); Miúda (MIU; Nopalea
cochenillifera Salm Dyck; spacing: 1.5 m x 0.5 m; age: 4 years and 8 months); and Orelha de Elefante
Mexicana (OEM; Opuntia stricta (Haw) Haw;
spacing: 1.5 m x 0.5 m; age: 4 years). Five sub-areas with 12 plants were evaluated for each clone, with three rows of four plants each, i.e., 60 plants per clone, totaling 180 plants and 15 experimental plots.Height and width measurements were obtained with the aid of a measurement tape, and the number of cladodes per order of appearance in the plant was recorded.
In all sixty plants per clone, readings were performed with a canopy analyzer apparatus (ceptometer, AccuPAR, LP-80, Decagon Devices, Pullman, USA), which is based on light interception by the canopy to estimate the area index of cladodes. The ceptometer settings followed the manufacturer’s recommendations (Decagon Devices 2001), which suggest the inclusion of geographical information from the nearest location (i.e., Recife), the adoption of the leaf distribution parameter of 1.0 (reference value) and calibration based on an external sensor of photosyntetically active radiation (Quantum sensor, Liquor Inc., Lincoln, NE). This ceptometer has a probe of 0.80 m that contains 80 linear sensors, spaced 1.0 cm apart. The photosensors measure photosynthetically active radiation (wavelength of 400-700 nm).
(below the canopy), alternating sides around the plant, with a total of 48 readings per plant, always keeping the apparatus leveled, when the data were collected.
The ceptometer use was evaluated with the
following formats, defined after data collection:
individual (CAI of each plant), plot (average CAI
of all plants in each plot), triangular (average CAI of four plants randomly selected and triangularly arranged in the plot), diagonal (average CAI of three randomly selected plants, arranged diagonally
to the plot), crossed (average CAI of five plants
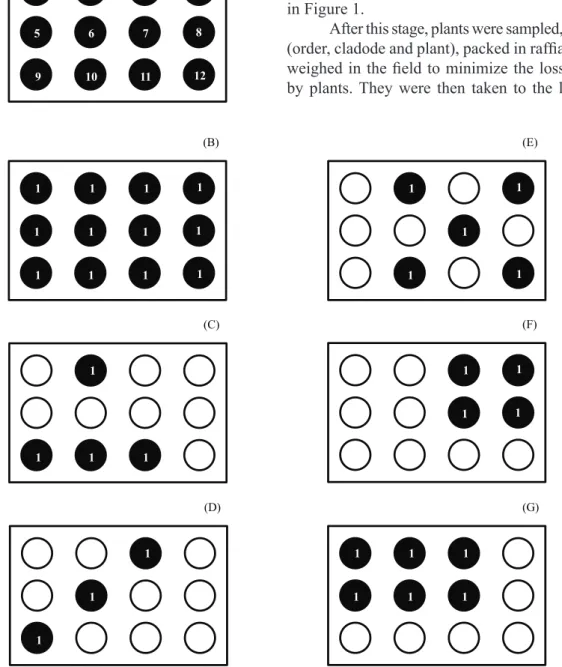
randomly selected, arranged in the shape of an “x” in the plot), square (average CAI of four plants randomly selected, arranged in a rectangular format in the plot) and rectangular (average CAI of six randomly selected plants, arranged in a rectangular shape in the plot). An example of random sampling
of plants within each of the five sub-areas is shown
in Figure 1.
After this stage, plants were sampled, identified (order, cladode and plant), packed in raffia bags and weighed in the field to minimize the loss of water
by plants. They were then taken to the laboratory
Figure 1. Schematic illustration of formats adopted in the photosynthetically active radiation interception method and its derivations, regarding measurement techniques within the experimental sub-area. Plants were randomly selected from each of the five sub-areas with 12 plants, arranged in three rows of four plants. (A) individual; (B) plot; (C) triangular; (D) diagonal; (E) crossed; (F) square; (L) rectangular.
B) (C)
1
5
1
1
6
1
3
7
1
4
8
12
(G)
1
1
9
1
1
10
1
1
11
4
8
12
(D) (E)
1
5
9
1
6
1
3
1
11
1
8
1
(D)
1
5
1
2
1
10
1
7
11
4
8
12
(E) (F)
1
5
9
2
6
10
1
1
1
1
1
1
(A)
1
5
9
2
6
10
3
7
11
4
8
12
(A) (B)
1
1
1
1
1
1
1
1
1
1
1
for weighing and performing individual biometrics of cladodes (length, width, thickness and perimeter).
Among the 60 plants per clone, five were
randomly selected, from which three cladodes of each plant were sampled (one small, one medium and one large), totaling 15 cladodes per clone, in order to apply the indirect planimetry method. In
this method, a white cardboard was fixed at a table
with duct tape, along with a sheet of graph paper, where the cladodes were drawn aiming to account the subsequent occupation area. The leaf area was estimated by the number of occupied squares. The CAI (m2 m-2) was calculated using the average
number of squares of the three cladodes (ns, units), individual area of the squared grid (0.25 cm2) and
conversion factor (10,000) from cm2 to m2, with the
values of total number of cladodes per plant (TCP) and spacing (S1 x S2) of each clone: CAI = (ns . 0.25 . TCP)/ 10,000/ (S1 x S2)
The leaf discs method consisted of using a puncher with diameter of 0.0465 m to remove segments from the middle part of every cladode
from five plants of each clone. The cladodes and
their respective sampled segments were placed in Kraft paper bags and taken to an oven with forced air circulation at 65 ºC, until constant weight was reached. The leaf area index was estimated by the formula LAI = (w . SLA. TCP)/ 10,000/ (S1 x S2), where w is the individual dry weight of the cladode
(g) and SLA the specific leaf area (calculated by the
average relation between the puncher area and the disk dry mass, m2 g-1).
For the modeling method, biometric data of 180 plants of the three clones were considered. Three types of models were applied: I, II and III, described below. From these data, the individual area of cladodes was estimated (ACe, cm2), with
equations previously developed in this study for IPA Sertânia, Miúda and Orelha de Elefante Mexicana clones, respectively as it follows: ACe = 1.6691 . (1 - exp(0.0243 . PC)/ - 0.243; ACe = 0.7198 . (CC . LC); and ACe = 0.7086 . (1 - exp(-0.000045765 . CC . LC)/ 0.000045765, where PC, CC and LC are respectively the perimeter, length and width of the cladode, in cm.
In Model I, the sum of the estimated area of all plants cladodes was considered:
/
ACe
=
CAI
1 i
n
∑
=/ 10,000/ (S1 x S2).
In Model II, a representative branch of each plant was used, so that the ACe of a basal cladode (B) was obtained in order of appearance (1st, 2nd, 3rd, n). These values were multiplied by the number
of cladodes (NC) of each order: CAI = (ACeOB +
ACeO1 . NCO1 + ACeO2 . NCO2 + … + ACeOn . NCOn)/ 10,000/ (S1 x S2).
In Model III, the area of a medium cladode (in this case, the order “x” with the greatest number of cladodes) and the total number of cladodes were considered: CAI = (ACeOx . TCP)/ 10,000/ (S1 x S2). All indirect methods were evaluated in comparison to the results from the direct reference method of digital imaging, with scanning procedures
and settings specific to the culture. For this, the
cladodes of 180 plants were scanned using a commercial scanner, generating TIFF images with a resolution of 200 dpi. Subsequently, the images were
processed by the Lafore software, which classifies
the area based on the greenish tint of the image. The obtained values were considered as the observed reference area (ACr), and the CAI of each plant was calculated by the following expression:
/
ACr
=
CAIr
1 i
n
∑
= / 10,000/ (S1 x S2),being CAIr the observed cladode area index of reference, in m2 m-2.
In comparison with indirect methods of CAI estimation, in relation to the reference method, the data were subjected to statistical indexes (correlation
coefficient - r; concordance index - d) (Willmott et
al. 1985), as well as to estimates of errors (mean bias error - MBE; root mean square error - RMSE; maximum error - MAX; and Student’s t test at 5%). This tests were adopted because the set of CAI values are characterized as paired data, due to the fact that different methods of obtaining the same information were evaluated on the same plant. In this case, the H0 hypothesis from Student’s t test indicates that it is not possible to state that the estimate of the CAI from the indirect method is different from the
reference method (p > 0.05), reflecting that the CAI
values from the two methods are not statistically different. On the other hand, the rejection of H0 (p < 0.05) represents an acceptance of the alternative
hypothesis, in which there is a significant difference
Precision values (r) closer to 1 indicate that the obtained values had a low degree of dispersion, in relation to the average reference values, while accuracy values (d) closer to 1 indicate that the estimated data have a small deviation from the observed data. Statistical error values closer to zero
reflect the reliability of the method. The multiplication
of r and d values estimates the confidence index (c), which represents the performance of the methods,
being classified according to Camargo & Sentelhas
(1997), as shown in Table 1. All statistical analyses were performed using the software Sigmaplot v.10.
RESULTS AND DISCUSSION
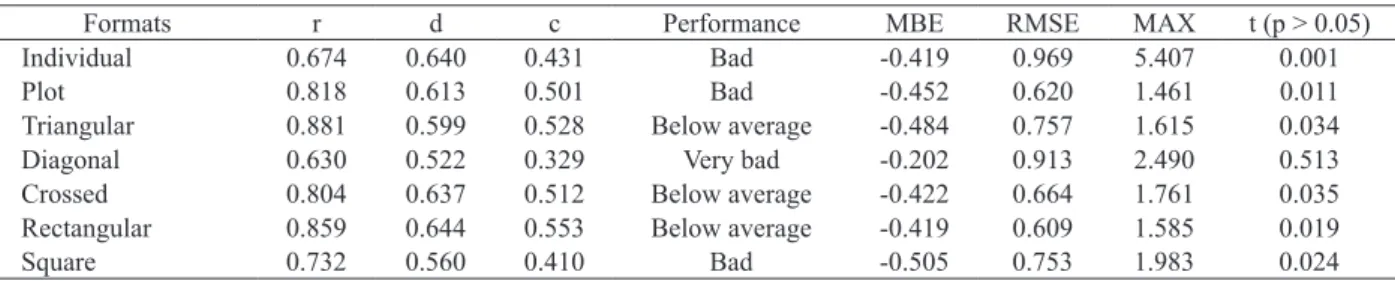
The evaluation of the method of interception of solar radiation by canopy using a ceptometer, applied to the IPA Sertânia clone, showed similar values for precision (r > 0.674) and accuracy (d < 0.644), when estimating the cladode area index (Table 2). However, the performance was from below average to very bad, according to the confidence index. Generally, the estimate of CAI using this method resulted in underestimation, as demonstrated by the negative values of MBE, meaning a higher error, when consided a wide range of CAI values.
The low accuracy, regardless of measurement format, promoted higher RMSE values, showing the error in absolute terms, when using the ceptometer for estimating the CAI of an isolated forage cactus plant. This can also be seen in the resulting maximum errors for all formats (> 1.461 m2 m-2), i.e., highest
absolute errors. Only the diagonal format did not differ with respect to the direct method of digital imaging (p > 0.05), despite its low performance.
The method of radiation interception for the Miúda clone showed an even lower performance, in relation to the IPA Sertânia clone (Table 3). The diagonal format was the only one in which the results
were not significantly different (p= 0.067) from the direct method, but it is not recommended for forage cactus, due to the low magnitude of precision and accuracy indexes.
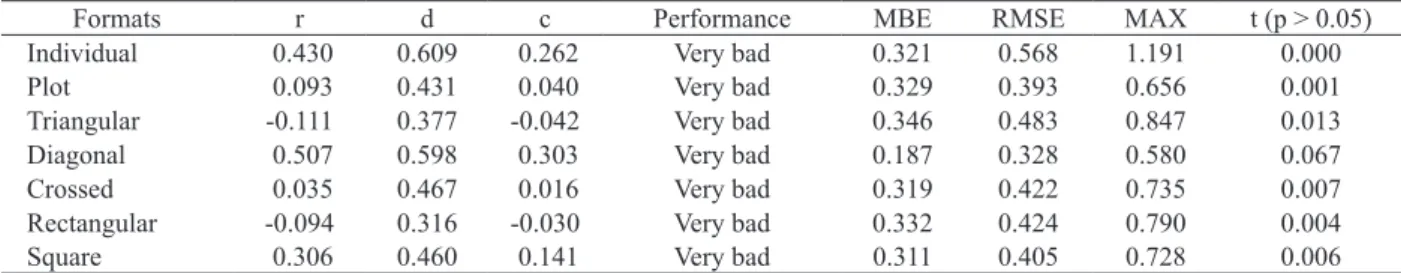
A similar result was obtained for the Orelha de Elefante Mexicana clone, with a performance ranging from bad to very bad, due to low r and d values. Even for the diagonal and crossed formats,
with no significant differences, in relation to the direct
method, the performances were considered very bad (Table 4). The low performance of the interception of
solar radiation method is associated with difficulties
in performing measurements on non-homogeneous
crowns, due to variations in the flux density of solar
radiation at the time of the readings. Below a canopy, the radiation may vary from full sun to low levels, within a few inches.
Although the manual does not have information related to the use of this method for forage cactus cultivation, the increase in the number of readings could be a compensating factor for the high variability in the incidence of radiation below plant’s canopy, resulting in more reliable and representative measurements (Jonckheere et al. 2004). However, that was not
Table 1. Performance evaluation by confidence index (c), according to Camargo & Sentelhas (1997).
c Value Performance
> 0,85 Best
0,76-0,85 Very good
0,66-0,75 Good
0,61-0,65 Average
0,51-0,60 Below average
0,41-0,50 Bad
≤ 0,40 Very bad
r - correlation index (decimal); d - concordance index (decimal); c - confidence index; MBE - estimated mean error (m2 m-2); RMSE - root mean square of average error
(m2 m-2); ME - maximum error (m2 m-2); t - Student’s test at 5 %.
Formats r d c Performance MBE RMSE MAX t (p > 0.05)
Individual 0.674 0.640 0.431 Bad -0.419 0.969 5.407 0.001
Plot 0.818 0.613 0.501 Bad -0.452 0.620 1.461 0.011
Triangular 0.881 0.599 0.528 Below average -0.484 0.757 1.615 0.034
Diagonal 0.630 0.522 0.329 Very bad -0.202 0.913 2.490 0.513
Crossed 0.804 0.637 0.512 Below average -0.422 0.664 1.761 0.035
Rectangular 0.859 0.644 0.553 Below average -0.419 0.609 1.585 0.019
Square 0.732 0.560 0.410 Bad -0.505 0.753 1.983 0.024
verified, because the low uniformity of the canopy
is induced by the morphology of cladodes emission (Menezes et al. 2005). In uniform canopies, this method has achieved excellent results (Cunha et al. 2010).
Regarding the planimetry method of average cladodes (Table 5), very good and good performances
were respectively verified for Miúda and Orelha de
Elefante Mexicana clones. However, for the Miúda
one, there was a significant difference in values relating
to the direct method (p < 0.05), thus, the use of this method for this clone is not recommended. The good performance for the Orelha de Elefante Mexicana
r - correlation index (decimal); d - concordance index (decimal); MBE - estimated mean error (m2 m-2); RMSE - root mean square of average error (m2 m-2); ME -
maximum error (m2 m-2); t - Student’s test at 5 %; Total LD - leaf discs of all plant’s cladodes; LD branch - leaf discs of cladodes of a representative branch; LD medium
cladode - leaf discs of the plant’s medium cladodes; IPA - IPA Sertânia; MIU - Miúda; OEM - Orelha de Elefante Mexicana.
Clones Formats r d c Performance MBE RMSE MAX t (p > 0.05)
IPA
Planimetry 0.139 0.475 0.066 Very bad 0.072 0.481 0.636 0.776
Total LD 0.336 0.290 0.097 Very bad -1.732 1.781 2.369 0.001
LD branch -0.289 0.299 -0.086 Very bad -1.558 1.633 2.362 0.003
LD medium cladode -0.349 0.263 -0.092 Very bad -1.614 1.770 2.684 0.011
MIU
Planimetry 0.854 0.898 0.767 Very good -0.398 0.388 0.601 0.006
Total LD 0.786 0.296 0.233 Very bad -0.332 0.336 0.410 0.000
LD branch -0.221 0.128 -0.028 Very bad -0.754 0.760 0.859 0.000
LD medium cladode -0.422 0.123 -0.052 Very bad -0.765 0.771 0.870 0.000
OEM
Planimetry 0.879 0.786 0.691 Good 0.133 0.247 0.376 0.269
Total LD -0.662 0.115 0.076 Very bad -0.275 1.527 2.359 0.732
LD branch -0.443 0.224 0.099 Very bad -0.009 1.530 2.399 0.991
LD medium cladode -0.787 0.076 0.060 Very bad -0.667 1.540 2.514 0.391 Table 5. Evaluation of indirect methods of planimetry from medium cladode and leaf discs applied to forage cactus clones (Serra
Talhada, Pernambuco State, Brazil, 2013).
r - correlation index (decimal); d - concordance index (decimal); MBE - estimated mean error (m2 m-2); RMSE - root mean square of average error (m2 m-2); ME - maximum
error (m2 m-2); t - Student’s test at 5 %.
Formats r d c Performance MBE RMSE MAX t (p > 0.05)
Individual 0.628 0.733 0.460 Bad 0.444 0.822 2.011 0.000
Plot 0.531 0.634 0.034 Very bad 0.448 0.681 0.930 0.028
Triangular 0.519 0.625 0.324 Very bad 0.451 0.671 1.106 0.023
Diagonal 0.473 0.617 0.292 Very bad 0.367 0.786 1.001 0.147
Crossed 0.472 0.621 0.293 Very bad 0.411 0.720 0.935 0.067
Rectangular 0.676 0.710 0.480 Bad 0.407 0.618 0.921 0.027
Square 0.639 0.692 0.442 Bad 0.411 0.659 0.983 0.040
Table 4. Evaluation of the canopy indirect method of radiation interception (ceptometer) applied to different formats of plot measurement for estimating the cladode area index of the Orelha de Elefante Mexicana clone (Serra Talhada, Pernambuco State, Brazil, 2013).
r - correlation index (decimal); d - concordance index (decimal); MBE - estimated mean error (m2 m-2); RMSE - root mean square of average error (m2 m-2); ME - maximum
error (m2 m-2); t - Student’s test at 5 %.
Formats r d c Performance MBE RMSE MAX t (p > 0.05)
Individual 0.430 0.609 0.262 Very bad 0.321 0.568 1.191 0.000
Plot 0.093 0.431 0.040 Very bad 0.329 0.393 0.656 0.001
Triangular -0.111 0.377 -0.042 Very bad 0.346 0.483 0.847 0.013
Diagonal 0.507 0.598 0.303 Very bad 0.187 0.328 0.580 0.067
Crossed 0.035 0.467 0.016 Very bad 0.319 0.422 0.735 0.007
Rectangular -0.094 0.316 -0.030 Very bad 0.332 0.424 0.790 0.004
Square 0.306 0.460 0.141 Very bad 0.311 0.405 0.728 0.006
clone resulted not only from good precision and accuracy, but also due to low estimated errors, showing that it is an alternative for estimating the CAI of this clone. On the other hand, for the IPA Sertânia clone, its performance was low, although no difference, in
relation to the direct method, was verified.
Cunha et al. (2010), comparing estimated leaf area methods using Chrysbalaus icaco L. (guajurú),
observed a good accuracy (R2 = 0.840) for the
planimetry method, but the authors state that the format of leaves affects its applicability, because
leaves may not uniformly fill the squares.
The forage cactus cladodes have irregularities in their formats, and its thickness varies along its length, making the application of this method
difficult in most clones. For Miúda, its performance
was better, due to a small area and regularity in the cladodes format, leading to a higher precision and accuracy.
In the method of leaf discs, it was found that all derivations (total, branch and medium cladode)
were significant only for the Orelha de Elefante
Mexicana clone, with a higher r than d. The others showed a very bad performance. The high variability
of the specific leaf area, regarding the clones, age and
insertion position in the plant, can be responsible for the poor performance. These results were different from those found by other authors, such as Souza et al. (2012), who compared methods of leaf area measurement for watermelon crops. However, some authors mentioned the need of a correction factor to be multiplied by leaf area index values estimated by the leaf discs method, seeking its actual calibration (Dombroski et al. 2010).
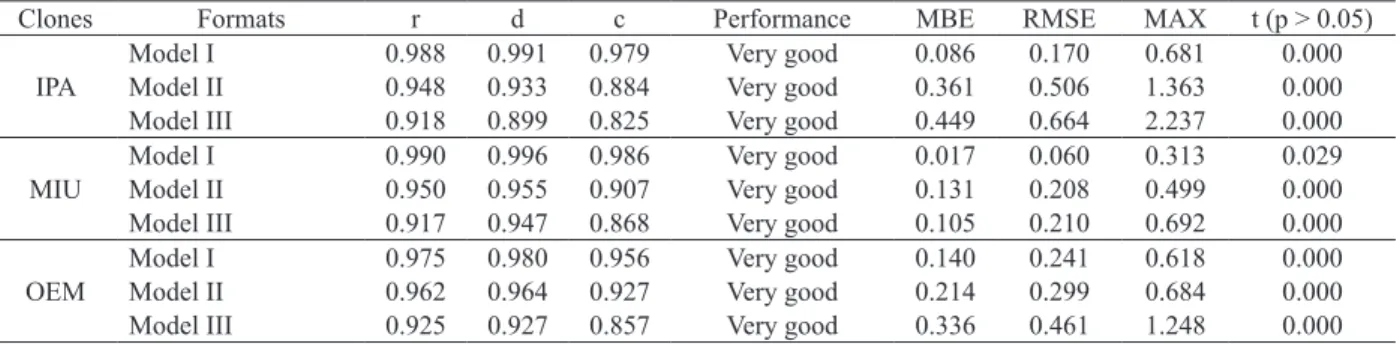
Modeling methods (I, II and III) showed high precision and accuracy index values. However,
it is noteworthy that the Model III, which uses morphogenesis only from the medium cladode, is
the simplest one. The performance classifications
obtained by the three settings varied from good to very good, with low estimated errors (Table 6). However, there were differences between its estimated and observed values from the direct method (p < 0.05).
Thus, the applicability of the three model
configurations for clones needs to be complemented
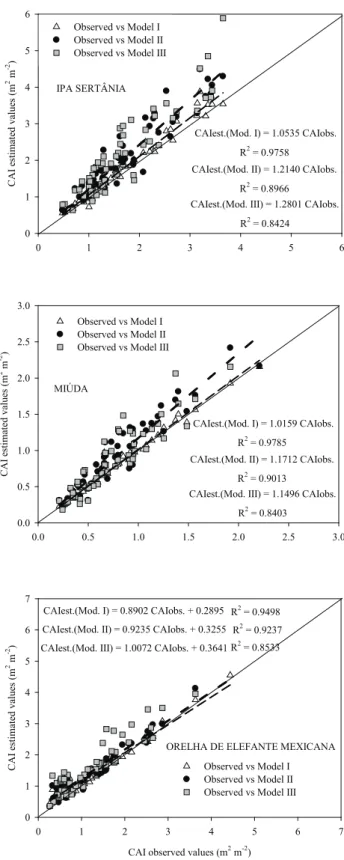
by the use of linear equations or parameters that vary according to the modeling method used (I, II or III) and the forage cactus clone (Figure 2).
For the IPA clone, the adjustment coefficients to
be multiplied by the CAI values estimated by the modeling methods (I, II and III) are the inverse of
the angular coefficients of equations (Figure 2), i.e.,
respectively 1/1.0535, 1/1.2140 and 1/1.2801. For the Miúda clone, these values are respectively 1/1.0159, 1/1.1712 and 1/1.1496, for the modeling methods I, II and III. For the Orelha de Elefante Mexicana
clone, linear coefficients were significant regarding
the Student’s t test (p < 0.05). Thus, the results for the CAI, considering the three modeling methods, should be applied to complete linear equations, as shown in Figure 2.
The modeling method has been considered the most accurate one, when estimating LAI of broadleaf crops (Lima et al. 2008). However, because of the number of leaves, other morphological features are used in relation to the LAI. Barbosa et al. (2012), when estimating LAI, found that the variability of the
shape of crowns and the geometry of leafless regions
were the properties that most strongly explained coffee’s LAI. Also working with coffee, Favarin et al.
(2002) set equations that reflect a close linear relation
observed between LAI and characteristics related to
r - correlation index (decimal); d - concordance index (decimal); MBE - estimated mean error (m2 m-2); RMSE - root mean square of average error (m2 m-2); ME -
maximum error (m2 m-2); t - Student’s test at 5 %; Model I - morphogenesis of all plant’s cladodes; Model II - morphogenesis of cladodes of a representative branch;
Model III - morphogenesis of plant’s medium cladodes; IPA - IPA Sertânia; MIU - Miúda; OEM - Orelha de Elefante Mexicana.
Clones Formats r d c Performance MBE RMSE MAX t (p > 0.05)
IPA
Model I 0.988 0.991 0.979 Very good 0.086 0.170 0.681 0.000
Model II 0.948 0.933 0.884 Very good 0.361 0.506 1.363 0.000
Model III 0.918 0.899 0.825 Very good 0.449 0.664 2.237 0.000
MIU
Model I 0.990 0.996 0.986 Very good 0.017 0.060 0.313 0.029
Model II 0.950 0.955 0.907 Very good 0.131 0.208 0.499 0.000
Model III 0.917 0.947 0.868 Very good 0.105 0.210 0.692 0.000
OEM
Model I 0.975 0.980 0.956 Very good 0.140 0.241 0.618 0.000
Model II 0.962 0.964 0.927 Very good 0.214 0.299 0.684 0.000
Model III 0.925 0.927 0.857 Very good 0.336 0.461 1.248 0.000
the amount of plant leaves and canopy volume. This method has the advantage of being no destructive and easy to handle. However, for crops with no uniform crowns, i.e., forage cactus, parameters or equations are needed for the easy and accurate estimation of CAI values. Dombroski et al. (2010) mention the need for such adjustment for other indirect methods.
CONCLUSIONS
1. The method of interception of solar radiation by the canopy with ceptometer is not recommended for estimating the cladodes area index of forage cactus clones.
2. The methods of planimetry and leaf discs of cladodes should not be applied for estimating the cladodes area index of cactus.
3. The modeling method has a better statistical performance, being the most suitable for estimating the cladodes area index. However, specific
equations and parameters have to be fitted for each
type of model (I, II or III) and genotype studied.
REFERENCES
ADAMI, M. et al. Estimativa de área de folíolos de soja usando imagens digitais e dimensões foliares. Bragantia, Campinas, v. 67, n. 4, p. 1053-1058, 2008.
ANTUNES JÚNIOR, M. Z. et al. Métodos não destrutivos para estimativa de densidade de área foliar em mangueira.
Pesquisa Agropecuária Brasileira, Brasília, DF, v. 44,
n. 12, p. 1624-1630, 2009.
ARAÚJO, E. C. E.; SANTOS, E. P.; PRADO, C. H. B. A. Estimativa da área foliar da mangueira (Mangifera
indica L.) cvs. Tommy Atkins e Haden, utilizando
dimensões lineares. Revista Brasileira de Fruticultura, Jaboticabal, v. 27, n. 2, p. 308-309, 2005.
BARBOSA, J. P. R. A. et al. Estimativa do IAF de cafeeiro a partir do volume de folhas e arquitetura da planta. Coffee
Science, Lavras, v. 7, n. 3, p. 267-274, 2012.
BLANCO, F. F.; FOLEGATTI, M. V. A new method for estimating the leaf area index of cucumber and tomato plants. Horticultura Brasileira, Brasília, DF, v. 21, n. 4, p. 666-669, 2003.
CAMARGO, A. P.; SENTELHAS, P. C. Avaliação de desempenho de diferentes métodos de estimativa da evapotranspiração potencial no Estado de São Paulo.
Revista Brasileira de Agrometeorologia, Santa Maria, v. 5,
n. 1, p. 89-97, 1997.
Figure 2. Relation between observed reference values and estimated values by modeling methods (I, II and III) of the cladode area index of forage cactus clones (IPA Sertânia, Miúda and Orelha de Elefante Mexicana) (Serra Talhada, Pernambuco State, Brazil, 2013). The parameters and equations were significant by the Student’s t-test, at 5 %.
0 1 2 3 4 5 6
C A I es ti m at ed v al u es ( m
2 m -2) 0 1 2 3 4 5 6
Observed vs Model I Observed vs Model II Observed vs Model III
CAIest.(Mod. I) = 1.0535 CAIobs.
R2 = 0.9758
CAIest.(Mod. II) = 1.2140 CAIobs.
R2 = 0.8966
CAIest.(Mod. III) = 1.2801 CAIobs.
R2 = 0.8424 IPA SERTÂNIA
0.0 0.5 1.0 1.5 2.0 2.5 3.0
C A I es ti m at ed v al u es ( m
2 m -2) 0.0 0.5 1.0 1.5 2.0 2.5 3.0
Observed vs Model I Observed vs Model II Observed vs Model III
CAIest.(Mod. I) = 1.0159 CAIobs.
R2 = 0.9785
CAIest.(Mod. II) = 1.1712 CAIobs.
R2 = 0.9013 CAIest.(Mod. III) = 1.1496 CAIobs.
R2 = 0.8403 MIÚDA
CAI observed values (m2 m-2)
0 1 2 3 4 5 6 7
C A I es ti m at ed v al u es ( m
2 m -2) 0 1 2 3 4 5 6 7
Observed vs Model I Observed vs Model II Observed vs Model III CAIest.(Mod. I) = 0.8902 CAIobs. + 0.2895 R2 = 0.9498
CAIest.(Mod. II) = 0.9235 CAIobs. + 0.3255 R2 = 0.9237
CAIest.(Mod. III) = 1.0072 CAIobs. + 0.3641 R2 = 0.8533
CUNHA, J. L. X. L. et al. Comparação de métodos de área foliar em Chrysobalanus icaco L. Agropecuária Científica
no Semiárido, Patos, v. 6, n. 3, p. 22-27, 2010.
DECAGON DEVICES. AccuPAR Linear PAR/LAI
ceptometer: operator’s manual version 3.4. Pullman:
Decagon Devices Inc., 2001.
DOMBROSKI, J. L. D. et al. Análise comparativa de métodos de determinação de área foliar em Pinha (Annona
Squamosa L.). Revista Verde, Mossoró, v. 5, n. 3, p.
188-194, 2010.
FAVARIN, J. L. et al. Equações para a estimativa do índice de área foliar do cafeeiro. Pesquisa Agropecuária
Brasileira, Brasília, DF, v. 37, n. 6, p. 769-773, 2002.
GODOY, L. J. G. et al. Análise da imagem digital para estimativa da área foliar em plantas de laranja “Pera”.
Revista Brasileira de Fruticultura, Jaboticabal, v. 29, n. 3,
p. 420-424, 2007.
GOWER, S. T.; KUCHARIK, C. J.; NORMAN, J. M. Direct and indirect estimation of leaf area index, ƒAPAR, and net primary production of terrestrial ecosystems. Remote Sensing of Environment, Amsterdam, v. 70, n. 1, p. 29-51, 1999.
JONCKHEERE, I. et al. Review of methods for in situ
leaf area index determination - part I: theories, sensors and hemispherical photography. Agricultural and Forest
Meteorology, Amsterdam, v. 121, n. 1-2, p. 19-35, 2004.
LIMA, C. J. G. S. et al. Modelos matemáticos para estimativa de área foliar de feijão-caupi. Revista Caatinga, Mossoró, v. 21, n. 1, p. 120-127, 2008.
LUCENA, R. R. M. et al. Medição de área foliar de aceroleira. Revista Caatinga, Mossoró, v. 24, n. 2, p. 40-45, 2011.
MANFRON, P. A. et al. Modelo de índice de área foliar da cultura do milho. Revista Brasileira de Agrometeorologia, Santa Maria, v. 11, n. 2, p. 333-342, 2003.
MENEZES, R. S. C.; SIMÕES, D. A.; SAMPAIO, E. V. S. B. A palma no Nordeste do Brasil:conhecimento atual e novas perspectivas de uso. Recife: UFPE, 2005.
MONTEIRO, J. E. B. A. et al. Estimação da área foliar do algodoeiro por meio de dimensões e massa das folhas.
Bragantia, Campinas, v. 64, n. 1, p. 15-24, 2005.
SANPEDRO, M. C. G. et al. Seasonal variations of leaf area index of agricultural fields retrieved from Landsat data. Remote Sensing of Environment, Amsterdam, v. 112, n. 3, p. 810-824, 2008.
SOUZA, M. S. S. et al. Comparação de métodos de mensuração de área foliar para a cultura da melancia.
Pesquisa Agropecuária Tropical, Goiânia, v. 42, n. 2,
p. 241-245, 2012.
WILLMOTT, C. J. et al. Statistics for evaluation and comparison of models. Journal of Geophysical Research, Ottawa, v. 90, n. 5, p. 8995-9005, 1985.