THE INFLUENCE OF CLADODE MORPHOLOGY ON THE CANOPY
FORMATION OF FORAGE CACTUS PLANTS
1MARCELA LÚCIA BARBOSA2, THIERES GEORGE FREIRE DA SILVA3*, SERGIO ZOLNIER2, SÉRVULO
MERCIER SIQUEIRA E SILVA4, ANTONIO JOSÉ STEIDLE NETO5
ABSTRACT – Here we aimed to evaluate the influence of cladode morphology on the canopy formation of forage cactus plants. The study was carried out in Serra Talhada, the State of Pernambuco, using the IPA Sertânia (IPA), Miúda (MIU), and Orelha de Elefante Mexicana (OEM) clones, which were submitted to three irrigation depths (2.5, 5.0, or 7.5 mm) and three irrigation intervals (7, 14, or 28 days) from March 2012 to August 2013. Cladode and plant canopy biometric data were obtained during the experimental period. We found that the characteristics of the second and third order cladodes contributed most to the canopy formation of clones of the genus Nopalea (IPA and MIU), whereas, for the genus Opuntia (OEM), the first and third order cladodes contributed most. Overall, we found that the influence of the cladode variables on the canopy growth of forage cactus is more associated with the characteristics of the genus than to the peculiaritiesof the clones.
Keyword: Statistical analysis. Clones. Biometrics data. Nopalea sp.. Opuntia sp..
ASSOCIAÇÃO MORFOLÓGICA DE CLADÓDIOS COM A FORMAÇÃO DO DOSSEL DA PALMA FORRAGEIRA
RESUMO- O objetivo foi avaliar a influência das características morfológicas dos cladódios sobre a formação do dossel da palma forrageira. O estudo foi conduzido em Serra Talhada, PE, com os clones IPA Sertânia - IPA, Miúda - MIU e Orelha de Elefante Mexicana - OEM, os quais foram submetidos a três lâminas (2,5; 5,0; e 7,5 mm) e três intervalos de irrigação (7; 14 e 28 dias), no período compreendido entre março 2012 a agosto de 2013. Dados das dimensões dos cladódios e do dossel das plantas foram obtidos ao longo do tempo. A matriz de correlação de Pearson foi elaborada, e análises canônicas e de trilha foram aplicadas para avaliação da associação entre as variáveis. Verificou-se que, as características dos cladódios de 2ª e de 3ª ordens foram as que mais contribuíram na formação do dossel dos clones do gênero Nopalea (IPA Sertânia e Miúda), enquanto para a Orelha de Elefante Mexicana do gênero Opuntia foram as dos cladódios de primeira 1ª e 3ª ordens. Conclui-se que, a influência das variáveis dos cladódios sobre o crescimento do dossel da palma forrageira esteve mais associada às características do gênero, do que a peculiaridades dos clones.
Palavras-chave: Análise estatística. Clones. Dados biométricos. Nopalea sp.. Opuntia sp..
_______________________________
*Corresponding author
1Received for publication in 06/08/2016; accepted in 03/15/2017.
Paper extracted from the master’s dissertation of the first author.
2Department of Agricultural Engineering,Universidade Federal de Viçosa, Viçosa, MG, Brazil; [email protected], [email protected].
Rev. Caatinga
INTRODUCTION
As a photosynthetic structure, leaves play a primordial role in plant growth, being in harmony with the other organs and with the edaphoclimatic conditions. Leaves are mostly responsible for the interception of solar radiation, which will promote the metabolic processes of sugar formation and the accumulation of plant mass (GIBSON et al., 2011). The amount of radiation absorbed, as well as water and nutrient supplies, are productive indicators (WEERAKKODY; SURIYAGODA, 2015).
In addition to presenting various physiological adaptations, such as the nocturnal uptake of CO2 for greater efficiency of water use, Cacti species, such as the cactus forage, display morphological adaptations in their photosynthetic structures. Their leaves are atrophied, with the appearance of thorns in their place, so that photosynthesis is carried out in structures called cladodes (PEÑA-VALDIVIA et al., 2008; SILVA et al., 2010; SILVA et al., 2014a).
Clones of cactus forage of the Opuntia and
Nopalea generaare widely grown in the northeast of Brazilian, especially Orelha de Elefante Mexicana, which belongs to the Opuntia genus, and Miúda and IPA Sertânia of genus Nopalea. These clones are widely used because of their resistance to Carmim cochineal, their major pest, as well as their use as an animal feed source, especially during the dry season (QUEIROZ et al., 2015; SILVA et al., 2015).
The distribution, size, shape, and number of
cladodes of the different clones define the canopy architecture of the forage cactus plants (FLORES-HERNÁNDEZ et al., 2004; SILVA et al.,
2010; PINHEIRO et al., 2014; SILVA et al., 2015), which will affect the photosynthetic capacity of the crop and, therefore, its yield. However, other factors such as irrigation management, fertilization, spacing, among others, climatic conditions, and growth habit can also influence the architecture of these plants (SILVA et al., 2014a; SILVA; SANTOS, 2006). Thus, the association between the growth of cladodes and the plants allows us to identify which characteristics will contribute most to the formation of the canopy of the forage cactus.
Canonical correlation analysis determines the linear relationship between groups or sets of variables, identifying the existence and the maximum correlation between different groups (BRUM et al., 2011). Track analysis complements this information, revealing whether the relationship between the variables is a cause or an effect or influenced by others, identifying which variables have the greatest weight and contribution. These approaches have been used when testing the interrelationships between characteristics of cladodes, plant, and forage cactus yields conducted under dryland conditions (PEÑA-VALDIVIA et al., 2008; SILVA et al., 2010; NEDER et al., 2013;
PINHEIRO et al., 2014; SILVA et al., 2015).
The objective of this study was to evaluate the influence of the morphological characteristics of the cladodes on the canopy formation of the forage cactus.
MATERIAL AND METHODS
Clones of forage cactus were planted at the Instituto Agronômico de Pernambuco (7º 56’ 20’’ S; 38º 17’ 31’’ O; 498 m), in Serra Talhada, the state of Pernambuco in the Brazilian semi-arid region, in February 2010. The soil was classified as a yellow-red eutrophic Argisol with sandy loam texture. The spacing adopted in the experiment was 1.6 × 0.2 m, with rows in a counter line. During the first cycle, cultivation was conducted in dry conditions until March 2012, when the harvest was carried out, maintaining only the basal cladode. From this date, the experimental period of the present study was started, characterizing the second production cycle, which finished in August 2013, totaling 532 days.
The forage cactus was arranged in a random block design, in a factorial arrangement of 3 × 3 × 3 + 3 with split-split-plot, plus one control of
each clone, and three replications, totalizing 90 experimental split-plots. The plots were
composed of three fixed water depths for water restoration in the soil (L1: 2.5 mm, L2: 5.0 mm and L3: 7.5 mm, plots), the subplots for three frequencies (F1: 7 days; F2: 14 days, and F3: 28 days, subplots), and the split-split plots by the IPA-Sertânia - IPA
(Napolea cochenillifera (L.) Salm-Dick.), Miúda - MIU (Napolea cochenillífera (L.) Salm-Dick.) and Orelha de Elefante Mexicana - OEM (Opuntia stricta (Haw.) Haw.).
In total, the experiment presented 90 split-split-plots, each composed of 4 rows of
20 plants, totaling 80 plants, with an area of 25.6 m2 and useful area of 11.52 m2. The useful area consisted of 32 plants located in the two central rows.
Clones of forage cactus received 756 (L7.5 F7), 672 (L5.0 F7), 622 (L7.5 F14), 586 (L2.5 F7), 579 (L5.0 F14), 555 (L7.5 F28), 536 (L2.5 F14), 535 (L5.0 F28), 514 (L2.5 F28) and 493 (Control) mm year-1 of water.
Irrigation was carried out using a drip system (drippers spaced at 0.40 m). Crop treatments were carried out to eliminate weeds, such as herbicide application, as well as disease control, whenever necessary. Monthly fertilization was done with the
application of 50 kg ha-1 of NPK formulation
14-00-18, according to the recommendation of the Agronomic Institute of Pernambuco.
(07/24/2012 - DAC 146, 08/22/2012 - DAC 175, 09/19/2012 - DAC 203, 10/27/2012 - DAC 241, 11/24/2012 - DAC 269, 12/22/2012 - DAC 297, 01/26/2013 - DAC 332, 02/23/2013 - DAC 360, 03/23/2013 - DAC 388, 04/27/2013 - DAC 423, 05/25/2013 - DAC 451, 07/06/2013 - DAC 493, 07/27/2013 - DAC 514).
In these campaigns, data on plant growth and cladodes were obtained, and measurements were always performed in the same plants. In the cladode, measurements were made up to the 4th order of appearance, from a representative branch of the plant. These measurements included the length of cladodes (BCL, CL1, CL2, CL3 and CL4, where B – base cladode and 1, 2, 3 and 4, orders of cladode emergence), width (BCW, CW1, CW2, CW3 and CW4), the perimeter (BCP, CP1, CP2, CP3 and CP4) and thickness (BCT, CT1, CT2, CT3 and CT4), which were measured with a tape measure and a plastic caliper. In addition, the area values of cladodes were calculated for all orders (BCA, CA1, CA2, CA3 and CA4), using statistical models adjusted by Silva et al. (2014a) for clones, according to data on length and width of cladodes.
The plant measurements consisted of structural characteristics obtained during the biometric monitoring campaigns. In this group, the height of the plant (HP, from the soil surface to the highest cladode) and the width of the plant (PW, at the widest ends) were recorded. These data were obtained using a tape measure, and the number of total cladodes in each plant (TNC) was counted. Finally, a classification was made according to the order of appearance of the cladodes, ranging from the first order (NC1, the first units to appear from the basal cladode) to the fourth order (NC2, NC3, NC4), based on the clone. The cladode area index (CAI) was determined by the ratio between the sum of the cladode areas and the plant spacing (1.6 × 0.2 m).
The experimental data were subdivided into two groups: A) structural characteristics of the plant: “Plant”; and, B) structural characteristics of the cladodes: “Cladodes”. The elements of the first group were considered as explanatory variables and the second as response variables.
The Plant group was represented by plant height and width (PH, PW); total number of cladodes (TNC); number of cladodes in order, ranging from 1 to 4 on the clone basis (NCOx) and the cladode area index (CAI), which was determined by the ratio between the sum of the area of cladodes and the planting spacing (1.6 × 0.2 m). The area of the cladodes (CA) was obtained using models proposed by Silva et al. (2014b), which were adjusted for the clones IPA Sertânia, Miúda and Orelha de Elefante Mexicana, based on data of length and width of the cladodes.
The Cladode group consisted of the following variables: cladode length (CL1, CL2, CL3 and CL4), cladode width (CW1, CW2, CW3 and CW4),
cladode thickness (CT1, CT2, CT3 and CT4), cladodes perimeter (CP1, CP2, CP3 and CP4), and cladodes area from first to fourth order (CA1, CA2, CA3 and CA4).
To perform the analyses, the cladodes up to the third order of appearance were included for IPA and OEM clones and up to the 4th order for the MIU clone. This procedure was necessary because the number of fourth-order cladodes for IPA and OEM and fifth order clones for MIU was reduced. Thus, to avoid misinterpretation of results, it was decided not to count these cladodes in small numbers.
Also, the grouped data for each clone were mean values of the plant growth and cladode variables, regardless of the water regimes (water depth × frequency), that is, the average of each variable was derived from 30 observations, referring to the experimental split-plots with the same clone.
“Plant” (Response) and
“Cladodes” (Explanatory) groups were interrelated to evaluate the individual contribution of the morphological characteristics of the cladodes on the formation of the vegetative canopy of the plants.
The experimental data were first submitted to the Lilliefors test to verify their normality at a significance level of 5%.
Then, the response variables were related to the explanatory variables by means of the Pearson Correlation Matrix. In this analysis, the existence, direction, and intensity of the linear relationship between the groups of variables were evaluated by means of Pearson’s linear correlation coefficient (r), between -1 a +1. Values closer to 1 indicate the existence of a strong linear relationship, whereas closer to zero is the existence of a weak linear correlation between the variables. The relationship between explanatory variables and responses was obtained by the equation:
(1) where: r(XY) is the Pearson correlation coefficient for the variables X (response) and Y (explanatory);
σ(X,Y), the covariance between the variables X and Y; and σ(X) and σ(Y) are the standard deviation of the variables X and Y, respectively.
The classification of the intermediate Pearson correlation coefficients was interpreted according to the one used by Thomaz et al. (2012), which comprised the following ranges: 0 to 0.19, “very weak”; 0.20 to 0.39, “weak”; 0.40 to 0.69, “moderate”; 0.70 to 0.89, “strong” and 0.90 to 1.00, “very strong”. In addition, the correlation signal was analyzed as positive (+1) or negative (-1) and the significance of the coefficients (p <0.01 and p <0.05) was analyzed by Student’s t-test.
For the multicollinearity analysis, only the data of the explanatory variables correlated with at least one of the response variables were used. In this analysis, a new data screening was performed,
Rev. Caatinga
discarding the variables that, within the same group, presented correlation with each other with strong multicollinearity (NC >100) (TOEBE; CARGNELUTTI FILHO, 2013). The presence of strong multicollinearity may lead to misinterpretations of the analyses, which may lead to inconsistent estimates of canonical correlation coefficients, as well as an overestimation of the effects of the explanatory variables on the response variables.
In the canonical correlations, only the variables with weak multicollinearity (NC < 100) were used (TOEBE; CARGNELUTTI FILHO, 2013), in which the associations between groups of variables were evaluated, such that the linear correlation between these combinations was maximal. In this analysis, the canonical variables must be orthogonal, that is, linearly independent of each other. The canonical axes were set based on the number of variables of the smallest group, so that the canonical correlations between them were evaluated by means of the Chi-square test, at the level of 1% of probability. The following equation was applied for the determination of the canonical coefficients between the groups of variables (FERREIRA, 2011):
(2) where: is the covariance among the canonical variables U and V; is the standard deviation of the canonical variable U and is the standard deviation of the canonical variable V.
In the track analysis, the correlation coefficient was unfolded, allowing us to determine the degree of the effect of an explanatory variable on the response variable, by means of the track coefficient. In this analysis, the coefficient of partial correlation between two variables was calculated, disregarding the effect of the others, by means of the following relationship:
(3) where i is a response variable, rXiZ is the correlation coefficient between a response variable and nth explanatory variables; rYiZ is the correlation coefficient between the response variable and the nth explanatory variables. The significance of the partial correlation is identical to that used in the Pearson correlation.
All analyses were carried out in the statistical
Y Y X X Y X V) Cov(U, = ρ 22 Τ 11 Τ 12 Τ V) (U, Y X 12 T
XXT
11Y Y 22 T
)
r
).(1
r
(1
.r
r
r
=
r
YZ 2 XiZ 2 YZ XiZ Xi Z) (XiY,
software “GENES” (CRUZ, 2006).
RESULTS AND DISCUSSION
For clones IPA Sertânia (IPA), Miúda (MIU) and Orelha de Elefante Mexicana (OEM), we found that, in the Pearson’s correlation between growth characteristics of cladodes and plants, nearly all the characteristics of the cladodes contributed to the formation and architecture of the vegetative canopy (Table 1).
For the IPA clone, the characteristics that represented the plant were the width (PW) and the numbers of cladodes of 1st (NC1) and 3rd (NC3) orders, which correlated with base cladodes (CB) and 1st, 2nd,and 3rd cladodes (CC1, CC2, CC3, EC1, PC1, ACB), and provided coefficients classified as moderate to very strong (Table 1).
In the MIU, the representative characteristics of plant growth were PW, NC1, NC3, NC4 and cladode area index (CAI), which had a moderate to very strong correlation with the base cladodes and those of the 2nd, 3rd and 4th orders (ECB, EC3, PC2, PC3, AC4).
For OEM, the representative plant characteristics were height (PH), NC1, NC3, and CAI, which correlated with characteristics of base cladodes and those of the 1st and 3rd order (CC1, ECB, EC1, EC3, PC1, ACB), providing coefficients that were classified as moderate to very strong.
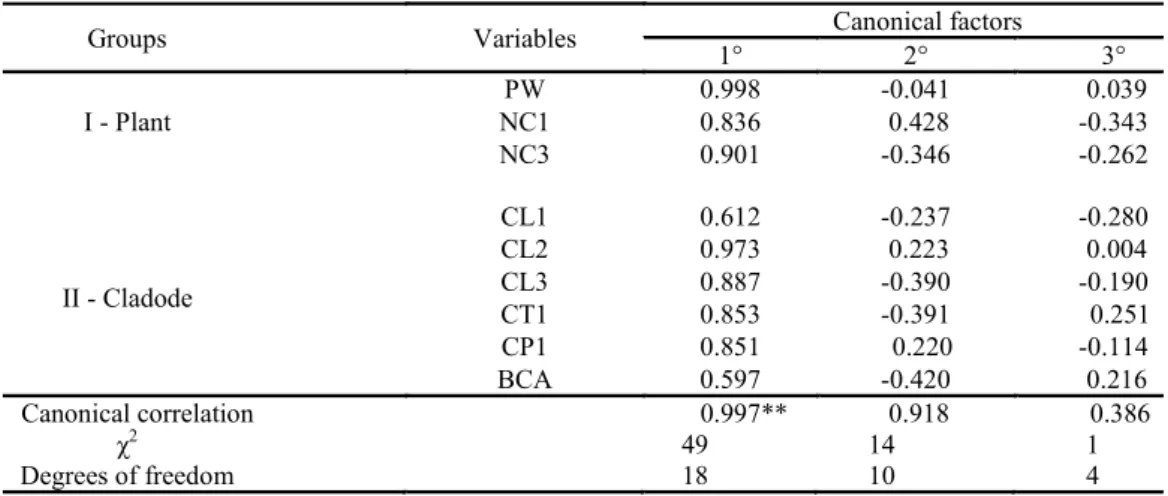
The canonical correlation analysis allowed us to identify the dependence between the group of structural characteristics of the cladodes and the group of the structural characteristics of the plants. For the IPA clone (Table 2), the first canonical axis (0.997**) showed that the plants with the largest widths (PW) and the highest number of 1st (NC1) and 3rd (NC3) order cladodes were those with higher 1st, 2nd and 3rd order cladodes, in addition to the largest basal cladodes.
Table 1. Pearson correlation matrices among the variables of the response group “Plant” (structural characteristics of the plants) with the “Cladode” explanatory group (structural characteristics of the cladodes) of forage cactus clones (IPA Sertânia - IPU, Miúda - MIU and Orelha de Elefante Mexicano - OEM), under irrigated conditions, in a semi-arid
environment.
IPA
CL1 CL2 CL3 CT1 CP1 BCA
PW 0.613* 0.96** 0.894** 0.867** 0.837** 0.613*
NC1 0.454 0.898** 0.611* 0.524 0.811** 0.304
NC3 0.653* 0.803** 0.939** 0.864** 0.706** 0.647*
MIU
BCA CT3 CP2 CP3 CA4
PW 0.507 0.765** 0.617* 0.703** 0.592*
NC1 0.201 0.566* 0.879** 0.656* 0.273
NC3 0.679* 0.942** 0.817** 0.975** 0.752**
NC4 0.775** 0.924** 0.654* 0.884** 0.813**
CAI 0.774** 0.964** 0.829** 0.913** 0.878**
OEM
CLBCA1 BCT CT1 CT3 CP1 BCA
PH 0.889** 0.639* 0.744** 0.7** 0.724** 0.519
NC1 -0.529 -0.245 -0.285 -0.868** -0.437 -0.066
NC3 0.635* 0.617* 0.775** 0.289 0.515 0.244
IAC 0.953** 0.844** 0.913** 0.608* 0.847** 0.595*
1
Plant Group: PH – plant height, PW – plant width, CAI - cladode area index, NC1 first order cladode
number, NC2 – second order cladode number, NC3 – third order cladode number, NC4 – fourth order cladode number.
Cladode number: BCL - basal cladode length, first order cladode length, CL1 – first order cladode length,
CL2 – second order cladode length, CL3 – third order cladode length, CW1 - first order cladode width,
BCW – basal cladode width, CT1 – first order cladode thickness, CT2 – second order cladode thickness, CT3 – third order cladode thickness, BCP – base cladode perimeter, CP1 – first order cladode perimeter,
CP2 – second order cladode perimeter, CP3 – third order cladode perimeter, BCA – basal cladode area, CA4 – fourth order cladode area.
**, *Significant at 1 and 5%, respectively, by t-test.
Table 2. Canonical correlations and canonical pairs between the “Plant” group (structural characteristics of the plants) and
the “Cladode” group (structural characteristics of cladodes) of the IPA Sertânia - IPA clone under irrigated conditions in a
semi-arid environment.
Where: Plant group: PW – plant width, NC1 – first order cladode number, NC3 – third order cladode
number; Cladode Group: CL1 – first order cladode length, CL2 – second order cladode length, CL3 – third order cladode length, CT1 – first order cladode thickness, CP1 – first order cladode
perimeter and BCA – base cladode area. **Significant at 1% by the Chi-square test.
For the OEM clone (Table 4), only the first canonical axis was significant (0.999 **). In this axis, plants with higher CAI, higher heights (PH), and lower NC1 were those with the greatest length, perimeter, and thickness of base cladodes, as well as those of 1st and 3rd orders.
It was observed that the length of the third-order cladodes was the characteristic that most contributed to the increase in the number of cladodes of the same order, either by direct or indirect effect (via CC1, CC2, EC1, PC1, ACB).
Groups Variables Canonical factors
1° 2° 3°
I - Plant
PW 0.998 -0.041 0.039
NC1 0.836 0.428 -0.343
NC3 0.901 -0.346 -0.262
II - Cladode
CL1 0.612 -0.237 -0.280
CL2 0.973 0.223 0.004
CL3 0.887 -0.390 -0.190
CT1 0.853 -0.391 0.251
CP1 0.851 0.220 -0.114
BCA 0.597 -0.420 0.216
Canonical correlation 0.997** 0.918 0.386
χ2
49 14 1
Rev. Caatinga
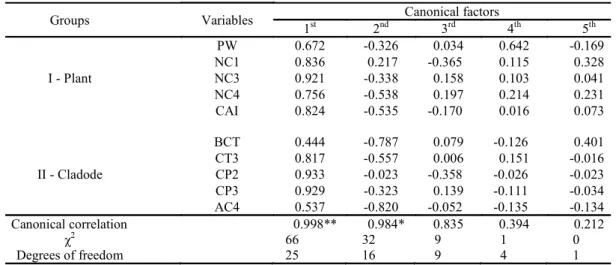
Table 3. Canonical correlations and canonical pairs between the “Plant” group (structural characteristics of plants) and the
“Cladode” group (structural characteristics of cladodes), of Miúda - MIU clone, under irrigated conditions, in a semi-arid
environment.
Groups Variables Canonical factors
1st 2nd 3rd 4th 5th
I - Plant
PW 0.672 -0.326 0.034 0.642 -0.169
NC1 0.836 0.217 -0.365 0.115 0.328
NC3 0.921 -0.338 0.158 0.103 0.041
NC4 0.756 -0.538 0.197 0.214 0.231
CAI 0.824 -0.535 -0.170 0.016 0.073
II - Cladode
BCT 0.444 -0.787 0.079 -0.126 0.401
CT3 0.817 -0.557 0.006 0.151 -0.016
CP2 0.933 -0.023 -0.358 -0.026 -0.023
CP3 0.929 -0.323 0.139 -0.111 -0.034
AC4 0.537 -0.820 -0.052 -0.135 -0.134
Canonical correlation 0.998** 0.984* 0.835 0.394 0.212
χ2
66 32 9 1 0
Degrees of freedom 25 16 9 4 1
Where: Plant group: PW – plant width, NC1 – first order cladode number, NC3 – third order cladode number, NC4 – fourth order cladode number, IAC – cladode area index; Cladode Group: ECB – basal cladode thickness, CT3 – third order cladode thickness, PC2 – second order cladode perimeter, PC3 – third order cladode perimeter, AC4 – fourth order cladode area. **, *Significant at 1 and 5%, respectively, by the Chi-square test.
Table 4. Canonical correlations and canonical pairs between the “Plant” group (structural characteristics of the plants) and
the “Cladode” group (structural characteristics of the cladodes), of Orelha de Elefante Mexicana- OEM clone, under
irrigated conditions, in a semi - arid environment.
Groups Variables Canonical factors
1st 2nd 3rd 4th
I - Plant
PH 0.885 0.186 0.329 -0.273
CN1 -0.730 0.621 -0.123 -0.257
CN3 0.465 0.696 0.038 0.546
CAI 0.869 0.475 -0.021 -0.137
II – Cladode
CT1 0.952 0.286 0.001 0.020
BCT 0.737 0.439 -0.411 -0.014
CT1 0.792 0.533 -0.088 0.236
CT3 0.883 -0.309 0.059 0.320
CP1 0.841 0.236 -0.327 -0.091
BCA 0.472 0.309 -0.180 -0.698
Canonical correlation 0.999** 0.944 0.674 0.458
χ2
62 20 5 2
Degree of freedom 24 15 8 3
Where: Plant Group: PH – plant height, NC1 – number of first order cladodes, NC3 - number of third
order cladodes, CAI – cladode area index; Cladode Group: CL1 – first order cladode length, EC1 – first order cladode thickness, EC3 – third order cladode thickness, PC1 – first order cladode perimeter, BCA – base area cladode. **Significant at 1% by the Chi-square test.
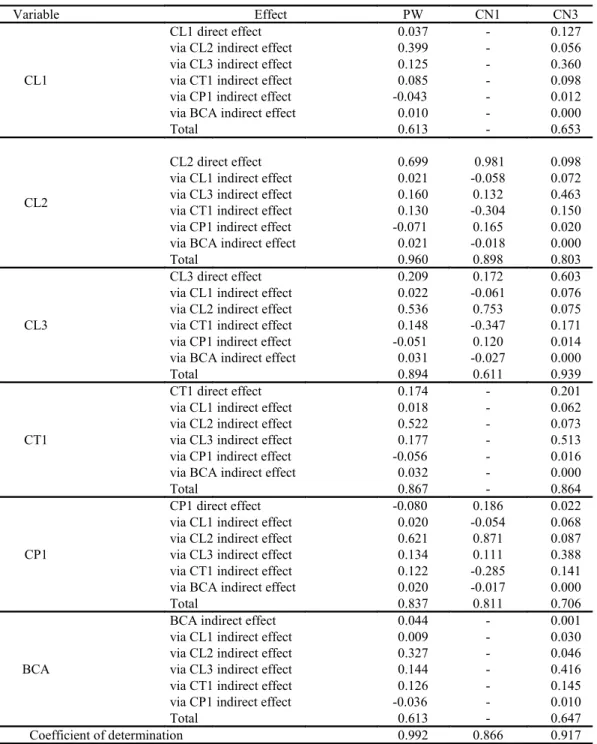
In the unfolding of the correlation coefficients between characteristics of cladodes and plant for IPA clone (Table 5), it was verified that the largest plants (PW) and with the highest number of cladodes of the first order (CN1) were those that had higher second order cladodes. These characteristics excelled the others, with direct and indirect effects (via CL1,
Table 5. Pearson’s correlation coefficient on direct and indirect effects among the variables of the response group “Plant” (structural characteristics of plants), with the variables of the explanatory group “Cladode” (structural characteristics of cladodes), IPA Sertânia clone - IPA , under irrigated conditions, in a semi-arid environment.
Variable Effect PW CN1 CN3
CL1
CL1 direct effect 0.037 - 0.127
via CL2 indirect effect 0.399 - 0.056
via CL3 indirect effect 0.125 - 0.360
via CT1 indirect effect 0.085 - 0.098
via CP1 indirect effect -0.043 - 0.012
via BCA indirect effect 0.010 - 0.000
Total 0.613 - 0.653
CL2
CL2 direct effect 0.699 0.981 0.098
via CL1 indirect effect 0.021 -0.058 0.072
via CL3 indirect effect 0.160 0.132 0.463
via CT1 indirect effect 0.130 -0.304 0.150
via CP1 indirect effect -0.071 0.165 0.020
via BCA indirect effect 0.021 -0.018 0.000
Total 0.960 0.898 0.803
CL3
CL3 direct effect 0.209 0.172 0.603
via CL1 indirect effect 0.022 -0.061 0.076
via CL2 indirect effect 0.536 0.753 0.075
via CT1 indirect effect 0.148 -0.347 0.171
via CP1 indirect effect -0.051 0.120 0.014
via BCA indirect effect 0.031 -0.027 0.000
Total 0.894 0.611 0.939
CT1
CT1 direct effect 0.174 - 0.201
via CL1 indirect effect 0.018 - 0.062
via CL2 indirect effect 0.522 - 0.073
via CL3 indirect effect 0.177 - 0.513
via CP1 indirect effect -0.056 - 0.016
via BCA indirect effect 0.032 - 0.000
Total 0.867 - 0.864
CP1
CP1 direct effect -0.080 0.186 0.022
via CL1 indirect effect 0.020 -0.054 0.068
via CL2 indirect effect 0.621 0.871 0.087
via CL3 indirect effect 0.134 0.111 0.388
via CT1 indirect effect 0.122 -0.285 0.141
via BCA indirect effect 0.020 -0.017 0.000
Total 0.837 0.811 0.706
BCA
BCA indirect effect 0.044 - 0.001
via CL1 indirect effect 0.009 - 0.030
via CL2 indirect effect 0.327 - 0.046
via CL3 indirect effect 0.144 - 0.416
via CT1 indirect effect 0.126 - 0.145
via CP1 indirect effect -0.036 - 0.010
Total 0.613 - 0.647
Coefficient of determination 0.992 0.866 0.917
Plant Group: PW – plant width, NC1 - first order cladode number, NC3 – third order cladode number;
Cladode Group: CL1 - first order cladode length, CL2 - second order cladode length, CL3 - third order
cladode length, CT1 - first order cladode thickness, CP1 - first order cladode perimeter, BCA – basal
cladode area. “-“ indicates that the variable did not present any correlation of plant group variables.
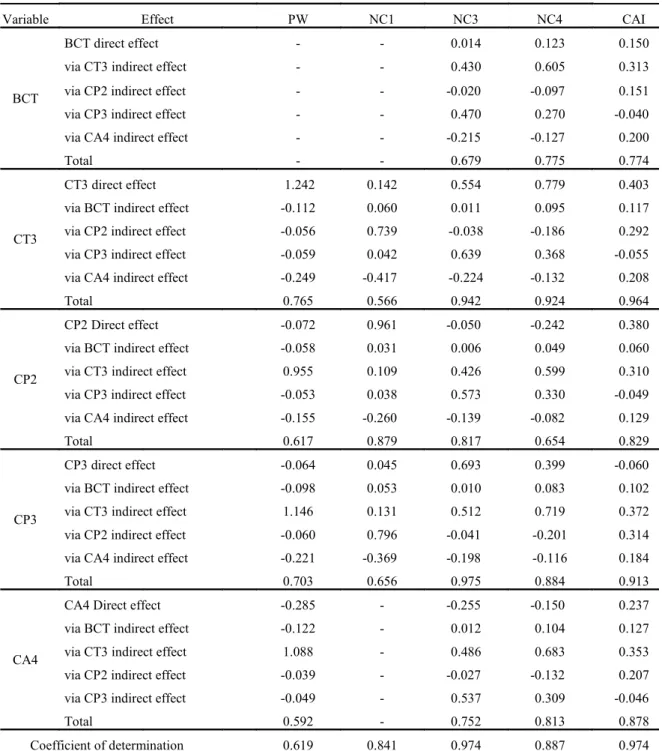
Similar to IPA, in the MIU clone (Table 6) the characteristics of the 2nd and 3rd order cladodes were those that most explained the growth and structure of the plant. The perimeter and the thickness of the 3rd order cladodes were those that most contributed to the highest PW and the highest number of cladodes of the 3rd and 4th orders, either directly or indirectly through
Rev. Caatinga
Table 6. Pearson’s correlation coefficient unfolding on direct and indirect effects among the variables of the response group
“Plant” (structural characteristics of the plants), with the variables of the “Cladode” explanatory group (structural characteristics of the cladodes), of the clone Miúda - MIU, under irrigated conditions, in a semi-arid environment.
Variable Effect PW NC1 NC3 NC4 CAI
BCT
BCT direct effect - - 0.014 0.123 0.150
via CT3 indirect effect - - 0.430 0.605 0.313
via CP2 indirect effect - - -0.020 -0.097 0.151
via CP3 indirect effect - - 0.470 0.270 -0.040
via CA4 indirect effect - - -0.215 -0.127 0.200
Total - - 0.679 0.775 0.774
CT3
CT3 direct effect 1.242 0.142 0.554 0.779 0.403
via BCT indirect effect -0.112 0.060 0.011 0.095 0.117
via CP2 indirect effect -0.056 0.739 -0.038 -0.186 0.292
via CP3 indirect effect -0.059 0.042 0.639 0.368 -0.055
via CA4 indirect effect -0.249 -0.417 -0.224 -0.132 0.208
Total 0.765 0.566 0.942 0.924 0.964
CP2
CP2 Direct effect -0.072 0.961 -0.050 -0.242 0.380
via BCT indirect effect -0.058 0.031 0.006 0.049 0.060
via CT3 indirect effect 0.955 0.109 0.426 0.599 0.310
via CP3 indirect effect -0.053 0.038 0.573 0.330 -0.049
via CA4 indirect effect -0.155 -0.260 -0.139 -0.082 0.129
Total 0.617 0.879 0.817 0.654 0.829
CP3
CP3 direct effect -0.064 0.045 0.693 0.399 -0.060
via BCT indirect effect -0.098 0.053 0.010 0.083 0.102
via CT3 indirect effect 1.146 0.131 0.512 0.719 0.372
via CP2 indirect effect -0.060 0.796 -0.041 -0.201 0.314
via CA4 indirect effect -0.221 -0.369 -0.198 -0.116 0.184
Total 0.703 0.656 0.975 0.884 0.913
CA4
CA4 Direct effect -0.285 - -0.255 -0.150 0.237
via BCT indirect effect -0.122 - 0.012 0.104 0.127
via CT3 indirect effect 1.088 - 0.486 0.683 0.353
via CP2 indirect effect -0.039 - -0.027 -0.132 0.207
via CP3 indirect effect -0.049 - 0.537 0.309 -0.046
Total 0.592 - 0.752 0.813 0.878
Coefficient of determination 0.619 0.841 0.974 0.887 0.974
Where: Plant group: PH – plant height, PT – plant thickness, NC1 - first order cladode number, NC3 – third order
cladode number, NC4 – fourth order cladode number, CAI – cladode area index; Cladode group: BCT – basal cladode thickness, CT3 - third order cladode thickness, CP2 – second order cladode perimeter, CP3 – third order cladode
perimeter, CA4 – fourth order cladode area “-“ indicates that the variable did not present any correlation with one of the
variables of the plant group.
The morphogenesis of the cladodes affected canopy formation of the plants, and for the MIU and IPA clones of Nopalea genus, the growth of the 2nd and 3rd order cladodes subsidized plant growth (canopy width, increase of CAI and appearance of
partially or completely shaded.
According to Nobel (2001), young cladodes display greater stimulus for photosynthesis than those of lower orders, contributing more to plant growth, as well as to the appearance of new cladodes. Acevedo, Badilla, and Nobel (1983)
reported that this occurs because there are differences in the pattern of solar radiation interception by the distinct cladodes over the day, as well as by their side of exposure in relation to the apparent movement of the sun.
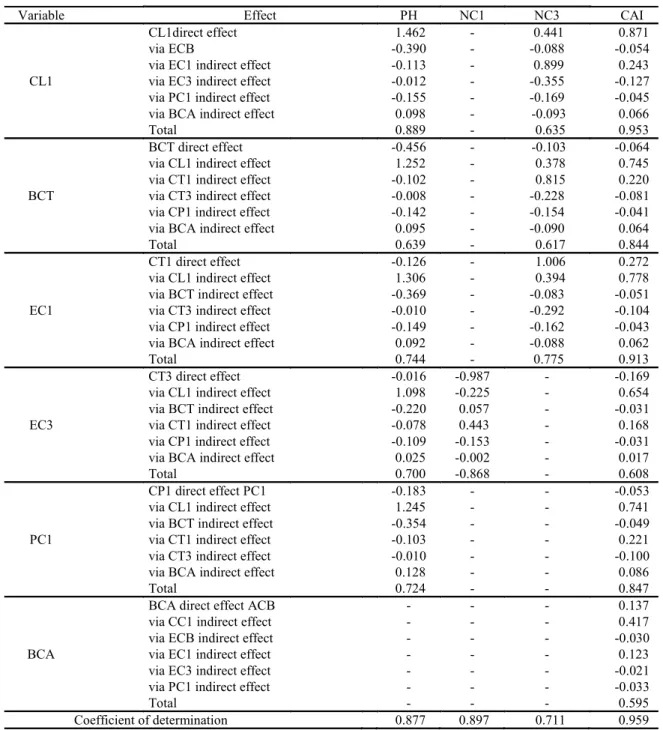
Table 7. Pearson’s correlation coefficient unfolding of direct and indirect effects among the variables of the response group
“Plant” (structural characteristics of plants), with the variables of the explanatory group “Cladode” (structural characteristics of cladodes), clone Orelha de Elefante Mexicana – OEM under irrigated conditions, in a semi-arid
environment.
Variable Effect PH NC1 NC3 CAI
CL1
CL1direct effect 1.462 - 0.441 0.871
via ECB -0.390 - -0.088 -0.054
via EC1 indirect effect -0.113 - 0.899 0.243
via EC3 indirect effect -0.012 - -0.355 -0.127
via PC1 indirect effect -0.155 - -0.169 -0.045
via BCA indirect effect 0.098 - -0.093 0.066
Total 0.889 - 0.635 0.953
BCT
BCT direct effect -0.456 - -0.103 -0.064
via CL1 indirect effect 1.252 - 0.378 0.745
via CT1 indirect effect -0.102 - 0.815 0.220
via CT3 indirect effect -0.008 - -0.228 -0.081
via CP1 indirect effect -0.142 - -0.154 -0.041
via BCA indirect effect 0.095 - -0.090 0.064
Total 0.639 - 0.617 0.844
EC1
CT1 direct effect -0.126 - 1.006 0.272
via CL1 indirect effect 1.306 - 0.394 0.778
via BCT indirect effect -0.369 - -0.083 -0.051
via CT3 indirect effect -0.010 - -0.292 -0.104
via CP1 indirect effect -0.149 - -0.162 -0.043
via BCA indirect effect 0.092 - -0.088 0.062
Total 0.744 - 0.775 0.913
EC3
CT3 direct effect -0.016 -0.987 - -0.169
via CL1 indirect effect 1.098 -0.225 - 0.654
via BCT indirect effect -0.220 0.057 - -0.031
via CT1 indirect effect -0.078 0.443 - 0.168
via CP1 indirect effect -0.109 -0.153 - -0.031
via BCA indirect effect 0.025 -0.002 - 0.017
Total 0.700 -0.868 - 0.608
PC1
CP1 direct effect PC1 -0.183 - - -0.053
via CL1 indirect effect 1.245 - - 0.741
via BCT indirect effect -0.354 - - -0.049
via CT1 indirect effect -0.103 - - 0.221
via CT3 indirect effect -0.010 - - -0.100
via BCA indirect effect 0.128 - - 0.086
Total 0.724 - - 0.847
BCA
BCA direct effect ACB - - - 0.137
via CC1 indirect effect - - - 0.417
via ECB indirect effect - - - -0.030
via EC1 indirect effect - - - 0.123
via EC3 indirect effect - - - -0.021
via PC1 indirect effect - - - -0.033
Total - - - 0.595
Coefficient of determination 0.877 0.897 0.711 0.959
Where: Plant Group: PH – plant height, NC1 - first order cladode number, NC3 – third order cladode number,
IAC – cladode area index; Cladode group: CC1 – first order cladode number, ECB – basal cladode thickness, EC1 – first order cladode thickness, EC3 - third order cladode thickness, PC1 – first order cladode perimeter,
ACB – basal area cladode. “- “indicates that the variable did not present any correlation with one of the variables of the
Rev. Caatinga
Silva et al. (2015), in a study with clones IPA and Miúda, with data obtained at 754 days after cut, showed that 2nd and 3rd order cladodes were the largest for these clones. Cunha et al. (2012) reported that there is a correlation between the rate of appearance of new cladodes and the number of cladodes present in the plant because each unit that emerges represents an additional potential for the appearance of new cladodes. These new structural units will perform more photosynthesis and will produce more photoassimilates, which will stimulate plant growth.
Using four years and eight months old MIU clones, Pinheiro et al. (2014) studied the contribution of the growth characteristics of cladodes and plants to the cladode area index, observing the existence of a significant correlation with the height × width product and the characteristics of 1st, 2nd, 3rd and 4th order cladodes. However, the authors pointed out that the characteristics of the fourth-order cladodes were the ones that contributed the most to the IAC clone. The other correlations were of low magnitude.
For the OEM clone (Table 7), higher lengths and thicknesses of the 1st order cladodes (CL1 and CT1) contributed to the occurrence of larger plants, with a higher number of 3rd order cladodes and higher CAI values, which were verified by means of direct or indirect effects (via BCT, CT3, CP1, BCA). In turn, the lower growth of the 3rd order cladodes (CT3) stimulated the development of new 1st order cladodes.
The major contribution of the first order cladodes to the OEM clone is because these are more numerous than those of the other orders. Clones of the genus Opuntia exhibit fewer cladodes when compared to clones of the genus Nopalea, but their cladodes are larger (CAVALCANTE et al., 2014) and play an important role in the growth and storage of water and plant mass.
Silva et al. (2015) report that first order cladodes are the largest in the OEM clone, as the second-order cladodes. The authors highlight that, similarly to the IPA clone; the OEM clone has larger perimeters of basal and first order cladodes when compared to the Miúda clone.
When evaluating the contribution of the morphological characteristics of plants and cladodes to the increase of the cladode area index of the Orelha de Elefante Mexicana clone, Pinheiro et al. (2014) found that the morphological characteristics explained 63.69% of the variation of the cladode area index. The variable that had the greatest weight in this percentage was the total number of cladodes of the plants.
Silva et al. (2010) emphasize that the study of morphological characteristics of clones is important since they will determine the growth habit of the latter, which can be erect or half-open. This habit is directly related to the interception of solar radiation by plants, determined by the architecture of its
canopy.
CONCLUSIONS
The relationships between the characteristics of the cladodes and the forage cactus plant were more associated with genus peculiarities than with the different clones.
The growth of the 2nd and 3rd order cladodes was the characteristic that most contributed to the canopy formation of clones of plants of the genus
Nopalea (IPA and Miúda), whereas for Orelha de Elefante Mexicana of the genus Opuntia, it was the first and third order cladodes that most contributed.
ACKNOWLEDGEMENTS
To FACEPE for the financial support (APQ-0215-5.01/10) and to CAPES for scholarship granting.
REFERENCES
ACEVEDO, E.; BADILLA, I.; NOBEL, P. S. Water relations, diurnal acidity changes, and productivity of a cultivated cactus, Opuntia ficus-indica. Plant
Physiology, Amsterdam, v. 72, n. 3, p. 775-780, 1983.
BRUM, B. et al. Correlações canônicas entre variáveis de semente, plântula, planta e produção de grãos em mamoneira. Ciência Rural, Santa Maria, v. 41, n. 3, p. 404-411, 2011.
CAVALCANTE, L. A. D. et al. Respostas de genótipos de palma forrageira a diferentes densidades de cultivo. Pesquisa Agropecuária Tropical, Goiânia, v. 44, n. 4, p. 424-433, 2014. CRUZ, C. D. Programa Genes: biometria. 1. ed. Viçosa, MG: Editora UFV, 2006. 382 p.
CUNHA, D. N. F. V. et al. Morfometria e acúmulo de biomassa em palma forrageira sob doses de nitrogênio. Revista Brasileira de Saúde e Produção Animal, Salvador, v. 13, n. 4, p. 1156 -1165, 2012.
FERREIRA, D. F. Estatística Multivariada. 2. ed. Lavras, MG: Editora UFLA, 2011. 675 p.
GIBSON, et al. Exploiting leaf starch synthesis as a transient sink to elevate photosynthesis, plant productivity and yields. Plant science, Amsterdam, v. 181, n. 3, p. 275-281, 2011.
NEDER, D. G. et al. Correlations and path analysis of morphological and yield traits of cactus pear accessions. Crop Breeding and Applied Biotechnology, Amsterdam, v. 13, n. 3, p. 203-207, 2013.
NOBEL, P. S. Ecophysiology of Opuntia ficus
-indica. In: MONDRAGÓN-JACOBO, C.;
PÉREZ-GONZÁLEZ, S. (Eds.). Cactus (Opuntia spp.) as forage. Rome: Food and Agriculture Organization of the United Nations, 2001. p. 13-20. (FAO Plant production and protection paper, 169).
PEÑA-VALDIVIA, C. B. et al. Morphological characterization of Opuntia spp.: a multivariate analysis. Journal of the Professional Association for Cactus Development, Chapingo, v. 10, n. 1, p. 1 -21, 2008.
PINHEIRO, K. M. et al. Correlações do índice de área do cladódio com características morfogênicas e produtivas da palma forrageira. Pesquisa Agropecuária Brasileira, Brasília, v. 49, n. 12, p. 939-947, 2014.
QUEIROZ, M. G. et al. Características morfofisiológicas e produtividade da palma forrageira sob diferentes lâminas de irrigação. Revista Brasileira de Engenharia Agrícola e Ambiental, Campina Grande, v. 19, n. 10, p. 931 -938, 2015.
SILVA, C. C. F.; SANTOS, L. C. Palma Forrageira (Opuntia fícus-indica Mill) como alternativa na alimentação de ruminantes. Revista Electrónica de Veterinária, Málaga, v. 7, n. 10, p. 1-13, 2006. SILVA, N. G. M. et al. Relação entre características morfológicas e produtivas de clones de palma-forrageira. Revista Brasileira de Zootecnia, Viçosa, v. 39, n. 11, p. 2389-2397, 2010.
SILVA, T. G. F. et al. Indicadores de eficiência do uso da água e de nutrientes de clones de palma forrageira em condições de sequeiro no Semiárido brasileiro. Bragantia, Campinas, v. 73, n. 2, p. 184 -191, 2014a.
SILVA, T. G. F. et al. Área do cladódio de clones de palma forrageira: modelagem, análise e aplicabilidade. Revista Brasileira de Ciências Agrárias, Recife, v. 9, n. 4, p. 633-641, 2014b. SILVA, T. G. F. et al. Crescimento e produtividade
de clones de palma forrageira no semiárido e relações com variáveis meteorológicas. Revista Caatinga, Mossoró, v. 28, n. 2, p. 10-18, 2015. THOMAZ, G. L. et al. Produção do girassol e teor de óleo nos aquênios em função da temperatura do ar, precipitação pluvial e radiação solar. Ciência Rural, Santa Maria, v. 42, n. 8, p. 1380-1385, 2012.