www.ccarevista.ufc.br ISSN 1806-6690
Productive and Reproductive Performance of Heifers Fed Different
Levels of Urea in the Diet
1Desempenho Produtivo e Reprodutivo de Novilhas Alimentadas com Diferentes
Níveis de Uréia na Dieta
Alessandra Silva2*, José Neuman Miranda Neiva3*, Vera Lucia Araujo3, Alencariano Jose Silva Falcão3 e Álan
Maia Borges4
Abstract - The objective of the present study was to evaluate the nutrient intake, blood parameters, follicular diameter and performance of pre-puberty crossbred heifers fed isoproteic diets (14.1%CP) containing 0.0; 0.44; 0.88 and 1.32% urea on the total dry matter (DM) of the diet, with a 77:23 roughage:concentrate ratio. Twenty-four 18- month old heifers (Holstein x Zebu), 277.9 kg mean live weight (LW) were used, distributed in four treatments and six replications in a randomized complete design. The following were evaluated: dry matter intake (DM), crude protein (CP), neutral detergent fiber (NDF), acid detergent fiber (ADF), ether extract (EE), hemicellulose (HEM), plasmatic ureic nitrogen (PUN), plasmatic glucose, plasmatic total cholesterol, follicular diameter and daily weight gain (DWG). No influence of the urea levels in the diet was observed on NDF and HEM intake. A maximum intake was obtained of DM (8.75 kg day-1), CP (0.88 kg day-1), ADF (2.5 kg day-1) and EE (0.17 kg day-1) respectively for the levels 0.7, 0.8, 0.7 and 0.7% urea in total DM. The 0.6%; 0.77% and 0.6% urea levels in diet were the critical points for obtaining maximum response for the PUN (10.96 mg dL-1) and plasmatic glucose (84.97 mg dL-1) concentrations and, for follicular diameter (11.08 mm) on the 40th; 24th and 31st day, respectively. The plasmatic total cholesterol concentration and DWG were not influenced by the urea added to the diet, with averages of 119.39 mg dL-1 and 1.66 kg day-1, respectively. It was concluded that urea can be added up to 1.32% on the total DM of the diet for pre-puberty crossbred heifers.
Key words - Cholesterol. Feedlot. Plasmatic ureic nitrogen. Weight gain.
Resumo - Com o presente trabalho objetivou-se avaliar o consumo de nutrientes, parâmetros sangüíneos, diâmetro folicular e desempenho de novilhas mestiças pré-púberes alimentadas com dietas isoprotéicas (14,1%PB) contendo 0,0; 0,44; 0,88 e 1,32% de uréia na matéria seca (MS) total, com relação volumoso:concentrado 77:23. Utilizaram-se vinte e quatro novilhas (Holandês x Zebu) com média de 277,9 kg de peso vivo (PV) e 18 meses de idade, distribuídas em quatro tratamentos e seis repetições em delineamento inteiramente casualizado. Foram avaliados consumos de matéria seca (MS), proteína bruta (PB), fibra em detergente neutro (FDN), fibra em detergente ácido (FDA), extrato etéreo (EE), hemicelulose (HEM), nitrogênio uréico plasmático (NUP), glicose plasmática, colesterol plasmático total, máximo diâmetro folicular e ganho de peso diário (GPD). Não foi observada influencia dos níveis de uréia na dieta sobre os consumos de FDN e HEM. Obteve-se o máximo consumo de MS (8,75 kg dia-1), PB (0,88 kg dia-1), FDA (2,5 kg dia-1) e EE (0,17 kg dia-1) respectivamente para os níveis 0,7; 0,8; 0,7 e 0,7% de uréia na MS total da dieta. Os níveis 0,6%; 0,77% e 0,6% de uréia na dieta foram os pontos críticos para obtenção de resposta máxima para as concentrações de NUP (10,96 mg dL-1) e glicose plasmática (84,97 mg dL-1) e, para o diâmetro folicular (11,08 mm) nos respectivos dias 40º; 24º e 31º. A concentração do colesterol plasmático total e o GPD não foram influenciados pela adição de uréia, com médias de 119,39 mg dL-1 e 1,66 kg dia-1, respectivamente. Conclui-se que a uréia pode ser adicionada até 1,32% na MS total da dieta para novilhas mestiças pré-púberes confinadas.
Palavras-chave - Colesterol. Confinamento. Ganho de peso. Nitrogênio ureico plasmático.
* Autor para correspondência
1Recebido para publicação em 13/03/2009; aprovado em 27/09/2010
Part of the dissertation of first author, Postgraduate Program in Tropical Animal Science of the UFT
2Programa de Pós-Graduação em Morfofisilogia Animal da FCAV, Universidade Estadual Paulista, [email protected]
3Escola de Medicina Veterinária e Zootecnia, Universidade Federal do Tocantins, [email protected], [email protected],
Introduction
Substituting true protein sources, such as soybean meal, with urea in feedlot steer diet has shown good results, giving food intake and weight gain similar to those obtained with true protein and in other cases it has generated efficient food conversion because it reduced food intake without affecting weight gain (MAGALHÃES et al., 2006; RENNÓ et al., 2005).
However, its use with females has presented contrary results. There is evidence of low fertility rates when high levels of rumen degradable protein are offered because it raises the circulating ammonia and urea concentrations resulting in an energy deficit (GARCIA-BOJALIL et al., 1998b). Both ammonia conversion to urea in the liver from the urea cycle and urea excretion by the kidneys, spend a lot of energy.
In a situation of energy deficit, the blood concentrations of glucose, insulin growth factor similar to insulin type 1 (IGF-I) decrease and reach levels incapable of stimulating production the gonadotropin-releasing hormone (GnRH) and luteinizing hormone (LH), leading to ovarian acyclicity that damages fertility (BOLAND et al., 2001; DISKIN et al., 2003).
The objective of the present study was to assess the effect of different urea levels in the diet on nutrient intake, blood parameters, ovarian activity and daily weight gain in pre-puberty crossbred heifers in a feedlot.
Material and methods
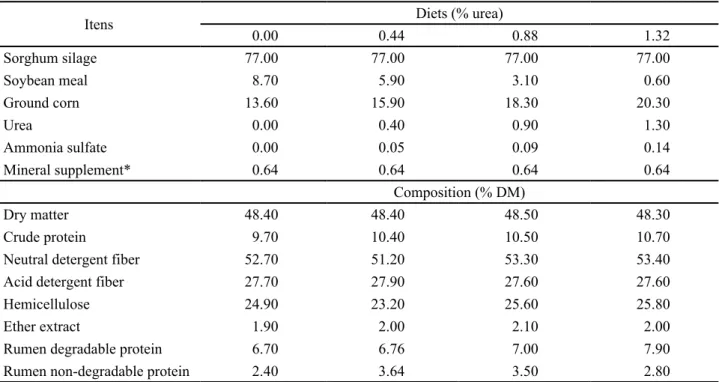
The experiment was carried out in the College of Veterinary Medicine and Animal Science at the Federal University of Tocantins, Araguaína Campus, TO, Brazil, from July to September 2007. Four diets were assessed containing 0; 0.44; 0.88 and 1.32 urea included in the total dry matter (DM) (TAB. 1). The diets were formulated according to the NCR (2001) requirements to be isoproteic (14.1% CP) with expected DM intake of 7.1 kg day-1 to allow a daily weight gain
of 0.75 kg animal-1 day-1. Sorghum silage was used with a
77:23 roughage:concentrate ratio based on the total DM. Twenty-four 18-month old heifers (Holstein x Zebu) were used, 277.9 kg mean live weight, distributed in a randomized complete design for the four treatments with six replications and each replication consisted of one animal. The experimental period was 57 days, with seven days for adaptation and 50 days for data collection.
At the start of the adaptation period, the animals were wormed and housed individually in stalls with
individual troughs and one drinking bowl for two animals. The diets were supplied at 9 am and 5 pm with orts between 5 and 10% of the daily total offered. The food orts from the previous day were collected and weighed daily before the first feeding and samples of the orts of the foods offered were collected weekly and then grouped in two week periods.
The contents were determined in the food samples (offered and orts) of the dry matter (DM), crude protein (CP) and ether extract (EE) as described by Silva and Queiroz (2002). The analyses of neutral detergent fiber (NDF), acid detergent fiber (ADF) and hemicelluloses (HEM) were analyzed according to methodology by Van Soest et al. (1991). The chemical-bromatological analyses of these samples were carried out in the Animal Nutrition Laboratory at the UFMG Veterinary School, in Belo Horizonte, MG.
At the end of the adaptation period, the animals were weighed (initial weight), then every 14 days to follow the weight gain and at the end of the 50 days (final weight). The difference in final weight compared to the initial weight divided by the number of days in the feedlot was used to determine the daily weight gain.
The intakes of DM, CP, NDF, ADF, HEM and EE were assessed and expressed in kilogram per day (kg day-1)
in grams per unit of metabolic size (g kg-1 LW0.75), percentage
of live weight (%LW) and the daily weight gain (DWG). Blood was collected and the ovarian activity assessed every four days in the morning, before supplying the diet. The blood samples were removed by puncturing the jugular vein, using a glass tube with anti-coagulant to measure glucose and blood was collected in another tube without anti-coagulant to measure urea and cholesterol. The samples were then centrifuged at 1,000 x g for 10 minutes and the plasma obtained was stored at -20 °C. The blood concentrations of cholesterol, glucose and urea were determined in the EXAME Laboratory (Araguaína, TO) using enzymatic (cholesterol), oxidase/peroxidase (glucose) or urease (urea) methodologies. The plasmatic ureic nitrogen (PUN) was determined by multiplying the plasma urea by 0.466 that corresponded to 46.6% nitrogen in the urea molecule.
The ovarian activity was monitored by trans-rectum ultrasound, using a Honda HS 1500V apparatus coupled to a frequency linear transductor adjustable to 5.0; 7.5 or 10.0 MHz. The diameters were measured in millimeters (mm) of the largest follicle present in each ovary.
performed for all the variables assessed, with analysis of variance at the level of 5% significance.
The repeated measures of the blood parameters (PUN, glucose and cholesterol) and the follicular diameter taken over time from the same heifer were analyzed by the SAS® MIXED procedure (SAS, 2001), following the
mixed linear model:
!ijk = µ + αi + βij + λk + (αγ)ik + εijk (1)
where yijk is a vector of the responses (PUN, glucose, cholesterol and follicular diameter) on day k, measured on the j-eth heifer in treatment i; * is the general mean; αi is the fixed effect of the treatment i, βij is the random effect of heifer j nested in treatment i; λk is the fixed effect of day k; αγik is the effect of the interaction between the treatment i and day k; and εijk is the random error.
Four covariance structures were used to model the repeated measurements (LITTELL et al., 1998). The structures that best fitted the data were chosen based on the smallest values of the Akaike and Bayesian Information Criteria. The PUN replicated data for glucose and follicular diameter were analyzed using random autoregression and covariance analysis and autoregression with adjusted means with symmetrical component, respectively.
Results and discussion
The DM intake, expressed in kg day-1 and g kg-1
LW0.75, presented quadratic responses to the increase in
the urea levels in the diet (p < 0.05) while the intake in %LW presented only a tendency to increase (p = 0.064). Maximum intakes of 8.75 kg day-1 117.6 kg LW0.75 and
2.8% LW were estimated, respectively, from the regression equations (TAB. 2), for the levels 0.7, 0.6 and 0.6% urea included in the diet.
The mean DM intakes in kg day estimated (7.6; 8.6; 8.6 and 7.7) were greater than the value proposed by the NRC (2001) of 7.1 kg heifer-1 day-1. DM intake
is the most important nutritional factor to establish the quantities of nutrients available for health and animal production (NRC, 2001).
The high DM intake (kg day-1) obtained may have
occurred because the heifers were raised exclusively on pasture and probably presented some type of nutritional restriction and presented a compensatory effect at the start of the experiment. Another fact that may also have contributed was that the NRC guidelines are based on taurine and not zebu animals to predict nutritional requirements and the foods used in the diet formulation have different nutrient levels due to the variations in temperature, moisture, luminosity and rainfall between temperate and tropical climates.
* Fospec-85. composition (in 1000 g): Na - 140 g; Ca - 151 g; P - 85 g; Mg - 10 g; S - 15 g; Fe - 600 mg; Zn - 5200 mg; Cu - 1800 mg; Co - 200 mg; Mn - 1000 mg; I - 100 mg; Se - 27 mg; F - 740 mg
Itens Diets (% urea)
0.00 0.44 0.88 1.32
Sorghum silage 77.00 77.00 77.00 77.00
Soybean meal 8.70 5.90 3.10 0.60
Ground corn 13.60 15.90 18.30 20.30
Urea 0.00 0.40 0.90 1.30
Ammonia sulfate 0.00 0.05 0.09 0.14
Mineral supplement* 0.64 0.64 0.64 0.64
Composition (% DM)
Dry matter 48.40 48.40 48.50 48.30
Crude protein 9.70 10.40 10.50 10.70
Neutral detergent fiber 52.70 51.20 53.30 53.40 Acid detergent fiber 27.70 27.90 27.60 27.60
Hemicellulose 24.90 23.20 25.60 25.80
Ether extract 1.90 2.00 2.10 2.00
Rumen degradable protein 6.70 6.76 7.00 7.90 Rumen non-degradable protein 2.40 3.64 3.50 2.80
The reduction in DM intake from 8.8 kg day-1 to
7.7 kg day-1 observed starting at the 0.7 level to 1.32%
urea in the total DM of the diet, may have occurred because of imbalance between RDP and energy in the diet, leading to a failure in synchromism between ammonia and energy in the rumen. The energy supply was probably lower than the availability of ammonia generated with the increase in urea in the diet starting at the 0.7% level. The main path for ammonia not used in the rumen is to cross the ruminal epithelium and reach the bloodstream. The possible excess of ammonia in the rumen generated by the increase in urea in the diet starting at the 0.7% level, consequently, raised the plasma ammonia concentration to a level close to that considered toxic (VISEK, 1984). According to the NRC (1996) the organism is stimulated to reduce diet intake because the ammonia concentration reaches the tissue tolerance limit and subsequent increases could lead to intoxication.
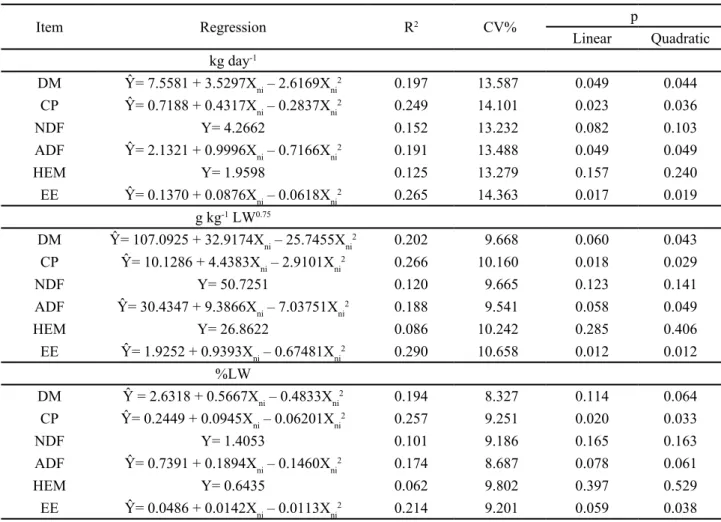
Table 2 - Regression equations, coefficients of determination (R2) and variation (CV) and probability (p) for the intakes of dry matter (DM), crude protein (CP), neutral detergent fiber (NDF), acid detergent fiber (ADF), hemicelluloses (HEM) and ether extract (EE) in function of the urea levels in the diet
Item Regression R2 CV% p
Linear Quadratic kg day-1
DM Ŷ= 7.5581 + 3.5297Xni – 2.6169Xni2 0.197 13.587 0.049 0.044
CP Ŷ= 0.7188 + 0.4317Xni – 0.2837Xni2 0.249 14.101 0.023 0.036
NDF Y= 4.2662 0.152 13.232 0.082 0.103
ADF Ŷ= 2.1321 + 0.9996Xni – 0.7166Xni2 0.191 13.488 0.049 0.049
HEM Y= 1.9598 0.125 13.279 0.157 0.240
EE Ŷ= 0.1370 + 0.0876Xni – 0.0618Xni2 0.265 14.363 0.017 0.019
g kg-1 LW0.75
DM Ŷ= 107.0925 + 32.9174Xni – 25.7455Xni2 0.202 9.668 0.060 0.043
CP Ŷ= 10.1286 + 4.4383Xni – 2.9101Xni2 0.266 10.160 0.018 0.029
NDF Y= 50.7251 0.120 9.665 0.123 0.141
ADF Ŷ= 30.4347 + 9.3866Xni – 7.03751Xni2 0.188 9.541 0.058 0.049
HEM Y= 26.8622 0.086 10.242 0.285 0.406
EE Ŷ= 1.9252 + 0.9393Xni – 0.67481Xni2 0.290 10.658 0.012 0.012
%LW
DM Ŷ = 2.6318 + 0.5667Xni – 0.4833Xni2 0.194 8.327 0.114 0.064
CP Ŷ= 0.2449 + 0.0945Xni – 0.06201Xni2 0.257 9.251 0.020 0.033
NDF Y= 1.4053 0.101 9.186 0.165 0.163
ADF Ŷ= 0.7391 + 0.1894Xni – 0.1460Xni2 0.174 8.687 0.078 0.061
HEM Y= 0.6435 0.062 9.802 0.397 0.529
EE Ŷ= 0.0486 + 0.0142Xni – 0.0113Xni2 0.214 9.201 0.059 0.038
Ŷ : estimated value; Y : mean; Xni : urea level
Rezende et al. (2008) observed quadratic performance in DM intake (6.9; 7.3; 7.7; 7.3 and 6.9 kg day-1) when the urea levels (0.0; 0.7; 1.4; 2.1
and 2.8% on the total DM) were raised in the diet by ruminal infusion, in increasing quantities (2; 4; 6 and 8) of nitrogenated supplement consisting of ammonia, ammonia sulfate and casein at a ratio of 4.5:0.5:1.0. The casein represented protein substrate and especially energetic substrate due to the presence of branched chain fatty acids. The authors verified that the maximum DM intake (7.7 kg day-1) was obtained with the 1.4% urea
Rennó et al. (2005) and Magalhães et al. (2006) supplied diets with 50:50 and 65:35 roughage:concentrate ratios, respectively, but with the same increasing urea levels (0.0, 0.65, 1.30 and 1.95% total DM in the diet) for feedlot crossbred steer and observed no effect of the urea on DM intake, with means of 8.97 kg day-1 and 6.71 kg day-1 respectively.
The fact that Magalhães et al. (2006) and Rennó et al. (2005) used urea levels up to 1.95% of the diet and did not observe reduction in DM intake, as verified in the present experiment with levels between 0.7 and 1.32% urea in the diet, was explained by the quantity of concentrate in the diets (35% and 50% x 23%), that were greater and may have made more energy available.
From the mean DM intakes estimated, a mean intake was detected of 0.0g, 37.9g, 76g and 101.1g urea heifer-1 day-1 respectively for the diets with 0.0, 0.44, 0.88
and 1.32% urea. Considering the heifers initial weight (277.9kg) and the known limit between 40 and 50 g urea 100 kg-1 LW (LOPES et al., 2000) none of the supposed
intakes reached the limit of 139g urea heifer-1 day-1.
The diets in this experiment were formulated to be isoproteic with 14.1% CP but the bromatological analysis showed that the CP levels were lower, 9.71; 10.40; 10.50 and 10.70% CP, respectively, for the diets with 0.0; 0.44; 0.88 and 1.32% urea. This reduction was explained by the protein level of the sorghum silage that made up 77% of the diet as roughage. The protein content of the silage used in the formulation was 8.1% CP, while the silage supplied in the present study contained only 5.8% CP.
The CP intakes, expressed in kg day-1, g kg-1 LW0.75
and %LW, performed quadratically with increase in urea in the diet (p < 0.05). Maximum CP intakes were estimated from the regression equations (TAB. 2) of 0.88 kg day-1,
11.82 g kg-1 LW0.75 and 0.28%LW, for the level of 0.8%
urea in the diet. As the CP contents in the diets were close and due to increase in DM intake resulting from the inclusion of urea, an increase in CP intake was expected.
The NRC (2001) recommended 0.887 kg day-1
CP intake for this pre-puberty heifer category that was reached with the inclusion of 0.8% urea in the diet. It was estimated that the differences in the CP intakes (kg day-1)
for the levels between 0.6 and 0.9% urea in the diet were small and biologically had no effect, so it was assumed that the CP intakes (kg day-1) met those recommended
by the NRC (2001) with the inclusion of 0.6 and 0.9% urea in the total DM of the diet. However, from the diet formulation a mean intake of 1 kg day-1 CP was expected
that was not supplied by the experimental diets. This fact must have been a consequence of the protein content of the silage used in the formulation with 8.1% CP, while the silage supplied in the present study contained only 5.8% CP, reducing the protein level of the diets from 14% to
9.71; 10.40; 10.50 and 10.70% CP, respectively, for the levels of 0.0, 0.44, 0.88 and 1.32% urea in the total DM.
Rennó et al. (2005) and Magalhães et al. (2006) worked with the same increasing urea levels (0.0; 0.65; 1.30 and 1.95% total DM) in isoprotein diets (12% CP) for feedlot crossbred steer and did not observe a significant effect of including urea in the diet on the CP intake, with means of 0.85 kg day-1 and 1.1 kg day-1, respectively.
The NDF intakes, expressed in kg day-1, g kg-1
LW0.75and %LW were not influenced by the urea levels
in the diet (p < 0.05) represented by the means 4.266 kg day-1, 58.725 g kg-1 PV0.75 and 1.4% PV (TAB. 2).
The mean NDF intake, estimated at 1.4% LW, was above the optimum NDF intake capacity that, according to Mertens (1992) is 1.2% LW. The excellent survival capacity of Zebus and their crossbreds probably contributed so that the NDF intake was above the optimum intake capacity, because of the better use of the roughage consumed (MENEZES; RESTLE, 2005).
The ADF intakes, expressed in kg day-1 and
g kg-1 LW0.75, presented a quadratic response to the
increase in urea in the diet (p < 0.05) while the intake in %LW presented tendency (p = 0.064) (TAB. 2). The maximum intakes were 2.5 kg day-1, 33.56 g kg-1 LW0.75
and 0.8% LW, obtained with the inclusion of 0.7% urea in the diet. The ADF intake also increased with increased DM intake.
The HEM intakes, expressed in kg day-1, g kg-1
LW0.75 and %LW were not influenced by the urea levels in
the diet (p < 0.05) with means of 1.9598 kg day-1, 26.8622
g kg-1 LW0.75 and 0.6435% LW (TAB. 2).
The EE intakes, expressed in kg day-1, g kg-1 LW0.75
and %LW, presented quadratic response to the increase in the urea level in the diet (p < 0.05). Maximum intakes were estimated from the regression equations of 0.17 kg day-1,
2.25 g kg-1 LW0.75 and 0.053%LW, for the 0.7% level of urea
included in the diet (TAB. 2). The EE intakes followed the same tendency as the DM intakes and although differences were observed in the intakes among the diets, they could be considered biologically insignificant.
The PUN concentration was influenced by the urea (U) level in the diet (p < 0.05), the collection day (D) (p < 0.05) and the U x D interaction (p < 0.05) (TAB. 3). The 0.6% urea level in the diet was the critical point for the maximum PUN concentration, PUN 10.96 mg dL-1, on the 40th day.
the 1.32% level of urea in the diet. The increasing linear performance of the PUN concentrations observed in the heifers that received the diets containing 0.0 and 0.4% urea was explained by the increase in the DM intake verified up to the 0.7% level of urea in the diet. The decreasing linear performance of the PUN concentrations observed in the heifers that received the diet containing 0.88 and 1.32% urea was justified by the reduction in DM intake observed for the levels starting at 0.7% urea in the diet.
Several factors probably contributed so that the maximum PUN concentration obtained at the critical point was 10.96 mg dL-1. First, the protein content of the diets was
lower than the minimum suggested by the NRC (2001) for this animal category (12% CP). Second, these heifers could ingest up to 139 g urea/day but the diets with 0.0, 0.44, 0.88 and 1.32% urea resulted in mean intakes of 0.0 g, 37.85 g, 76 g and 101.08 g urea/heifer/day, respectively, that were lower. The daily CP intake, according to the NRC (2001) for this animal category is 0.887 kg day-1 and was supplied
by the diets that had 0.6 to 0.9% urea included. Based on these data, it was concluded that the PUN concentrations obtained in this experiment could not reach levels equal to 16 mg dL-1 or more.
Starting on the 50th day the PUN concentrations
for all the urea levels in the diet should have stabilized close to 10.96 mg L-1 which was not observed because
the experiment finished on the 50th day. The probable
explanation for the PUN stabilization at concentrations close to 10.96 mg L-1 was that to generate this concentration,
the quantity of diet consumed should have provided balanced ammonia and energy, reaching first a stable DM intake and consequently stable PUN concentrations.
The plasma glucose concentration was influenced by the urea (U) level in the diet (p < 0.05) and by the
Ŷ: estimated value; Y: mean
Variable Regression R2 CV% p
Linear Quadratic Urea*Day
PUN ( mg dL-1) Ŷ=80.156 + 5.030U + 0.064
- 0.113DU 0.900 25.420 0.014 0.9130 0.0003
Plasma glucose (mg/dL) Ŷ=80.374 - 21.790U + 1.090D
+ 12.330U2 - 0.024D2 0.101 21.052 0.002 0.0040 0.5650
Total plasma cholesterol
(mg dL-1) Y=119.39 0.210 32.376 0.006 <0.0001 0.9120
Diameter (mm) largest follicle
Ŷ=7.287 + 2.39U + 0.2D -
2.005U2 + 0.002DU - 0.003D2 0.055 23.764 0.820 0.0020 0.9510
Table 3 - Regression equations, coefficients of determination (R2) and of variation (CV) and probability (p) of the variables plasmatic ureic nitrogen (PUN), plasma glucose, total plasma cholesterol and diameter of the largest follicle in function of the urea (U) levels in the diet and day (D) observed
collection day (D) (p < 0.05) (TAB 3). The 0.77% urea level in the diet was the critical point for the maximum plasma glucose concentration of 84.97 mg dL-1 on the
24th day.
The glucose plasma concentrations detected in the present study were greater than the values obtained by Pogliani and Birgel Júnior (2007), who examined serum and plasma samples from 413 healthy Holstein cattle and reported concentrations from 64.0 mg dL-1 to 76.1 mg dL-1
for three to 24 month-old animals.
The high plasma glucose concentrations obtained in the present study may have been related to the high DM intake presented by the heifers. It was estimated that the DM intake was superior by 0.458 kg day-1, 1.504 kg day-1, 1.538 kg day-1
and 0.557 kg day-1 to the 7.1 kg day-1 recommended by the
NRC (2001), respectively, for the diets with 0.0, 0.44, 0.88 and 1.32% urea in the total DM of the diet. This probably increased the nutrient input and contributed to raising the plasma glucose level. Another factor that may also have contributed was that the females were pre-puberty heifers and did not require glucose for milk production.
High PUN concentrations can alter the energetic balance and the plasma glucose concentration. Conversion of ammonia to urea in the liver is an energetic cost and when the quantity of ammonia in the blood is greater, the energetic expenditure and quantity of urea produced is also greater. PUN concentrations of 16 mg dL-1 reported by Staples et al. (1993), quoted
by Butler (1998), or 19 mg dL-1 (BUTLER, 1998)
The means estimated for DM intake were close in value (7.558 kg day-1 and 7.657 kg day-1, respectively)
among the 0.0 and 1.32% urea levels in the diet, and also between the levels 0.44 and 0.88% (8.604 kg day-1
and 8.637 kg day-1 respectively). This proximity in DM
intake values might have contributed to generating glucose quantities that were also close among these diets. This could justify the similar performance of the plasma glucose concentrations among the diets containing 0.0 and 1.32% urea and also among the diets with 0.44 and 0.88% urea of the total DM.
Although the mean DM intake was smaller (7.558 kg day-1)for the heifers that ingested the diet
with 0.0% urea in the total DM, the plasma glucose concentrations obtained in these heifers were the greatest. As these heifers received 0.0% urea in the diet and also presented low PUN levels, it was assumed that the energetic expense to convert ammonia into urea in the liver was less, because of the small quantity of PUN produced. This fact may justify the higher plasma glucose levels in these animals.
The total plasma cholesterol concentrations were not influenced by the urea levels in the diets (p < 0.05) and presented a mean of 119.39 mg dL-1 (TAB. 3). This was
probably because of the low protein content of the diets and also the low PUN concentrations.
The total cholesterol plasma concentrations detected in the present study were greater than the values obtained by Pogliani and Birgel Júnior (2007), who examined 413 healthy Holstein cattle and found concentrations from 86.4 mg dL-1 to 105 mg dL-1 for 12 to
24 month-old heifers. The high total plasma cholesterol levels obtained in the present study were also explained by the high DM intake that increased the nutrient input and contributed to raising lipogenesis.
Borges et al. (2001b) reported a mean total plasma cholesterol concentration of 85.9 mg dL-1 during
the normal oestrus cycle in crossbred heifers (Holstein x Zebu) in a feedlot, fed with coast grass hay, concentrate and mineral mixture ad libertum. The mean total cholesterol concentration (119.39 mg dL-1) obtained in
the present study was greater, probably because these heifers presented high DM intake that increased the nutrient input and might have raised glucose synthesis and lipogenesis.
The diameter of the largest follicle tended to be influenced by the urea (U) level in the diet (p = 0.09) and the collection day (D) (p = 0.08) (TAB. 3). The 0.6% urea level in the diet was the critical point to obtain the maximum follicular diameter of 11.08 mm on the 31st day
and there was a progressive fall with subsequent increases in the urea level in the diet.
In a comparative study with females that presented two waves of follicular growth, diameters were observed of 17.1 and 16.5 mm for dominant follicles from taurine females (GINTHER et al., 1989) and 11.3 and 12.1 mm for the dominant follicles from Zebu females (FIGUEIREDO et al., 1997). From these reports, Baruselli et al. (2007) suggested that female zebus might present smaller diameter of the dominant follicle than the taurine females. Borges et al. (2003) observed that the ovulatory follicle diameter in Nellore cows presented a mean of 11.0 ± 0.9 mm and in Gir cows the mean was 13.0 ± 1.7 mm. As the females assessed in the present study were crossbred heifers entering puberty and were yet to reach sexual maturity, it was acceptable that they presented smaller follicular diameter.
It was observed that the diameter of the greatest follicle measured in the heifers submitted to the four diets reached the size necessary to acquire ovulation capacity that is from 8 mm when they begin to develop more LH receptors (DRIANCOURT, 2000).
Ammonia and urea at high plasma concentration, according to the NRC (2001), can damage the growth and development of the ovarian follicle and its oocyte, that probably did not occur in the present experiment because the PUN concentrations were low and remained below 16 mg dL-1. Another fact that must
have contributed was the favorable energetic condition of these heifers, because they presented high plasma glucose and cholesterol concentrations.
The maximum follicular diameter performed similarly during the experiment among the heifers that received the diets containing 0.44 and 0.88% urea and also among the heifers fed the diets containing 0.0 and 1.32% urea. This fact may have been the result of the proximity of the values estimated for DM intake (kg day-1), CP intake (kg day-1) and plasma glucose levels
observed among the animals fed the diets containing 0.44 and 0.88% urea and also for those that received the diets containing 0.0 and 1.32% urea.
Dawuda et al. (2004) did not detect significant difference (p < 0.05) among the maximum follicular diameters (26.4 mm x 28.3 mm, respectively) in cows fed diet containing 17.5% CP and 11.8 MJ kgMS-1 EM
(control diet) or that received the same diet with the addition of 250 g urea cow-1 day-1. Urea did not influence
the maximum follicular diameter probably because the energetic availability of the diet and the quantity of urea included in the diet must have been compatible because there was no reduction in DM intake of 20.9 kg day-1 or
20.4 kg day-1 respectively. In the present experiment, the
lower urea intake estimated at 101.08 g day-1 possibly
because of the decrease in DM intake indicating imbalance between energy supply and ammonia in the rumen.
Garcia-Bojalil et al. (1998b) increased the supply of RDP from 11.1 to 15.7% in the DM of diets supplied to Holstein cows in the first 120 days post partum and verified reduction in the greatest follicular diameter from 24.8 mm to 18.9 mm and in the insulin concentration from 0.69 to 0.55 mg dL-1. Based on the low insulin
concentration, the authors suggested that the cows fed diet containing 15.7% RDP were less efficient in using energy for follicular growth probably because of the greater energetic expense to convert more ammonia to urea. This was contrary to that observed in the present study, because the RDP levels in the diets were lower than the values used by these authors.
The DWG was not altered in function of the levels of urea included in the diets (p<0.05), with means of 1.66 kg day-1. The estimated means for
the DWG of 1.550, 1.734, 1.753 and 1.603 kg day-1,
respectively, for the 0.0; 0.44; 0.88 and 1.32% urea levels in the diets were higher than the values proposed by the NRC (2001) of 0.75 kg day-1. This was probably
because these heifers were raised exclusively on pasture and when placed in the feedlot had access to diet superior in quantity and quality that made more nutrients available than their organisms were used to and allowed compensatory weight gain.
Pre-puberty heifers submitted to diets that take the RDP higher than 0.9 kg day-1 tended to accumulate adipose
tissue on the udder and presented hormone alterations that damaged the mammary gland development and future milk production (CAMPOS et al. 2005). Fat accumulation in the pelvic region can interfere in blood supply to the ovary and uterus, and in oocyte capture, affecting the fertility of these females (SILVEIRA; DOMINGUES, 1995).
Conclusion
Urea can be added to the 1.32% level on the total DM of the diet, without affecting daily weight gain or follicle growth in crossbred heifers.
References
BARUSELLI, P. S.; GIMENES, L. U.; SALES, J. N. S. Fisiologia reprodutiva de fêmeas taurinas e zebuínas. Revista Brasileira de Reprodução Animal, v. 31, n. 02, p. 205-211, 2007.
BOLAND, M. P.; LONERGAN, P.; O’CALLAGHAN, D. Effect of nutrition on endocrine parameters, ovarian physiology,
and oocyte and embryo development. Theriogenology, v. 55, n. 06, p. 1323-1340, 2001.
BORGES, A. M. et al. Concentrações plasmáticas de colesterol total e lipoproteínas de alta densidade em novilhas mestiças doadoras de embriões tratadas com somatotropina bovina recombinante. Arquivo Brasileiro de Medicina Veterinária e Zootecnia, v. 53, n. 05, p. 605-610, 2001b.
BORGES, A. M. et al. Desenvolvimento luteal e concentrações plasmáticas de progesterona em vacas das raças Gir e Nelore.
Revista Brasileira de Zootecnia, v. 32, n. 02, p. 276-283, 2003.
BUTLER, W. R. Effect of protein nutrition on ovarian and uterine physiology in dairy cattle. Journal of Dairy Science, v. 81, n. 09, p. 2533-2539, 1998.
CAMPOS, O. F. et al. Recria de bovinos leiteiros. Juiz de Fora: Embrapa Gado de Leite, 2005. 8 p. (Circular técnico, 84).
DAWUDA, P. M. et al. The effect of a diet containing excess quickly degradable nitrogen (QDN) on reproductive and metabolic hormonal profiles of lactating dairy cows. Animal Reproduction Science, v. 81, n. 03/04. p. 195-208, 2004. DISKIN, M. G. et al. Effects of nutrition and metabolic status on circulating hormones and ovarian follicle development in cattle. Animal Reproduction Science, v. 78, n. 03/04, p. 345-370, 2003.
DRIANCOURT, M. A. Regulation of ovarian follicular dynamics in farm animals implications for manipulation of reproduction. Theriogenology, v. 55, n. 06, p. 1211-1239, 2001. FIGUEIREDO, R. A. et al. Ovarian follicular dynamics in nelore breed (Bos indicus) cattle. Theriogenology, v. 47, n. 08, p. 1489-1505, 1997.
GARCIA-BOJALIL, C. M. et al. Protein degradability and calcium salts of long-chain fatty acids in the diets of lactating dairy cows: reproductive responses. Journal of Dairy Science, v. 81, n. 05, p. 1385-1395, 1998b.
GINTHER, O. J.; KNOPF, L.; KASTELIC, J. P. Temporal associations among ovarian events in cattle uring oestrous cycles with two and three follicular waves. Journal of Reproduction and Fertility, v. 87, p. 223-230, 1989.
LITTELL, R. C.; HENRY, P. R.; AMMERMAN, C. B. Statistical analysis of repeated meansures data using SAS procedures. Journal Animal Science, v. 76, n. 04, p. 1216-1231, 1998.
LOPES, H. O. S. et al. Recomendações técnicas para a utilização da uréia pecuária na alimentação animal. Planaltina: Embrapa cerrados, 2000. 35 p. (Circular técnico, 8)
MAGALHÃES, K. A. et al. Performance, digestibility and carcass characteristics of feedlot dairy steers fed diets with different urea levels. Arquivo Brasileiro de Medicina Veterinária e Zootecnia, v. 58, n. 05, p. 860-867, 2006.
MERTENS, D. R. Análise da fibra e sua utilização na avaliação de alimentos e formulação de rações. In: SIMPÓSIO
INTERNACIONAL DE RUMINANTES, 1992. Lavras, Anais...
Lavras: SBZ-ESAL, 1992. p. 188.
NATIONAL RESEARCH COUNCIL – NRC. Nutrient
requirements of beef cattle. 7. ed. Washington, D.C.: National Academic of Sciences, 1996.
NATIONAL RESEARCH COUNCIL – NRC. Nutrient
requeriments of dairy cattle. 7. ed. Washington, D. C.: National Academic of Sciences, 2001.
POGLIANI, F. C.; BIRGEL JÚNIOR, E. Valores de referência do lipidograma de bovinos da raça holandesa, criados no Estado de São Paulo. Brazilian Journal of Veterinary Research and Animal Science, v. 44, n. 05, p. 373-383, 2007.
RENNÓ, L. N. et al. Níveis de uréia na ração de novilhos de quatro grupos genéticos: consumo e digestibilidades totais. Revista Brasileira de Zootecnia, v. 34, n. 05, p. 1775-1785, 2005.
REZENDE, L. H. G. S. et al. Consumo e digestibilidade do feno de capim-braquiária em bovinos de corte sob suplementação com mistura contendo sulfato de amônia, caseína e uréia. Revista Brasileira de Zootecnia, v. 37, n. 04, p. 717-723, 2008.
STATISTICAL ANALYSES SYSTEM (SAS). User’s Guide
Statistics. Cary, N.C.: SAS Institute, 2001.
SILVA, D. J.; QUEIROZ, A. C. Análise de alimentos:
Métodos químicos e biológicos. 3. ed. Universidade Federal de Viçosa, 2002.
SILVEIRA, A. C.; DOMINGUES, C. A. C. Sistema de alimentação de novilhas em crescimento. In: PEIXOTO, A. M.; MOURA, J. C.; FARIA, V. P. (Ed.). Nutrição de bovinos: conceitos básicos e aplicados. Piracicaba: FEALQ, 1995. p.95-117.
STAPLES, C. R. et al. Protein intake and reproductive performance of dairy cows: a review, a suggested mechanism, and blood and milk urea measurements. In: Proc. 4th Annu. Florida Ruminant Nutr. Symp., Univ. Florida,Gainesville, p. 37-51, 1993.
VAN SOEST, P. J.; ROBERTSON, J. B.; LEWIS, B. A. Symposium: carbohydrate metodology, metabolism, and nutritional implications in dairy cattle. Journal of Dairy Science, v. 74, n. 10, p. 3583-3597, 1991.
VISEK, W. J. Ammonia: Its effects on biological systems,
metabolic hormones, and reproduction. Journal of Dairy