http://dx.doi.org/10.1590/1516-635x160237-42
Cycle
Author(s)
Nascimento GR doI
Murakami AEI
Guerra AFQMI
Ospinas-Rojas ICI
Ferreira MFZI
Fanhani JCI
I Departamento de Zootecnia, Universidade
Estadual de Maringá, Avenida Colombo 5790, Jardim Universitário, Maringá, PR 87020-900, Brazil.
Mail Adress
Corresponding author e-mail address Departamento de Zootecnia, Universidade
Estadual de Maringá, Avenida Colombo 5790, Jardim Universitário, Maringá, PR 87020-900, Brazil.
E-mail: [email protected]; [email protected]
Keywords
Cholecalciferol, 25 hydroxycholecalciferol, 1.25 dihydroxycholecalciferol.
Submitted: March/2013 Approved: April/2014
ABSTRACT
This study evaluated the effects of different sources of vitamin D and calcium levels on performance, egg quality and bone strength of hens in the second production cycle. A total of 384 Hy-Line W36 birds with 80 weeks of age were used, alloted into 3 x 4 factorial design (sources of vitamin D: cholecalciferol; 25(OH)D3 and 1.25(OH)2D3 x calcium levels: 2.85, 3.65; 4.45 and 5.25%) with four replicates and eight birds each. The performance was evaluated for three cycles of 28 days each, egg quality was evaluated in the last four days of each cycle and bone strength on the last day of the experimental period. There was no interaction (p> 0.05) between the different sources of vitamin D and calcium levels in all parameters evaluated. There was a quadratic effect (p<0.05) of calcium levels in egg production and feed conversion (kg/kg and kg/dz), with better results at levels of 4.12%, 4.09% and 4.14%, respectively. Calcium levels had no effect (p> 0.05) in the egg weight and Haugh unit, but there was a linear increase (p <0.05) in the percentage and eggshell thickness, in specific gravity and bone strength. The different sources of vitamin D influenced (p<0.05) the egg production rate, feed conversion, egg weight and Haugh unit. Thus, the results of this study suggest that the recommended calcium level for laying on second cycle is between 4.09% and 4.14% and that the metabolites cholecalciferol and 25(OH)D3 improved the performance and egg quality. Regarding bone strength was improved as the calcium levels were increased in diets.
INTRODUCTION
During the second laying cycle, after forced molting, layers restore their calcium absorption levels, with resulting eggshell quality improvement. However, this effect is independent of egg size, and therefore, eggshell quality worsens as birds age (Albano Jr et al., 2000).
During the second laying cycle, commercial layers present high egg loss due to poor eggshell quality and weak bones due to calcium mobilization. Therefore, their calcium and vitamin D requirements need to be updated to improve egg quality and the productivity of the egg industry.
Calcium is required for several metabolic functions in poultry (Nunes
et al., 2006) and to ensure good eggshell quality. Its functions are also
associated with phosphorus and vitamin D3. During eggshell synthesis, blood calcium is rapidly mobilized, thereby reducing its levels. This stimulates the secretion of the parathyroid hormone (PTH), which promotes bone resorption to reestablish calcium homeostasis (Pelícia
et al. 2009). The high rates of bone resorption during lay result in bone
Vitamin D3 can be synthesized in the skin, catalyzed by ultraviolet radiation, from 7-dihydrocholesterol present in the dermis and epidermis (Pedrosa & Castro, 2005) or can be supplied in the feed. Commercial layers are usually maintained indoors, and do not receive enough solar radiation to convert 7-dihydrocholesterol
in sufficient levels to supply their vitamin D3
requirements. This is why vitamin D3 is routinely added to layer feeds, which is essential for the maintenance of egg production, eggshell formation, and calcium homeostasis.
Cholecalciferol (D3) is the most common form of vitamin D added to feeds. After absorption by the intestinal mucosa, it is transported to the liver, where it is hydroxylated in the position 25, resulting in 25-hydroxycholecalciferol (25(OH)D3).This metabolite is directed to the kidneys and hydroxylated at carbon 1, originating the active metabolite of vitamin D, 1,25-dihydroxycholecalciferol (1,25(OH)2D3) (Leeson & Summers, 2001).
The inclusion of different vitamin D metabolites in the diet may enhance the effect of vitamin D due to their ready availability, sparing the chain of reactions required for the synthesis of the active metabolite.
Therefore, this study aimed at the evaluating the effects of different dietary vitamin D sources and calcium levels on the production performance, egg quality, and bone strength of layers in their second laying cycle.
MATERIALS AND METHODS
The experiment was carried out at the poultry sector of the experimental farm of Iguatemi, State University of Maringá, Brazil. The experiment was approved by the Committee of Ethics and Animal Welfare of that university, under protocol n. 023/2013.
In the trial, 384 80-wk-old Hy-line® W36 layers were housed in battery cages (100 x 40 x 45 cm³), at a density of 500 cm2/bird, an open-sided layer house
covered with clay tiles.
A completely randomized experimental design in a 3 x 4 factorial arrangement, consisting of three vitamin D sources (cholecalciferol;25(OH)D3 and 1,25(OH)2D3) and four dietary calcium levels (2.85, 3.65, 4.45, 5.25), with four replicates of eight birds per experimental unit, was applied.
Average maximum and minimum environmental temperatures recorded during the experimental period were 29.2 ºC and 16.6 ºC, respectively.
Feeds were based on corn and soybean meal, supplemented with vitamins and trace minerals, and formulated according to the recommendations of Rostagno et al. (2011), except for calcium levels. The different vitamin D sources were included in the diet to supply 2000 IU of vitamin D3. The vitamin supplement did not contain vitamin D. The experimental diets are shown in Table 1.
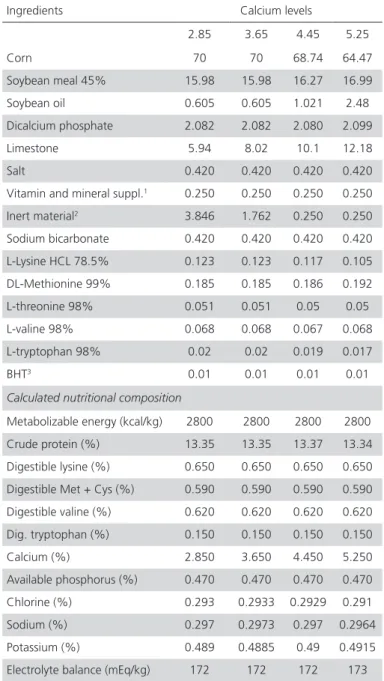
Table 1 – Ingredients and nutritional composition of the experimental diets.
Ingredients Calcium levels
2.85 3.65 4.45 5.25
Corn 70 70 68.74 64.47
Soybean meal 45% 15.98 15.98 16.27 16.99 Soybean oil 0.605 0.605 1.021 2.48 Dicalcium phosphate 2.082 2.082 2.080 2.099 Limestone 5.94 8.02 10.1 12.18 Salt 0.420 0.420 0.420 0.420 Vitamin and mineral suppl.1 0.250 0.250 0.250 0.250
Inert material2 3.846 1.762 0.250 0.250
Sodium bicarbonate 0.420 0.420 0.420 0.420 L-Lysine HCL 78.5% 0.123 0.123 0.117 0.105 DL-Methionine 99% 0.185 0.185 0.186 0.192 L-threonine 98% 0.051 0.051 0.05 0.05 L-valine 98% 0.068 0.068 0.067 0.068 L-tryptophan 98% 0.02 0.02 0.019 0.017 BHT3 0.01 0.01 0.01 0.01
Calculated nutritional composition
Metabolizable energy (kcal/kg) 2800 2800 2800 2800 Crude protein (%) 13.35 13.35 13.37 13.34 Digestible lysine (%) 0.650 0.650 0.650 0.650 Digestible Met + Cys (%) 0.590 0.590 0.590 0.590 Digestible valine (%) 0.620 0.620 0.620 0.620 Dig. tryptophan (%) 0.150 0.150 0.150 0.150 Calcium (%) 2.850 3.650 4.450 5.250 Available phosphorus (%) 0.470 0.470 0.470 0.470 Chlorine (%) 0.293 0.2933 0.2929 0.291 Sodium (%) 0.297 0.2973 0.297 0.2964 Potassium (%) 0.489 0.4885 0.49 0.4915 Electrolyte balance (mEq/kg) 172 172 172 173
1 Vitamin and mineral supplement (content/kg product): vit. A – 3600 IU; vit. E – 3200
IU; vit. K – 800 mg; vit. B1 – 500 mg; vit. B2 – 1600 mg; Vit. B6 – 500 mg; Vit. B12 - 4000 mcg; niacin – 8000 mg; calcium pantothenate – 3200 mg; Se – 100 mg; Mn – 24 g; Zn – 20 g; Cu – 4.800 mg; I – 400 mg; Fe – 20 g; Co – 80 mg.
2Vitamins D
3, 25(OH)D3 and 1.25(OH)2D3 were included at the expense of inert
mate-rial at 2000 IU at the following levels: 400mg, 5mg, and 200,000mg, respectively.
A lighting program of 17 h of light (natural + artificial) per day was adopted. Feed and water were supplied ad libitum. Birds were submitted to a 14-day adaptation period and evaluated for three periods of 28 days each. Feed intake (g/bird/day) and feed conversion ratio (kg/kg and kg/dz) were evaluated in each period by weighing feed offer in the beginning and at the end of each period. Eggs were collected daily to determine egg production.
Eggs were collected during the last four days of each period to determine average egg weight and egg specific gravity. A sample of three eggs per replicate out of the total eggs produced per cage as collected to determine albumen height, and eggshell percentage and thickness.
Egg specific gravity was determined by immersing eggs in saline solutions at different concentrations (1.070, 1.074, 1.078, 1.082, and 1.086 g/mL). Saline solutions were adjusted using an oil densitometer and regularly calibrated.
Egg internal quality was evaluate relative to Haugh units, as described by Brant & Shrader (1958), where HU = 100 log (H + 7.57 - 1.7 W0.37), where H = albumen
height (mm) and W = egg weight (g).
Eggshells with the internal membrane were washed under running water and then dried at environmental temperature for 72 hours (Maia et al., 2002; Costa et al., 2011), and dried in a digital scale to determine its weight relative to egg weight.
Eggshell thickness was determined using a digital micrometer (Mitutoyo®) with 0.001-mm precision. Measures were taken at the egg equator, where the distribution of calcium carbonate crystals is homogenous (Murakami et al., 2006).
Bone strength was evaluated in the left tibia of two hens per experimental unit, which was collected and frozen (-18º C) until analyses. Legs were thawed, the muscle tissue adhered to the bone was removed with the aid of scissors and forceps, and the tibiae were separated. Bone strength was analyzed in thawed bones at the Laboratory of Construction Materials and Soil Mechanics of the Technology Center of UEM. The mechanism consisted of a base that supported bone epiphyses and the force was applied in the central region of the bone.Values are expressed in kilograms-force (kgf).
In order to evaluate the influence of vitamin D sources on calcium metabolism, blood samples were collected every six hours for 24 hours, starting one hour after egg lay. Blood was collected by wing-vein puncture from one hen per experimental unit in each
of the five blood collections. Serum calcium level was determined using a commercial kit.
Orthogonal polynomials were calculated for the obtained data for analysis of variance and analysis of regression. Means were compared by the test of Tukey at 5% probability level using the System of Statistical and Genetic Analyses (SAEG-8.0), developed by the Federal University of Viçosa (2005).
RESULTS AND DISCUSSION
There was no interaction (p>0.05) between vitamin D sources and calcium levels for none of the evaluated performance and egg quality parameters, or bone strength (Tables 2 and 3).
Dietary calcium levels did not influence (p> 0.05) feed intake. Costa et al. (2008) tested 3.0-5.0% dietary calcium levels and did not find any effects on feed intake. On the other hand, Araújo et al. (2011) verified lower feed intake when calcium level was increased from 3.5 to 4.2% in the diet of commercial layers in the post-molting period.
Egg production and feed conversion ratio (kg/kg and kg/dz) presented quadratic responses (p < 0.05). The resulting calcium requirement estimates of 4.12, 4.09, and 4.14% for second-cycle layers are higher than that reported by Rodrigues et al. (2005), who recommended a level of 3.5% calcium in the diet of these layers.
The obtained calcium values are close to that recommended by Rostagno et al. (2011), of 3.9% calcium for commercial layers and below the recommendations of the Hy-Line W36 manual (2011), of 4.67% calcium in the diet of layers producing less than 75% eggs.
Among the tested vitamin D sources, the hens fed D3 presented higher egg production (p<0.05) compared with those fed 1,25(OH)2D3, which, however, was not different from those fed 25(OH)D3. The hens fed 25(OH)D3 presented better feed conversion ratio (kg/ kg and kg/dz; p<0.05) relative to 1,25(OH)2D3, but similar results (p>0.05) as the group fed D3.
Evaluating the effects of the inclusion of vitamin D3 or metabolite 25(OH)D3 in layer diets, Salvador
et al. (2009) obtained better feed conversion ratio
with 25(OH)D3. On the other hand, Hamilton (1980) observed that D3 promoted better egg production and feed conversion ratio (kg/kg) results relative to 25(OH) D3.
produced heavier eggs (p<0.05) compared with those fed 1,25(OH)2D3, but not with those fed D3 (p>0.05).
Eggshell percentage and thickness, and egg specific gravity linearly increased (p<0.05) with increasing dietary calcium levels. Calcium plays an essential role in eggshell formation, and therefore, the increase in its dietary level contributed to better eggshell synthesis (Costa et al., 2008).
Albano Jr. et al. (2000) verified higher eggshell percentage and egg specific gravity as dietary calcium levels increased from 2 to 6%. On the other hand, the tested vitamin D sources did not affect (p> 0.05) eggshell percentage and thickness or egg specific gravity.
Haugh units were not influenced (p>0.05) by dietary calcium levels. However, the hens fed vitamin
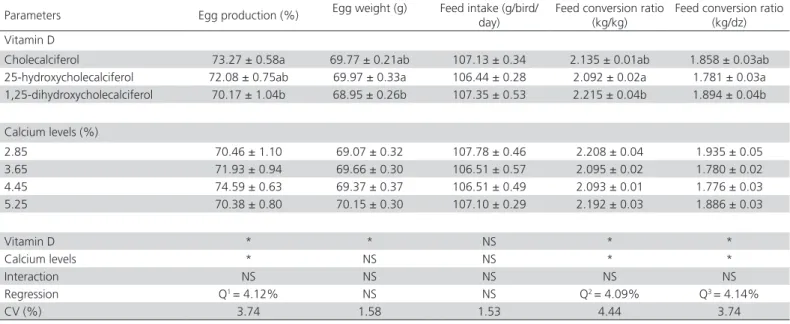
Table 2 – Performance of commercial layers in their second laying cycle fed diets with different vitamin D sources and calcium levels.
Parameters Egg production (%) Egg weight (g) Feed intake (g/bird/ day)
Feed conversion ratio (kg/kg)
Feed conversion ratio (kg/dz) Vitamin D
Cholecalciferol 73.27 ± 0.58a 69.77 ± 0.21ab 107.13 ± 0.34 2.135 ± 0.01ab 1.858 ± 0.03ab 25-hydroxycholecalciferol 72.08 ± 0.75ab 69.97 ± 0.33a 106.44 ± 0.28 2.092 ± 0.02a 1.781 ± 0.03a 1,25-dihydroxycholecalciferol 70.17 ± 1.04b 68.95 ± 0.26b 107.35 ± 0.53 2.215 ± 0.04b 1.894 ± 0.04b
Calcium levels (%)
2.85 70.46 ± 1.10 69.07 ± 0.32 107.78 ± 0.46 2.208 ± 0.04 1.935 ± 0.05 3.65 71.93 ± 0.94 69.66 ± 0.30 106.51 ± 0.57 2.095 ± 0.02 1.780 ± 0.02 4.45 74.59 ± 0.63 69.37 ± 0.37 106.51 ± 0.49 2.093 ± 0.01 1.776 ± 0.03 5.25 70.38 ± 0.80 70.15 ± 0.30 107.10 ± 0.29 2.192 ± 0.03 1.886 ± 0.03
Vitamin D * * NS * *
Calcium levels * NS NS * *
Interaction NS NS NS NS NS
Regression Q1 = 4.12% NS NS Q2 = 4.09% Q3 = 4.14%
CV (%) 3.74 1.58 1.53 4.44 3.74
a,b Means followed by different letters in the same column are different by the test of Tukey at 5% probability level. *=Significant (P<0.05). NS= not significant.
Q¹ - Ŷ = 36.06 + 18.241x -22148x² (R² = 0.72); Q² - Ŷ = 3.464 -0.677x + 0.0828x² (R² = 0.99); Q3 - Ŷ = 3.5358 -0.8574x + 0.1035x² (R² = 0.99).
Table 3 – Egg quality and bone strength of commercial layers in their second laying cycle fed diets with different vitamin D sources and calcium levels.
Parameters Eggshell % Eggshell thickness (mm)
Egg specific gravity
(g/mL) Haugh units
Bone strength (kgf/cm²) Vitamin D
Cholecalciferol 8.16±0.07 0.35±0.004 1.075 ± 0.0005 97.64 ± 0.22a 16.20 ± 0.48 25-hydroxycholecalciferol 8.08±0.07 0.36±0.003 1.075 ± 0.0005 97.27 ± 0.16ab 15.53 ± 0.41 1,25-dihydroxycholecalciferol 8.16±0.09 0.35 ± 0.004 1.076 ± 0.0006 96.96 ± 0.20b 15.65 ± 0.41
Calcium levels (%)
2.85 7.81 ± 0.07 0.34 ± 0.003 1.073 ± 0.001 97.63 ± 0.22 14.96 ± 0.41 3.65 8.08 ± 0.05 0.35 ± 0.003 1.075 ± 0.004 97.43 ± 0.22 15.55 ± 0.29 4.45 8.36 ± 0.05 0.36 ± 0.002 1.077 ± 0.003 97.20 ± 0.25 15.75 ± 0.57 5.25 8.28 ± 0.06 0.37 ± 0.004 1.078 ± 0.005 96.86 ± 0.22 16.91 ± 0.47
Vitamin D NS NS NS * NS
Calcium levels * * * NS *
Interaction NS NS NS NS NS
Regression L1 L2 L3 NS L4
CV (%) 2.64 3.16 0.12 0.76 3.74
a,b Means followed by different letters in the same column are different by the test of Tukey at 5% probability level.
*=Significant (p<0.05). NS= not significant. L1 -Ŷ = 7.2769 +0.2113x (R2= 0.79); L2 -Ŷ = 0.3044 + 0.0125x (R2= 1); L3- Ŷ = 1.0671+ 0.0021x (R2= 0.97); L4 -Ŷ = 12.73+ 0.7563x
D3 presented better HU results (p<0.05) compared with those fed 1,25(OH)2D3, but similar HU as those fed 25(OH)D3. The results obtained with 1,25(OH)2D3 may be attributed to the shorter half-life of this metabolite
(4-6 hours), compared with 25(OH)D3 (2-3 weeks)
(Castro, 2011), and therefore its utilization may have been impaired due to the lack of body reserves.
Bone strength linearly increased (p<0.05) with calcium levels. When calcium blood levels are high, the C cells of the ultimobranchial glands are stimulated to secrete calcitonin, reducing bone resorption and consequently, increasing bone strength (Whitehead, 2004; Nunes et al., 2006).
Bone strength was not affected (p>0.05) by the tested vitamin D sources, despite the absorption rate of 25(OH)D3 is higher than that of vitamin D3 (Applegate & Angel, 2005) and 1,25(OH)2D3 increased calcium absorption by the intestine (Grüdtner et al., 1997). This result may be attributed to the fact that the activity of cholecalciferol, 25(OH)D3, and 1,25(OH)2D3 depend on the biological response of birds (Aburto et al., 1998). Sahin et al. (2009) obtained better bone mineralization in laying quails when 25(OH)D3 was added to the diet.
Vitamin D sources did not influence (p>0.05) blood calcium levels (mg/dL) in none of the blood collections performed at different times after lay, as shown in Table 4.
Layers maintain balanced calcium and phosphorus blood levels for eggshell formation (Junqueira et al., 2002), independently of vitamin D source. Considering the measurement of vitamin D sources, the level of the metabolite 25(OH)D3 provides the best indication of vitamin D blood levels (Barral et al., 2007), as the 1,25(OH)2D3 level reflects calcium homeostasis.
The different metabolite types did not influence the concentration of 1,25(OH)2D3, which induces the release of the Ca2+ ion for calcium deposition in the
eggshell, thereby affecting eggshell quality (Bar et al.,
1999). This effect on calcium deposition characteristics was observed in the present study, as shown by the lack of effect of the tested vitamin D metabolites on the eggshell quality of layers in their second laying cycle.
CONCLUSIONS
Considering the egg production and feed conversion ratio (kg/kg and kg/dz) results obtained in the present study, 4.09 and 4.14% dietary calcium levels are recommended for layers in their second laying cycle, respectively. Cholecalciferol and 25-hydroxycholecalciferol improved production performance and egg quality. Bone strength and serum calcium levels were not influenced by the tested vitamin D metabolites. Bone strength increased with increasing dietary calcium levels.
REFERENCES
Aburto A, Edwards Junior HM, Britton WM. The Influence of vitamin A on the utilization and amelioration of toxicity of cholecalciferol, 25 hydroxycholecalciferol, and 1.25-dihydroxycholecalciferol in young broiler chickens. Poultry Science 1998;77(4):585–593.
Albano Jr M, Albuquerque R, Lima CG, Ghion E, Lima FR, Morais CSD. Desempenho e qualidade dos ovos de diferentes linhagens de poedeiras comerciais pós-muda forçada recebendo rações com níveis variáveis de cálcio. Brazilian Journal Veterinary Research Animal Science 2000;37(4).
Applegate TJ, Angel R. Los metabolitos de la vitamina D son prometedores para uso en dietas avícolas. In: Vademécum Avícola. Santiago: Centrovet; 2005.
Araújo JA, Silva JHV, Costa FGP, Souza JMB, Givisiez PEN, Sakomura NK. Effect of the levels of calcium and particle size of limestone on laying hens. Revista Brasileira de Zootecnia 2011;40(5).
Bar A, Vax E, Striem S. Relationships among age, eggshell thickness and vitamin D metabolism and its expression in the laying hens. Comparative Biochemistry and Physiology 1999;123:147-154.
Barral D, Barros AC, Araújo RPC. Vitamina D: Uma abordagem molecular. Pesquisa Brasileira Odontopediatria Clínica e Integrada 2007;7(3):309-315.
Table 4 – Blood calcium levels (mg/dL) of layers fed different vitamin D sources as evaluated at different times after lay.
Hours after lay
Calcium (mg/dL) P CV (%)
Cholecalciferol
25-hydroxycholecalciferol 1,25-dihydroxycholecalciferol
1 12.32 ± 0.97 13.48 ± 0.74 13.44 ± 1.11 NS 8.88
6 14.20 ± 0.23 14.60 ± 0.23 14.41 ± 0.26 NS 6.64
12 19.68 ± 0.22 20.08 ± 0.28 19.58 ± 0.22 NS 4.84
18 25.33 ± 0.66 25.52 ± 1.39 25.51 ± 0.72 NS 15.14
24 13.89 ± 0.43 13.35 ± 0.42 14.16 ± 0.34 NS 11.52
Mean 17.09 ± 0.60 17.40 ± 0.63 17.42 ± 0.59 NS 21.06
Brant AW, Shrader HL. Equipment and methods for measuring egg quality. Department of Agriculture; 1958. 17p.
Castro LCG. O sistema endocrinológico: vitamina D. Arquivo Brasileiro de Endocrinologia e Metabologia 2011;55(8):566-575.
Costa CHR, Barreto SLT, Gomes PC, Hosoda LH, Lipari CA, Lima HJD. Níveis de fósforo disponível em dietas para codornas japonesas 45 a 57 semanas de idade. Revista Brasileira de Zootecnia 2011;40(10):2152-2160.
Costa FGP, Oliveira CFS, Dourado LRB, Neto RCL, Campos MASF, Lima AGVO. Níveis de cálcio em dietas para poedeiras semipesadas após o pico de postura. Revista Brasileira de Zootecnia 2008;37(4):624-628.
Grüdtner VS, Weingrill P, Fernandes A. Aspectos da absorção no metabolismo do cálcio e vitamina D. Revista Brasileira de Reumatologia 1997;37:143-151.
Hamilton RMG. The effects of dietary phosphorus, vitamin D3 and 25-hydroxyvitamin D3 levels on feed intake, productive performance, and egg and shell quality in two strains of force-molted white Leghorns. Poultry Science 1980;59:598-604.
HY-LINE W-36. Manual de padrões de desempenho. 2011.
Junqueira OM, Andreotti MO, Rodrigues EA, Faria DE, Casartelli EM. Influência da restrição alimentar sobre alguns constituintes plasmáticos e qualidade da casca dos ovos de poedeiras comerciais. Acta Scientiarum 2002;24(4):1021-1025.
Leeson S, Summers JD. Nutrition of the chicken. 4th ed. Guelph: University
Books; 2001. p. 179-320.
Maia GAR, Fonseca JB, Soares RTRN, Silva MA, Souza CLM. Qualidade de ovos de poedeiras comerciais alimentadas com levedura seca de cana-de-açucar. Pesquisa Agropecuária Brasileira 2002;37(9):1295-1300.
Murakami AE, Sakamoto MI, Souza LMG, Franco JRG, Mituo MAO. Determinação do melhor nível de sal comum para codornas japonesas em postura. Revista Brasileira de Zootecnia 2006;35(6).
Nunes RV, Pozza PC, Scherer C, Campestrini E, Rocha LD, Nunes CGV, Costa FGP. Efeito dos teores de cálcio para poedeiras semipesadas durante a fase de pré-postura e no início da postura. Revista Brasileira de Zootecnia2006;35(5)
Pedrosa MAC, Castro ML. Papel da vitamina D na função neuro-muscular. Arquivo Brasileiro de Endocrinologia e Metabologia 2005;49,(4).
Pelícia K, Garcia EA, Faitarone ABG, Silva AP, Berto DA, Molino AB, Vercese F. Calcium and available phosphorus levels for laying hens in second production cycle. Brazilian Journal of Poultry Science 2009;11(1):39-49.
Rodrigues EA, Junqueira OM, Valério M, Andreotti MO, Cancherini LC, Faria DE, Filardi RS.Níveis de cálcio em rações de poedeiras comerciais no segundo ciclo de postura. Acta Scientiarum 2005;27(1):49-54.
Rostagno HS, Albino LFT, Donzele JL, Gomes PC, Ferreira AS, Lopes DC, Oliveira RFM. Tabelas brasileiras para aves e suínos: composição de alimentos e exigências nutricionais. 3ªed. Viçosa: Universidade Federal de Viçosa; 2011.
Sahin, N.; Balci, T.A.; Kucuk, O.; Smith, M.O.; Sahin, K. Effects of 25-hydroxycholecalciferol and soy isoflavones supplementation of bone mineralization of quail. British Poultry Science, n. 6, v. 50, , p. 709-715, 2009.
Salvador D, Faria DE, Mazalli MR, Ito DT, Faria Filho DE, Araújo L.F. Vitaminas D e C para poedeiras na fase inicial de produção de ovos. Revista Brasileira de Zootecnia 2009;38(5).
Universidade Federal De Viçosa. SAEG – Sistema de análises estatísticas e genéticas. Versão 5.0. Viçosa, MG; 2005.