www.ccarevista.ufc.br ISSN 1806-6690
Carbon dynamics in no-till soil due to the use of industrial organic
waste and mineral fertilizer
1Dinâmica do carbono do solo em plantio direto devido ao uso de resíduos orgânicos
industriais e fertilizante mineral
Jucimare Romaniw2*, João Carlos de Moraes Sá3, Alessandra Aparecida Padilha4, Fabrícia da Silva Ramos4,
Guilherme Eurich4 e Pamela Thaísa Bressan4
ABSTRACT -The use of organic waste from industrial processes in agriculture is a strategy not only for improving soil properties but also for promoting the utilization of recycled nutrients by market crops and for reducing environmental impact. The aim of this study was to evaluate the effects of using organic waste from pork and poultry slaughterhouses (OWS) applied alone or in combination with mineral fertilizer (MF) on the dynamics of soil organic matter (SOM) compartments. The experimental design adopted was that of completely randomized blocks with six treatments and three replicates. The treatments consisted of a general control (T1) without the addition of MF and OWS, the application of MF alone at 100% of the recommended fertilizer levels for the crops (T2),the application of OWS alone at a fixed dose of 2 Mg ha-1 (T3), and the following three combinations of MF
and OWS: 75% MF + 25% OWS (T4); 50% MF + 50% OWS (T5); and 25% MF + 75% OWS (T6). The application of OWS promoted increase in the labile fractions extracted by potassium permanganate (C-OXP) and hot water (C-HW) compared with using MF alone. Using OWS in the combination of 50% MF + 50% OWS increased the content and stock of total organic carbon (TOC) in the 0-20 cm layer and of particulate organic C (POC) and C-OXP in the 0-5 cm layer.
Key words: Organic matter compartments. Total organic carbon.
RESUMO -A utilização de resíduos orgânicos provenientes de processos industriais na agricultura constitui-se em uma estratégia não apenas para melhoria dos atributos do solo, como também, para proporcionar aproveitamento dos nutrientes reciclados pelas culturas econômicas e redução no impacto ambiental. O objetivo desse trabalho foi avaliar a contribuição do uso de resíduos orgânicos de abatedouros (ROA) de aves e suínos aplicados isolados ou em combinação ao fertilizante mineral (FM) na dinâmica dos compartimentos da matéria orgânica do solo (MOS). O delineamento experimental adotado foi em blocos completamente casualizados com seis tratamentos distribuídos e três repetições. Os tratamentos constituíram-se de um controle geral (T1) sem adição de FM e ROA, e aplicação isolada de FM constituindo o suprimento de 100% da recomendação de adubação para as culturas (T2), aplicação isolada de ROA fixada na dose 2 Mg ha-1 (T3) e três combinações de FM e ROA, sendo: 75% de
FM + 25% de ROA (T4); 50% de FM + 50% de ROA (T5); e, 25% de FM + 75% de ROA (T6). A aplicação de ROA promoveu o aumento das frações lábeis (C-OXP e C-AQ) em relação ao uso isolado do FM. O uso do ROA na combinação de 50% de FM + 50% de ROA aumentou o conteúdo e o estoque de carbono orgânico total (COT) na camada de 0-20 cm e do C orgânico particulado (COP) e C lábil extraído com permanganato (C-OXP) na camada de 0-5 cm.
Palavras-chave: Carbono orgânico total. Frações da matéria orgânica.
DOI: 10.5935/1806-6690.20150029 *Autor para correspondência
1Recebido para publicação em 14/03/2014; aprovado em 07/05/2015
Parte da Dissertação de Mestrado do primeiro autor apresentada Programa de Pós-Graduação em Agronomia da Universidade Estadual de Ponta Grossa/UEPG
2Departamento de Agronomia, Universidade Estadual de Ponta Grossa/UEPG, Campus Uvaranas, Av. General Carlos Cavalcanti, 4748,Campus
Central, Praça Santos Andrade 1, Ponta Grossa-PR, Brasil, 84.030-900 [email protected]
3Departamento de Ciência do Solo e Engenharia Agrícola, Universidade Estadual de Ponta Grossa, Ponta Grossa-PR, Brasil, [email protected] 4Departamento de Agronomia, Universidade Estadual de Ponta Grossa, Ponta Grossa-PR, Brasil, [email protected], fabisr1984@
INTRODUCTION
The annual growth of pork production in developing countries was estimated to reach 1.5% by the end of 2013, and the growth rate of poultry production was estimated to reach 3.64% by 2020 (FOOD AND AGRICULTURE ORGANIZATION OF THE UNITED NATIONS, 2010). Brazil is the world’s fourth largest producer of pork and the third largest poultry producer (ASSOCIAÇÃO BRASILEIRA INDÚSTRIA PRODUTORA E EXPORTADORA DE CARNE SUÍNA, 2011; UNITED STATES DEPARTMENT OF AGRICULTURE, 2010). In this context, the State of Paraná produced 2.9 million Mg of poultry and 629,000 Mg of slaughtered pork in 2011, making it the largest poultry producer and the fourth largest pork producer in the country (INSTITUTO BRASILEIRO DE GEOGRAFIA E ESTATÍSTICA, 2010). In Brazil, nearly 3 to 4 million Mg of animal waste are produced that are not consumable by humans (BELLAVER, 2003). It is estimated that 32% of poultry, 38% of pork, 46% of cattle and 48% of sheep are considered waste and destined for recycling processes. Of these, 75-80% will be reused in the manufacture of livestock feed, and 20-22% will remain as organic waste, generally disposed of in the environment.
The National Environment Policy(Política Nacional do
Meio Ambiente - PNMA - Law 6,938, 1981) calls for the
management of industrial organic waste to prevent, protect from, and reduce pollution and to simultaneously restore the quality of the environment by recycling these wastes.
The disposal of waste in sanitary landfills and dumps is not the best solution and does not meet most of the requirements for the maintenance of environmental quality. Among the alternatives for recycling industrial organic waste, their use as a biofertilizer in agriculture is the most environmentally friendly option (NOGUEIRA,
et al., 2012). A number of studies have shown that various
types of soil management can significantly affect the labile forms of total organic carbon, and the magnitude of these effects depends on the regional climate, soil type, waste
management practices, and crop rotation (BANGERet al.,
2010; RUDRAPPAet al., 2006). Thus, analyses of the
processes and mechanisms of soil C sequestration should be related to soil attributes, specifying the cultivation systems and factors that govern the accumulation of C.
The benefits of using industrial organic waste as organic fertilizer have been well reported, including increased microbial activity and organic carbon content that result in the improvement of soil physical properties and in the increased productive potential of crops (JIANG
et al., 2006; LEITEet al., 2003). However, there are few
studies that show the effects of applying this type of waste on the labile forms of C and the potential for recovering
the quality of agricultural soils (JIANGet al., 2006).
Soil organic matter (SOM) is highly diverse in terms of oxidation state, chemical composition, size, recalcitrance, and chemical and physical protection. Since Christensen
et al. (1992) proposed a non-destructive approach for
the study of SOM using methods for separating C into compartments by size or oxidation states, there have been significant advances in the knowledge of C dynamics. Physical fractionation methods using dense liquids or wet sieving has allowed for the quantification of the impacts of management systems (BAYER; MIELNICZUK;
MARTIN-NETO, 2000; BAYERet al., 2001; SÁet al., 2001).
Particle-size fractionation of SOM proposes division into three fractions: a light fraction measuring 250 to 2000 m; a particulate fraction measuring 53 to 250 m; and a soil mineral-associate fraction measuring< 53 m. The soil mineral-associate fraction is most stable, showing no immediate sensitivity to changes in soil management practices; therefore, it constitutes the medium and long-term carbon stock. The labile fraction of C contains C extracted using hot water and oxidized by permanganate and the particulate fraction of SOM. This fraction responds rapidly to soil management systems, especially to the input of organic material in the soil and tillage operations that alter
the water and air flows in the soil (BAYERet al., 2002).
The hypothesis proposed for this study is based on the principle that the accumulation of C in soil results from creating a continuous flow of C from the labile fractions supporting the formation of stable C compartments. Consequently, favorable conditions for an increase in grain production are generated in response to improved chemical, physical and biological properties. In this context, the specific objective of this study was to assess the carbon dynamics in soil carbon compartments in response to the application of biofertilizers alone or in combination with mineral fertilizers within 5 years of adoption of a no-till system.
MATERIALS AND METHODS
Description of the study site
The soil in the experimental area was classified as Haplic Cambisol (Inceptisol), with medium texture in the 0-20 cm layer and sand, silt, and clay levels of 665, 89,
and 247g kg-1, respectively. Prior to the experiment, soil
samples were collected at depths of 0-5, 5-10, 10-20, and 0-20 cm to assess soil fertility (Table 1).
The organic fertilizer used in the experiment, hereafter called organic waste from a slaughterhouse (OWS), consisted of residues originating from the slaughter of poultry and pork (e.g., viscera, cartilage,
Table 1 -Chemical properties of the soil from the experimental area before starting the experiment in June 2009 in a Haplic Cambisol1,
Ponta Grossa - PR
The numbers in the rows represent the average of ten points sampled in the experimental area.1Soil Taxonomy 11 ed., 2010;2 pH extracted by CaCl 2
(1:2.5);3 Extracted with 0.5 mol L-1 calcium acetate, pH 7.0, and measured by titration;4 Extracted with 1 mol L-1 potassium chloride and measured
by titration;5 Extracted with Melich-1 solution;6 CEC: cation exchange capacity at pH 7; and7 Average of nine points analyzed using dry combustion
Table 2 -Chemical analysis of organic waste used in the experiment, originating from poultry and pork slaughterhouses
1 Average of five samples collected from the residue mound after processing;2 pH in water;3 Extracted by dry combustion;4 Colorimetric method;5 Determined
by atomic absorption spectrophotometry;6 Barium chloride spectrophotometric method; and7 Extracted using the azomethine-H spectrophotometric method
Prof. (cm) pH(2) H + Al+3 (3) Al+3 (4) Ca+2 (5) Mg+2 (5) K+ (4) CEC(6) P(5) C(7)
Cm --- cmolcdm-3--- mg dm3 g kg-1
0-5 4.86 6.62 0.09 3.58 1.63 0.36 12.2 52.0 22.3
5-10 4.70 7.27 0.17 1.47 1.47 0.25 10.4 40.1 14.3
10-20 4.60 7.15 0.21 2.23 1.24 0.19 10.8 30.7 11.3
0-20 4.58 7.18 0.19 2.51 1.29 0.24 11.2 38.1 14.8
Attributes Unit Content(1)
pH(2) 6.70
Moisture (60-65 ºC) g kg-1 36.0
Total organic carbon(3) g kg-1 321
Total nitrogen(3) g kg-1 47.2
Phosporus(4) g kg-1 10.5
Potassium(5) g kg-1 9.50
Sulfur(6) g kg-1 3.50
Calcium(5) g kg-1 109
Magnesium(5) g kg-1 4.10
Boron(7) mg kg-1 18.1
Cooper(5) mg kg-1 51.2
Iron(5) mg kg-1 15341
Manganese(5) mg kg-1 1086
Mo(5) mg kg-1 3.1
Sodium(5) mg kg-1 3110
Zinc(5) mg kg-1 90.5
The experiment had a randomized block design with six treatments and three replicates, as follows: (i) General control without mineral fertilizer (MF) and without organic waste from slaughterhouses (OWS), henceforth referred to as T1; (ii) the application of MF alone to provide 100% of the recommended fertilizer levels (following the recommendations for the crops and the soil analysis of the ABC Foundation), henceforth referred to as T2; (iii) the application of OWS alone at 100% of the dose based on the amount of N in the OWS per crop per season, henceforth referred to as T3; (iv) a combination of 75% MF (T2) + 25% OWS (T3), henceforth referred to as T4; (v) a combination of 50% MF (T2) + 50% OWS (T3), henceforth referred to as T5; and (vi) a combination of 25% MF (T2) + 75% OWS (T3), henceforth referred to as T6.
Each experimental unit was 40 m2, 8 m long and 5
m wide. The experiment began on November 20, 2009, and soil samples for C analysis were collected after the summer harvest in May 2012, with the total C recorded after five crops. The crop rotation in the study period occurred as follows: beans in the summer, wheat in the winter, soybeans in the summer, black oats in the winter, and corn in the summer. The treatments were always applied one day after sowing for each crop, the details of which have been provided in the description of the crops and management practices (Table 3).
Table 3 - Crop, variety, cultivar or hybrid, spacing, plant population, and dates of sowing and harvesting in the no-till system in the experimental area
1 Row spacing in centimeters;2 Dry mass of black oats was collected; and3 Broadcast sowing of black oats
Crop Variety Row spacing(1) Plant population Sowing date Harvest date
Bean Uirapuru 45 280,000 plants ha-1 11/20/2009 02/27/2010
Wheat Safira 17 320 plants m-2 07/06/2010 11/20/2010
Soybean BRS 246 RR 45 400,000 plants ha-1 12/04/2010 04/15/2010
Oat IAPAR 61 (3) 350 plants m-2 06/17/2011(2) 09/15/2011
Corn 30F53H 80 60,000 plants ha-1 09/26/2011 04/28/2012
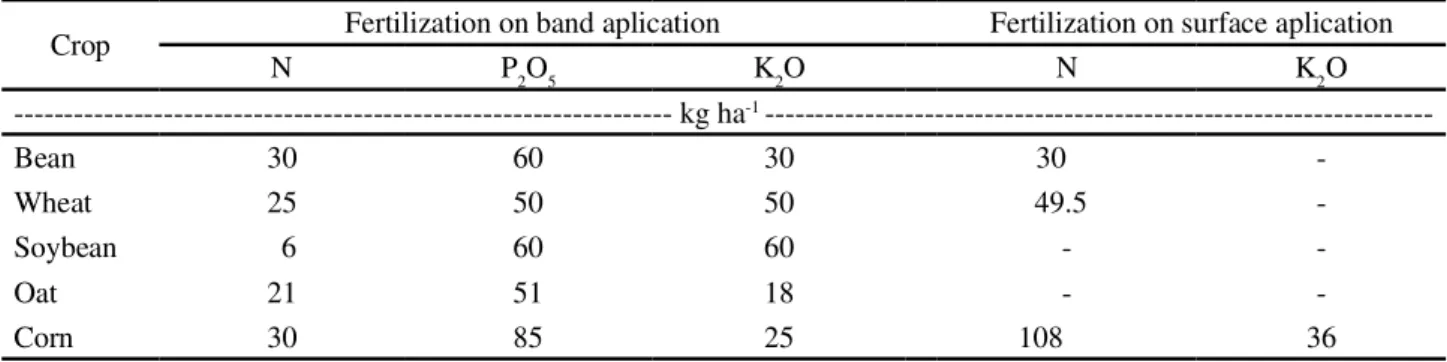
Table 4 - Amount of mineral fertilizer applied in treatment T2 (100% MF) for each crop
Crop Fertilization on band aplication Fertilization on surface aplication
N P2O5 K2O N K2O
--- kg ha-1
---Bean 30 60 30 30
-Wheat 25 50 50 49.5
-Soybean 6 60 60 -
-Oat 21 51 18 -
-Corn 30 85 25 108 36
Control of weeds, pests, and diseases and other crop management practices were performed according to the recommendations for each crop. The definition of the nutrient requirements for the fertilizer recommendation for all crops was based on the concentrations found in the soil analysis and on the needs of the crops according to the regional recommendations of the ABC Foundation. The amount of MF applied is shown in Table 4. In treatments T4, T5, and T6, the doses shown in Table 4 were reduced to 75, 50, and 25% MF.
The nutritional content of the OWS applied in each treatment is shown in Table 5, and all crop seasons received the same amounts of the nutrients listed below. Treatments T4, T5, and T6 received, respectively, 25, 50, and 75% of the OWS dose applied to T3.
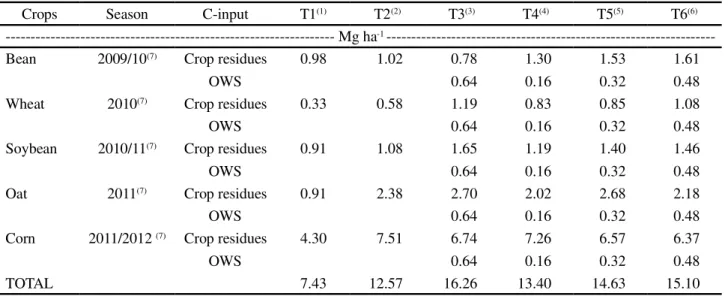
The quantity of OWS was defined based on the amount of N in the waste and adjusted for each combination of treatments. The annual input of C into the system through crop residue (roots and shoots) was measured through the cumulative grain yield for each treatment during the study period. The estimate for each treatment was based on the harvest index (HI), the root/shoot ratio, and the amount of C
in each crop (SÁet al., 2014; TIVETet al., 2013) as well
Table 5 - Amounts of nutrients supplied via the OWS in each treatment by crop season for each crop residues
1T1 = General control (without MF and OWS);2 T2 = 100% MF;3: T3 = 100% OWS;4 T4 = 75% MF + 25% OWS;5 T5 = 50% MF + 50%
OWS; and6 T6 = 25% MF + 75% OWS
Nutrient T1(1) T2(2) T3(3) T4(4) T5(5) T6(6)
--- kg ha-1
---N - - 94.4 23.6 47.2 70.8
P - - 21.0 5.25 10.5 15.8
K - - 19.0 4.75 9.50 14.3
each treatment during the study period, which was used as the basis for understanding the variation in the C stock.
Collection and preparation of soil samples
In May 2012, after the corn crop season, the soil samples were collected from the 0-5, 5-10, and 10-20 cm soil layers using an auger. The samples were oven dried at 40 °C until achieving constant weight and were then broken up and passed through a 2 mm sieve. Particle size analysis (sand, silt and clay) and the determination of the components of the soil exchange complex were performed on these samples.
Particle-size fractionation of soil C
Particle-size fractionation of SOM was performed on the 2-mm sieved samples to separate the particulate carbon (POC) fraction, with a size between 53 and 2000 m, and the mineral-bound organic carbon (MOC) fraction, i.e., smaller than 53 µm (<53 µm).This procedure was
1T1 = General control (without MF and OWS);2 T2 = 100% MF;3 T3 = 100% OWS;4 T4 = 75% MF + 25% OWS;5 T5 = 50% MF + 50%
OWS;6 T6 = 25% MF + 75% OWS; and7 Crop year
Table 6 -Carbon (C) inputs derived from plant biomass (shoots and roots) and organic waste from slaughterhouses (OWS) during the five crop seasons of the experiment
Crops Season C-input T1(1) T2(2) T3(3) T4(4) T5(5) T6(6)
--- Mg ha-1
---Bean 2009/10(7) Crop residues 0.98 1.02 0.78 1.30 1.53 1.61
OWS 0.64 0.16 0.32 0.48
Wheat 2010(7) Crop residues 0.33 0.58 1.19 0.83 0.85 1.08
OWS 0.64 0.16 0.32 0.48
Soybean 2010/11(7) Crop residues 0.91 1.08 1.65 1.19 1.40 1.46
OWS 0.64 0.16 0.32 0.48
Oat 2011(7) Crop residues 0.91 2.38 2.70 2.02 2.68 2.18
OWS 0.64 0.16 0.32 0.48
Corn 2011/2012(7) Crop residues 4.30 7.51 6.74 7.26 6.57 6.37
OWS 0.64 0.16 0.32 0.48
TOTAL 7.43 12.57 16.26 13.40 14.63 15.10
performed by weighing 40 g of soil in a 1-L plastic bottle and adding 100 mL of deionized water and 0.75 g hexametaphosphate. Next, the samples were placed on a horizontal shaker (set to 100 rpm) to separate the fractions according to the method described by Feller (1994) and
modified by Sáet al. (2001). After shaking, the soil was passed
through a 5-µm sieve, and the material that was retained on this sieve represented the POC fraction (>53µm to 2000 m). The material that passed through the sieve was placed in a beaker and represented the MOC fraction (<53 µm).
Determination of total organic C in the whole sample and particle-size fractions
The total organic carbon (TOC) was determined in both the whole samples and in the POC and MOC fractions through the dry combustion method using a C and N elemental analyzer (TruSpec CN LECO® 2006, St. Joseph,
The determinations of the labile fractions of carbon oxidized by permanganate (C-OXP) and extracted with hot water (C-HW) were performed on whole soil samples. The C-HW was extracted by the method adapted by Ghani, Dexter and Perrott (2003). In short, 3 g of soil was weighed into a 25-mL tube to which 10 mL of deionized water was added. The mixture was stirred manually for 10 seconds to ensure complete suspension, and then the tubes were dried in an oven at 80 °C for 16 hours. After incubation, centrifugation was performed at 4000 rpm. Next, the supernatant was removed, and the C-HW was determined using wet oxidation following the modified method of Walkley and
Black (1934) as described by Nelsonet al. (1996).
The extraction of the C-OXP was based on the method of Tirol-Padre and Ladha (2004). In short, 10 mL
of 60 mmol L-1 of potassium permanganate (KMnO
4) solution was added to the soil sample remaining in the 25-mL tube after the hot water extraction. Then, the samples were placed on a tube shaker for 10 seconds, after which 2 mL of the supernatant was removed and transferred to a glass container. Next, 100 mL of deionized water was added before reading on a visible light spectrophotometer set to absorbance at 565 nm.
Calculation of the C stock in the whole samples and in the particle-size fractions
The C stock was calculated for the whole samples in each layer sampled and in each particle-size fraction. The
following formula was used: stC = (TOC x Ds xt)/10, where
stC is the stock of total organic carbon in the soil at a given
depth (Mg ha-1); COT is the total organic carbon content
expressed in g kg-1; Ds is the soil bulk density at each depth,
expressed as Mg m-3; andtrepresents the thickness of the
given layer expressed in cm. Soil bulk density was determined using the volumetric ring method, following Blake and Hartge (1986). The mean Ds values were obtained by averaging three rings per experimental unit in three replicates for a total of 36 rings per sampled layer. The means, with respective standard deviations shown in parentheses, were 1.26 ( 0.12), 1.40
( 0.10), 1.37 ( 0.07), and 1.35 ( 0.05) Mg m-3for the
0-5, 5-10, 10-20, and 0-20 cm layers, respectively. The results for the content and the stock of TOC in the whole samples, the particle-size fractions, and the labile compartments of SOM were subjected to analysis of variance (ANOVA). The means that were significantly different by the F-test were compared using the LSD test at 5% probability
= 0.05) using SISVAR version 5.1 (FERREIRA, 2007).
RESULTS AND DISCUSSION
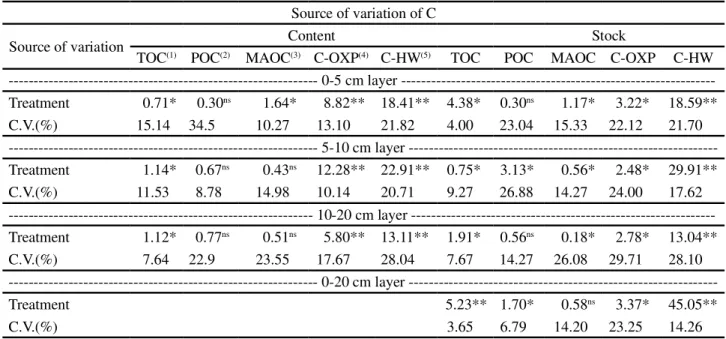
The results of the analysis of variance (Table 7) showed a significant response to the treatments in the stock of TOC, MOC, C-OXP, and C-HW (p<0.05 and <0.01).There was a significant effect on the TOC and C-OXP contents in all of analyzed layers (p <0.05 for TOC and p<0.01 for C-OXP).
Table 7 -ANOVA F values and coefficients of variation (CV) for the TOC content and stock of the soil and compartments in response to the use of mineral fertilizer and organic waste from slaughterhouses applied alone or in combination in a no-till system
ns, non-significant; * Significant at 5%; ** Significant at 1%;1 TOC - Total organic carbon;2 POC - Particulate organic carbon;3 MOC -
Mineral-bound organic carbon;4 C-OXP - Carbon oxidized by permanganate; and5 C-HW Carbon extracted by hot water
Source of variation of C
Source of variation Content Stock
TOC(1) POC(2) MAOC(3) C-OXP(4) C-HW(5) TOC POC MAOC C-OXP C-HW
--- 0-5 cm layer
---Treatment 0.71* 0.30ns 1.64* 8.82** 18.41** 4.38* 0.30ns 1.17* 3.22* 18.59**
C.V.(%) 15.14 34.5 10.27 13.10 21.82 4.00 23.04 15.33 22.12 21.70
5-10 cm layer
---Treatment 1.14* 0.67ns 0.43ns 12.28** 22.91** 0.75* 3.13* 0.56* 2.48* 29.91**
C.V.(%) 11.53 8.78 14.98 10.14 20.71 9.27 26.88 14.27 24.00 17.62
10-20 cm layer
---Treatment 1.12* 0.77ns 0.51ns 5.80** 13.11** 1.91* 0.56ns 0.18* 2.78* 13.04**
C.V.(%) 7.64 22.9 23.55 17.67 28.04 7.67 14.27 26.08 29.71 28.10
0-20 cm layer
---Treatment 5.23** 1.70* 0.58ns 3.37* 45.05**
There was only a significant difference in the interaction between the POC content and stock in the 5-10 cm layer in response to the applied treatments.
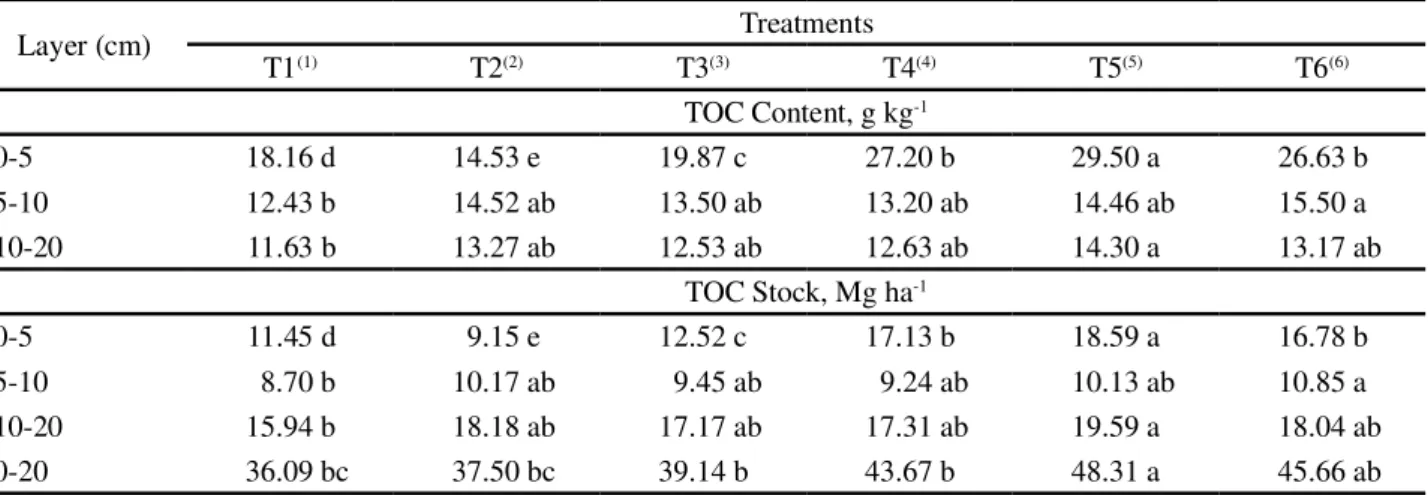
The greater TOC content and stock in the 0-5 cm layer and the greater TOC stock in the 0-20 cm layer caused by the combination of 50% MF + 50% OWS (Table 8) emphasizes the treatment response of the biomass and root systems of the plants, resulting in improved structure. The contribution of the root system to C accumulation was well described by Wander and Yang (2000) and is likely due to the lower rate of decomposition of this structure compared with the shoots (BALESDENT; MARIOTTI, 1996). In addition to the results of Wander and Yang (2000), Balesdent and Mariotti (1996), Rasse, Rumpel and Dignac (2005) evaluated the results of numerous studies and concluded that the C derived from the roots remains in the soil 2.4 times longer than the C from the shoots due to the presence of organic compounds with longer residence times and greater stability in the soil.
In sugarcane crops, Andrade, Oliveira and Cerri (2005) applied biosolids derived from the treatment of sewage sludge and found greater increases in TOC only after the second year of application. Successive applications generated increasing increments over time. In the present study, the TOC gains in the C stock that accumulated in the 0-20 cm layer responded to the application of the different treatments (smaller stocks were observed in the control and greater stocks in the treatments with some form of fertilization), indicating a progressive trend of C accumulation (Table 8). At issue is the determination of the inflection point of the curve and the beginning of C stabilization in this system with a continuous supply of OWS.
Table 8 -Total organic C (TOC) content and stock in response to the use of mineral fertilizer and organic waste from slaughterhouses applied alone or in combination under a no-till system
1T1 = General control (without MF and OWS);2 T2 = 100% MF;3 T3 = 100% OWS;4 T4 = 75% MF + 25% OWS;5 T5 = 50% MF + 50%
OWS; and6 T6 = 25% MF + 75% OWS. Means with the same letters in the same row do not differ from each other by the LSD test at 5%. ns –
non-significant by the F-test at 5%
Layer (cm) Treatments
T1(1) T2(2) T3(3) T4(4) T5(5) T6(6)
TOC Content, g kg-1
0-5 18.16 d 14.53 e 19.87 c 27.20 b 29.50 a 26.63 b
5-10 12.43 b 14.52 ab 13.50 ab 13.20 ab 14.46 ab 15.50 a
10-20 11.63 b 13.27 ab 12.53 ab 12.63 ab 14.30 a 13.17 ab
TOC Stock, Mg ha-1
0-5 11.45 d 9.15 e 12.52 c 17.13 b 18.59 a 16.78 b
5-10 8.70 b 10.17 ab 9.45 ab 9.24 ab 10.13 ab 10.85 a
10-20 15.94 b 18.18 ab 17.17 ab 17.31 ab 19.59 a 18.04 ab
0-20 36.09 bc 37.50 bc 39.14 b 43.67 b 48.31 a 45.66 ab
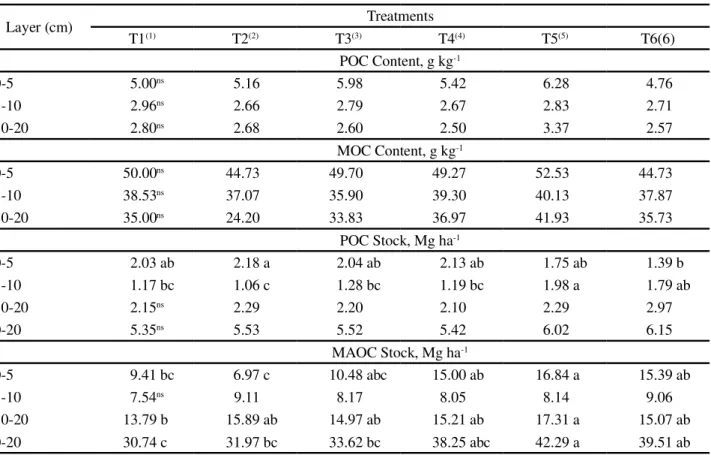
The MOC and POC stocks were affected by the treatments (Table 9). The combination of 50% MF + 50% OWS (T5) resulted in greater migration of C from POC to MOC in the 0-5, 10-20, and 0-20 cm layers. Linear relationships have been reported between the input of biomass-C and C stocks in tropical and subtropical climates (BAYER; MIELNICZUK; MARTIN-NETO, 2000;
BAYERet al., 2006; SÁet al., 2001; SÁet al., 2014).
In this study, we emphasize that the largest POC and MOC stocks occurred in treatments that received MF and OWS in combination, demonstrating a relationship between these fractions and the productive response of crops in these systems due to the promotion of a greater return of biomass from shoots and roots to
the soil (LEITEet al., 2003). In contrast, the greatest
concentration of labile carbon has been found in the surface layer and in no-till systems and has also shown a strong linear relationship due to greater biomass production
(ROSSI,et al., 2012; SÁet al., 2014; TIVETet al., 2013).
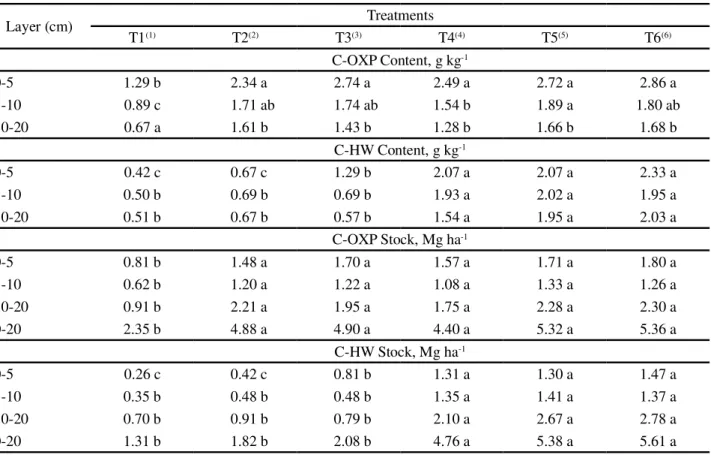
Carbon extracted by hot water (C-HW) and carbon oxidized by permanganate (C-OXP) are part of the soil C fraction with high lability and are influenced by management systems, particularly those that supply
organic material to the soil (BAYERet al., 2002). The
content and stock of the labile fractions (C-OXP and C-HW) significantly increased in all layers evaluated with OWS applied alone or in combination with MF (Table 10). This result supports the argument that OWS is generating a continuous C flow, which over time, is promoting the migration of C to the most stable compartment, thereby contributing to the increase in
TOC (SÁ et al., 2009; SÁ et al., 2014; TIVET et al.,
Layer (cm) Treatments
T1(1) T2(2) T3(3) T4(4) T5(5) T6(6)
POC Content, g kg-1
0-5 5.00ns 5.16 5.98 5.42 6.28 4.76
5-10 2.96ns 2.66 2.79 2.67 2.83 2.71
10-20 2.80ns 2.68 2.60 2.50 3.37 2.57
MOC Content, g kg-1
0-5 50.00ns 44.73 49.70 49.27 52.53 44.73
5-10 38.53ns 37.07 35.90 39.30 40.13 37.87
10-20 35.00ns 24.20 33.83 36.97 41.93 35.73
POC Stock, Mg ha-1
0-5 2.03 ab 2.18 a 2.04 ab 2.13 ab 1.75 ab 1.39 b
5-10 1.17 bc 1.06 c 1.28 bc 1.19 bc 1.98 a 1.79 ab
10-20 2.15ns 2.29 2.20 2.10 2.29 2.97
0-20 5.35ns 5.53 5.52 5.42 6.02 6.15
MAOC Stock, Mg ha-1
0-5 9.41 bc 6.97 c 10.48 abc 15.00 ab 16.84 a 15.39 ab
5-10 7.54ns 9.11 8.17 8.05 8.14 9.06
10-20 13.79 b 15.89 ab 14.97 ab 15.21 ab 17.31 a 15.07 ab
0-20 30.74 c 31.97 bc 33.62 bc 38.25 abc 42.29 a 39.51 ab
Table 9 - C content and stock in the particulate (POC) and mineral-associate organic C (MAOC) compartment in response to the use of mineral fertilizer and organic waste from slaughterhouses applied alone or in combination under a no-till system
1T1 = General control (without MF and OWS);2 T2 = 100% MF;3 T3 = 100% OWS;4 T4 = 75% MF + 25% OWS;5 T5 = 50% MF + 50%
OWS; and6 T6 = 25% MF + 75% OWS. Means with the same letters in the same row do not differ from each other by the LSD test at 5%. ns
– non-significant by the F-test at 5%
This study also found a short-term increase in labile forms (C-POX and C-HW) as a result of applying the combination of 50% MF and 50% OWS, which stimulated biological activity in the soil and generated a continuous C flow in the system (SÁ; LAL, 2009). Consequently, adding decomposing organic materials
promotes greater soil aggregation (SU et al., 2006) and
better protection of intra-aggregate C (TIVETet al., 2013).
The statistically significant increase in OXP and C-HW in response to the use of OWS in combination with MF (Table 10) indicates that the increase in TOC is being supplied by the labile fraction. The C-HW stock, which represents much of the C bound to microbial biomass, was greater in the treatments with combined MF and OWS, showing that it is the main component of a proposed continuous C flow. The cumulative stock in the 0-20 cm layer in T6 (Table 10)
was 4.07 Mg ha-1 and 3.56 Mg ha-1 greater than that of the
general control (T1) and that of T2 (100% MF), respectively. The increase in this compartment indicates that the conditions are favorable for increasing the soil microbial activity, which provides the support for the transfer of new C to
more stable forms bound to the clay fraction (BLAIR;
CROCKER, 2000; SIXet al., 2006; TIVETet al., 2013).
The C-HW content decreased with increasing depth of the sampled layers in the soil profile, demonstrating that stratification in the soil profile (Table 10) is a natural process. Although this fact has been well reported in no-till
systems (BRIEDIS et al., 2012; FERREIRAet al., 2013;
FIGUEIREDOet al., 2007; SÁ; LAL, 2009;), the effect
is even more pronounced in the present experiment because the types of organic compounds in OWS are easily oxidized and serve as an energy source for the activity of the microbial community.
In summary, the C input from waste on the soil surface was greater in treatments with the application of OWS in combination with MF and lower in the general control and in the treatment with MF alone. This input promoted soil microbial activity and stimulated a continuous organic matter
mineralization process (BALESDENT et al., 1998). As a
Table 10 - Content and stock of C oxidizable by potassium permanganate (C-OXP) and hot water (C-HW) in response to the use of mineral fertilizer and organic residue from slaughterhouses applied alone or in combination under a no-till system
1T1 = General control (without MF and OWS);2T2 = 100% MF;3T3 = 100% OWS;4T4 = 75% MF + 25% OWS;5T5 = 50% MF + 50% OWS; and6T6 = 25%
MF + 75% OWS. Means with the same letters in the same row do not differ from each other by the LSD test at 5%, ns – non-significant by the F-test at 5%
forms of SOM. The use of OWS alone or in combination with MF was shown to be an alternative not only for recycling nutrients but also for increasing the soil capacity and accumulating C as well as for contributing to the mitigation
of some CO2emissions resulting from grain production.
The TOC, C-POX, and C-HW stocks in the 0-20 cm layer yielded significant gains with the C supplied (Tables 8 and 10). This difference may be the result of the increased root biomass due to the increased cumulative grain production, thus generating more plant biomass (Table 6). The contribution of biomass from shoots and roots, combined with no-till, may contribute to the increase in the soil organic matter (SOM)
content and carbon (C) stocks (SÁet al., 2014).
CONCLUSIONS
The application of OWS alone or in combination with MF promoted gains in the labile forms of C. The increase in the stock of these fractions promoted the generation of a C flow that supported the increase in TOC for the treatment where
OWS was applied in combination with 50% MF. The use of OWS is an option that can potentially mitigate C emissions, with a consequent positive environmental impact.
REFERENCES
ASSOCIAÇÃO BRASILEIRA INDÚSTRIA PRODUTORA E EXPORTADORA DE CARNE SUÍNA.Relatório ABIPECS 2010. Disponível em: <www.abipecs.org.br>. Acesso em: 19 dez. 2013. ANDRADE, C. A.; OLIVEIRA, C.; CERRI, C. C. Organic matter quality and carbon and nitrogen stocks in an Oxisol treated with biossolids and cultivated with eucalyptus.Revista Brasileira de Ciência do Solo, v. 29, n. 5, p. 803-816, 2005.
BALESDENT, J.et al. The dynamics of carbon in particle-size fractions of soil in a forest-cultivation sequence.Plant and Soil, v. 201, n. 1, p. 49-57, 1998.
BALESDENT, J.; MARIOTTI, A. 1996. Measurement of soil organic matter turnover using 13C natural abundance. In: Mass Spectrometry of Soils (eds BOUTTON, T. W.; YAMASAKI S. I.), p. 83±111, 1996.
Layer (cm) Treatments
T1(1) T2(2) T3(3) T4(4) T5(5) T6(6)
C-OXP Content, g kg-1
0-5 1.29 b 2.34 a 2.74 a 2.49 a 2.72 a 2.86 a
5-10 0.89 c 1.71 ab 1.74 ab 1.54 b 1.89 a 1.80 ab
10-20 0.67 a 1.61 b 1.43 b 1.28 b 1.66 b 1.68 b
C-HW Content, g kg-1
0-5 0.42 c 0.67 c 1.29 b 2.07 a 2.07 a 2.33 a
5-10 0.50 b 0.69 b 0.69 b 1.93 a 2.02 a 1.95 a
10-20 0.51 b 0.67 b 0.57 b 1.54 a 1.95 a 2.03 a
C-OXP Stock, Mg ha-1
0-5 0.81 b 1.48 a 1.70 a 1.57 a 1.71 a 1.80 a
5-10 0.62 b 1.20 a 1.22 a 1.08 a 1.33 a 1.26 a
10-20 0.91 b 2.21 a 1.95 a 1.75 a 2.28 a 2.30 a
0-20 2.35 b 4.88 a 4.90 a 4.40 a 5.32 a 5.36 a
C-HW Stock, Mg ha-1
0-5 0.26 c 0.42 c 0.81 b 1.31 a 1.30 a 1.47 a
5-10 0.35 b 0.48 b 0.48 b 1.35 a 1.41 a 1.37 a
10-20 0.70 b 0.91 b 0.79 b 2.10 a 2.67 a 2.78 a
BANGER, K.,et al. Soil organic carbon fractions after 16-years of applications of fertilizers and organic manure in a Typic Rhodalfs in semi-arid tropics. Nutrient Cycling in Agroecosystems,v. 3, n. 86, p. 391-399, 2010.
BAYER, C. et al. Carbon sequestration in two Brazilian Cerrado soils under no-till.Soil and Tillage Research,v. 86, n. 2, p. 237-245, 2006.
BAYER, C.et al. Tillage and cropping system effects on soil humic acid characteristics as determined by electron spin resonance and fluorescence spectroscopies.Geoderma, v. 105, n. 1/2, p. 81-92, 2002.
BAYER, C.et al. Changes in soil organic matter fractions under subtropical no-till cropping systems. Soil Science Society of America Journal, v.65, p.1473-1478, 2001.
BAYER, C.; MIELNICZUK, J.; MARTIN-NETO, L. Efeito de sistemas de preparo e de cultura na dinâmica da matéria orgânica e na mitigação das emissões de CO2. Revista Brasileira de Ciência do Solo, v. 24, n. 3, p. 599-607, 2000.
BELLAVER, C. Inter-relações do beneficiamento dos subprodutos do abate com a produção animal, ambiente e economia no Brasil. In: WORKSHOP SOBRE SUBPRODUTOS DE ORIGEM ANIMAL NA ALIMENTAÇÃO. 2003. São Paulo. Anais... Concórdia, SC: Embrapa Suínos e Aves, 2003. v. 2, p. 1-7. BLAIR, N.; CROCKER, G. J. Crop rotation effects on soil carbon and physical fertility of two Australian soils. Soil Research, v. 38, n. 1, p. 71-84, 2000.
BLAKE, G. R.; HARTGE, K. H. Bulk density. KLUTE, A. (Ed.). Methods of soil analysis. Part 1.Physical and mineralogical methods. 2nd. ed. Madison: Wisconsin, American Society of Agronomy, Soil Science Society of America, 1986. p. 363-375. (Agronomy Series, 5).
BRIEDIS, C. et al. Particulate soil organic carbon and stratification ratio increases in response to crop residue decomposition under no-till.Revista Brasileira de Ciência do Solo, v. 36, n. 5, p. 1483-1490, 2012.
CHRISTENSEN B. T. Physical fractionation of soil and organic matter in primary particle size and density separates. Advances in Soil Science. In press, 1992.
FOOD AND AGRICULTURE ORGANIZATION OF THE UNITED NATIONS.Statistical Yearbook 2013.Disponível em <http://faostat3.fao.org/faostat-gateway/go/to/home/E > Consultado em 12/04/2013.
FELLER, C.Lá matiére organique dansle sols tropicaux à argiles 1:1. Recherche de compartiments organiques fonctionnels.Uneap proche granulométrique. Thèse (Doctorate ès Science) - University of Strasbourg (ULP), Strasbourg, France, 1994. p. 393.
FERREIRA, D. F.SISVAR 5.0.Lavras: Universidade Federal de Lavras, 2007.
FIGUEIREDO, C. C. D.et al. Carbono e nitrogênio da biomassa microbiana em resposta a diferentes sistemas de manejo em um Latossolo Vermelho no Cerrado.Revista Brasileira de Ciência do Solo, v. 31, n. 3, p. 551-562, 2007.
GHANI, A.; DEXTER, M.; PERROTT, K. W. Hot-water extractable carbon in soils: a sensitive measurement for determining impacts of fertilization, grazing and cultivation. Soil Biology and Biochemistry, v. 35, n. 9, p. 1231-1243, 2003.
INSTITUTO BRASILEIRO DE GEOGRAFIA E ESTATÍSTICA. Banco de Dados Agregados. 2010. Disponível em: <http://www.sidra.ibge.gov.br/bda/territorio/ default. asp?z=t&o=4&i=P>. Acesso em: 27 dez. 2013. INSTITUTO AGRONÔMICO DO PARANÁ. Cartas climáticas do Paraná. Disponível em: <http://www.iapar.br/modules/conteudo/ conteudo.php?conteudo=856>. Acesso em: 27 jan. 2013.
JIANG, H. M.et al. Soil carbon pool and effects of soil fertility in seeded alfalfa fields on the semi-arid Loess Plateau in China.Soil Biology and Biochemistry, v. 38, n. 8, p. 2350-2358, 2006.
LEITE, L. F. C.et al. Estoques totais de carbono orgânico e seus compartimentos em Argissolo sob floresta e sob milho cultivado com adubação mineral e orgânica.Revista Brasileira de Ciência do Solo, v. 27, n. 5, p. 821-832, 2003.
NELSON, D. W. et al. Total carbon, organic carbon, and organic matter.In:Methods of soil analysis.1996. p. 961-1010. Part 3-chemical methods.
NOGUEIRA, N. O. et al. Influência da aplicação de dois resíduos industriais nas propriedades químicas de dois solos cultivados com café arábica.Revista Ciência Agronômica, v. 43, n. 1, p. 11-21, 2012.
RASSE, D. P.; RUMPEL, C.; DIGNAC, M. F. Is soil carbon mostly root carbon? Mechanisms for a specific stabilization. Plant and Soil, v. 269, n. 1/2, p. 341-356, 2005.
ROSSI, C. Q. et al. Frações lábeis da matéria orgânica em sistema de cultivo com palha de braquiária e sorgo. Revista Ciência Agronômica, v. 43, n. 1, p. 38-46, 2012.
RUDRAPPA, L. et al.Long-term manuring and Fertilization effects on soil organic carbon pools in a Typic Haplustept of semiarid sub-tropical India.Soil and Tillage Research, v. 88, n. 1/2, p. 180-192, 2006.
SÁ, J. C. M.et al. Long-term tillage systems impacts on soil C dynamics, soil resilience and agronomic productivity of a Brazilian Oxisol.Soil and Tillage Research. v. 136, p. 38-50, 2014. SÁ, J. C. M. et al. Organic matter dynamics and carbon sequestration rates for a tillage chronosequence in a Brazilian Oxisol. Soil Science Society Americam Journal, v.65, p. 1486-1499, 2001.
SÁ, J. C. M.; LAL, R. Stratification ratio of soil organic matter pools as an indicator of carbon sequestration in a tillage chronosequence on a Brazilian Oxisol. Soil & Tillage Research. v. 103, n. 1, p. 46–56, 2009.
SIX, J. et al. Bacterial and fungal contributions to carbon sequestration in agroecosystems.Soil Science Society of America Journal.v. 70, n. 2, p. 555-569, 2006.
under the wheat–wheat–maize cropping system in northwest China.Nutrient Cycling in Agroecosystems,v. 75, n. 1-3, p. 285-295, 2006.
TIVET, F. E. et al. Aggregate C depletion by plowing and its restoration by diverse biomass-C inputs under no-till in sub-tropical and tropical regions of Brazil.Soil and Tillage Research, v. 126, p. 203-218, 2013.
UNITED STATES DEPARTMENT OF AGRICULTURE. Keys to Soil Taxonomy. 11 ed. Washington, DC: Natural Resources Conservation Service, 2010. 338 p.