Received November 11, 2009 and accepted November 10, 2010. Corresponding author: [email protected]
True and apparent digestibility of protein and amino acids of feed in Nile
tilapia
1Felipe Barbosa Ribeiro2, Eduardo Arruda Teixeira Lanna3, Marcos Antonio Delmondes Bomfim2, Juarez Lopes Donzele3, Moisés Quadros4, Patrícia de Souza Lima Cunha5
1Financiado pelo CNPq, FAPEMIG e INCT-CA. 2Curso de Zootecnia – CCAA/UFMA. 3Departamento de Zootecnia – DZO/UFV. 4Embrapa Roraima.
5Doutorando do Programa de Pós-graduação em Zootecnia – UFV.
ABSTRACT -It was determined in this work the coefficients of apparent and true digestibility of protein and amino acids of five feeds (corn, wheat bran, soybean meal, corn gluten meal, fish meal) in Nile tilapia. It was used 252 reverted Thai strain Nile tilapia (Oreochromis niloticus) in growth phase, with weight of 310 ± 9.68 g, distributed in experimental randomized blocks
design, with five treatments, six replicates per treatment and seven fish per experimental unit. Each experimental diet contained a single source of protein, composed by the studied ingredients. An additional group of fish was fed protein-free diet for quantification of the endogenous fraction and determination of true digestibility coefficients. Digestibility was estimated by the indirect method by using chromium oxide at the concentration of 0.50% of the diet as a marker, performing fecal collection at every four hour interval by using decantation technique. Coefficients of apparent digestibility of the protein and amino acids are: corn, 83.57 and 82.45%; wheat bran 82.87 and 81.47%; soybean meal 91.12 and 89.41%; corn gluten meal 90.07 and 87.78%; fish meal 83.53 and 81.65% respectively. Coefficients of true digestibility of protein and the mean of the amino acids are: corn, 90.02 and 89.60%; wheat bran 89.62 and 89.14%; soybean meal 93.58 and 91.88%; corn gluten meal 92.50 and 90.34%; fish meal 86.01 and 84.27%, respectively.
Key Words: growth phase, ingredients, nutrition, Oreochromis niloticus
Digestibilidade aparente e verdadeira de proteína e aminoácidos de
alimentos em tilápia-do-nilo
RESUMO - Foram determinados nesta pesquisa os coeficientes de digestibilidade aparente e verdadeira da proteína e dos aminoácidos de cinco alimentos (milho, farelo de trigo, farelo de soja, glúten de milho e farinha de peixe) em tilápias-do-nilo. Utilizaram-se 252 tilápias revertidas (Oreochromis niloticus) em fase de crescimento, da linhagem tailandesa, com peso de
310 ± 9,68 g, distribuídas em delineamento de blocos casualizados, composto de cinco tratamentos, seis repetições por tratamento e sete peixes por unidade experimental. Cada dieta experimental continha uma única fonte proteica, composta pelos ingredientes estudados. Um grupo adicional de peixes foi alimentado com dieta isenta de proteína para quantificação da fração endógena e determinação dos coeficientes de digestibilidade verdadeira. A digestibilidade foi estimada pelo método indireto, utilizando-se óxido crômico na concentração de 0,50% da dieta como indicador, efetuando-se a coleta de fezes em intervalos de 4 horas pela técnica de decantação. Os coeficientes de digestibilidade aparente da proteína e dos aminoácidos são: milho, 83,57 e 82,45%; farelo de trigo, 82,87 e 81,47%; farelo de soja, 91,12 e 89,41%; glúten de milho, 90,07 e 87,78%; farinha de peixe, 83,53 e 81,65%, respectivamente. Os coeficientes de digestibilidade verdadeira da proteína e a média dos aminoácidos são: milho, 90,02 e 89,60%; farelo de trigo, 89,62 e 89,14%; farelo de soja, 93,58 e 91,88%; glúten de milho, 92,50 e 90,34%; farinha de peixe, 86,01 e 84,27%, respectivamente.
Palavras-chave: fase de crescimento, ingredientes, nutrição, Oreochromis niloticus
www.sbz.org.br
Introduction
Studies on nutritional requirements and nutritional assessment of feed for fish have prioritized the study of proteins, which are the most expensive component of feed
Amino acids digestibility can be expressed as true or apparent, depending on the corrections made by the contributions of endogenous nitrogen compounds. True digestibility can be determined by the difference between the amount of amino acids in the diet and feces or digesta, considering the endogenous losses of amino acids that are subtracted from the total amount of amino acids in digesta or feces (Sakomura & Rostagno, 2007).
According to Souffrant (1991), when a diet without protein is given, nitrogen observed in digesta or feces come from the enzymes, mucins, amides, amines, bacteria and cell desquamation of the intestinal mucosa during the passage of food or chyme. According to this author, the main components of these endogenous secretions are the digestive enzymes and mucoproteins.
There are few reports on the digestibility of amino acids of Nile tilapia feed (Furuya et al., 2001) and the existing values are expressed as apparent. Moreover, there is a great variability in the results, and this variation may be related to environmental conditions, such as water temperature (Bendiksen et al., 2003) and dissolved oxygen concentration in the aquarium (Neiji et al., 1993) and methodological factors, as the time of feces collection (Allan et al., 1999), the technique of feces collection (Austreng, 1978, Windell et al., 1978) and fish size (Henken et al., 1985).
The objective of this work was to determine apparent and true digestibility coefficients of crude protein and mean amino acids of corn, wheat, soybean meal, corn gluten 60 and fish meal for Nile tilapia (Oreochromis niloticus ).
Material and Methods
The experiment was conducted from October to December 2007, in the Laboratório de Nutrição de Peixes in Departamento de Zootecnia at the Universidade Federal de Viçosa (UFV).
It was used 210 reversed tilapia (Oreochromis niloticus),
Thailand strain, weighing 310 ± 9.68 g, distributed in randomized blocks (replications in time), with five diets (treatments), each of them evaluated in six replicates with seven fish per experimental unit.
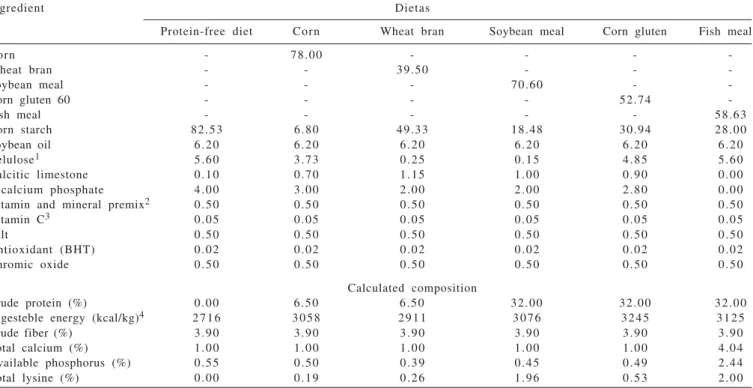
Each experimental diet was formulated with a single protein source: corn, wheat bran, soybean meal, corn gluten 60 and fish meal (Table 1). An additional group with 42 fish was fed a diet without protein for quantification of endogenous fraction and determination of true digestibility coefficients.
Diets were formulated to contain 32% of crude protein for evaluation of high protein feed (soybean meal, fish meal and corn gluten) and 6.5% of crude protein for evaluation of energy feed (corn and wheat bran).
The levels of crude fiber, calcium and phosphorus (except for fish meal), vitamins and minerals were similar for all diets. Cellulose was used so that all diets contained 3.90% of crude fiber. Furthermore, the diets contained 0.50% chromic oxide (Cr2O3), used as an indicator for determining the digestibility (Table 2).
It was used six conic shape fiberglass tanks, with a volume of 250 liters, with individual aeration systems, water supply and drainage, with water renewal of at least 25% per day.
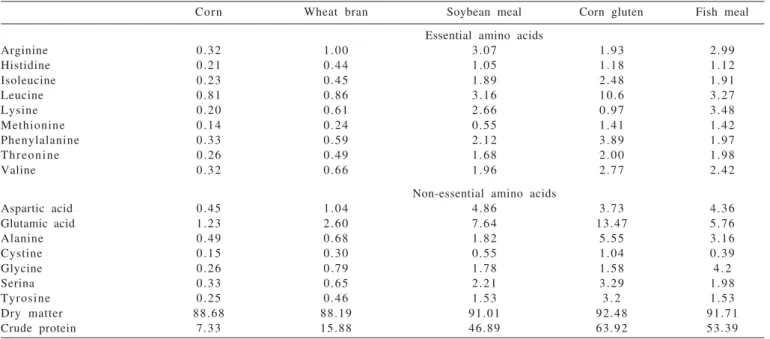
Corn Wheat bran Soybean meal Corn gluten Fish meal
Essential amino acids
Arginine 0.32 1.00 3.07 1.93 2.99
Histidine 0.21 0.44 1.05 1.18 1.12
Isoleucine 0.23 0.45 1.89 2.48 1.91
Leucine 0.81 0.86 3.16 10.6 3.27
Lysine 0.20 0.61 2.66 0.97 3.48
Methionine 0.14 0.24 0.55 1.41 1.42
Phenylalanine 0.33 0.59 2.12 3.89 1.97
Threonine 0.26 0.49 1.68 2.00 1.98
Valine 0.32 0.66 1.96 2.77 2.42
Non-essential amino acids
Aspartic acid 0.45 1.04 4.86 3.73 4.36
Glutamic acid 1.23 2.60 7.64 13.47 5.76
Alanine 0.49 0.68 1.82 5.55 3.16
Cystine 0.15 0.30 0.55 1.04 0.39
Glycine 0.26 0.79 1.78 1.58 4 . 2
Serina 0.33 0.65 2.21 3.29 1.98
Tyrosine 0.25 0.46 1.53 3 . 2 1.53
Dry matter 88.68 88.19 91.01 92.48 91.71
Crude protein 7.33 15.88 46.89 63.92 53.39
Ingredient Dietas
Protein-free diet Corn Wheat bran Soybean meal Corn gluten Fish meal
Corn - 78.00 - - -
-Wheat bran - - 39.50 - -
-Soybean meal - - - 70.60 -
-Corn gluten 60 - - - - 52.74
-Fish meal - - - 58.63
Corn starch 82.53 6.80 49.33 18.48 30.94 28.00
Soybean oil 6.20 6.20 6.20 6.20 6.20 6.20
Celulose1 5.60 3.73 0.25 0.15 4.85 5.60
Calcitic limestone 0.10 0.70 1.15 1.00 0.90 0.00
Dicalcium phosphate 4.00 3.00 2.00 2.00 2.80 0.00
Vitamin and mineral premix2 0.50 0.50 0.50 0.50 0.50 0.50
Vitamin C3 0.05 0.05 0.05 0.05 0.05 0.05
Salt 0.50 0.50 0.50 0.50 0.50 0.50
Antioxidant (BHT) 0.02 0.02 0.02 0.02 0.02 0.02
Chromic oxide 0.50 0.50 0.50 0.50 0.50 0.50
Calculated composition
Crude protein (%) 0.00 6.50 6.50 32.00 32.00 32.00
Digesteble energy (kcal/kg)4 2 7 1 6 3 0 5 8 2 9 1 1 3 0 7 6 3 2 4 5 3 1 2 5
Crude fiber (%) 3.90 3.90 3.90 3.90 3.90 3.90
Total calcium (%) 1.00 1.00 1.00 1.00 1.00 4.04
Available phosphorus (%) 0.55 0.50 0.39 0.45 0.49 2.44
Total lysine (%) 0.00 0.19 0.26 1.96 0.53 2.00
1Cellulose: crude fiber = 69.54%
2Composition per kilogram of product: vit. A – 1,200,000 IU; vit. D3 – 200,000 IU; vit. E – 1,200 mg; vit. K3 – 2,400 mg; vit. B1 – 4,800 mg; vit. B2 – 4,800 mg; vit. B6 – 4,800 mg; vit. B12 – 4,800 mg; vit. C – 48,000 mg; folic acid – 1,200 mg; panthotenic acid – 12,000 mg; biotin – 48 mg; cholin, 108,000 mg; niacin – 24,000 mg; Fe – 50,000 mg; Cu – 3,000 mg; Mn – 20,000 mg; Zn – 30,000 mg; I – 100 mg; Co – 10 mg; Se – 100 mg.
3Vitamin C: calcium salt, 2-monophosphate of ascorbic acid-42% active principle.
4Estimated values based on energy digestibility coefficients of food according to Boscolo et al. (2002) and Pezzato et al. (2002).
Table 2 - Composition of experimental diets, in percentage of fresh matter
Water temperature was measured daily at 7:30 a.m. and at 5:30 p.m., with a mercury bulb thermometer graduated from 0 to 50°C. The pH and dissolved oxygen in water were measured every two days, respectively, through a potentiometer and oximeter.
The photoperiod was maintained at 12 hours of light, using light from mixed lamps, controlled by automatic timer. Diets were pelleted and before the beginning of the experiment, a test was conducted for three days, with increasing supply amounts of experimental diets to establish the normal consumption of fish. The digestibility trial lasted eight days, three days for adaptation and five days for feces collection.
Diets were provided daily at an amount of 2% body weight of fish in all treatments, four times daily, at 9:00 a.m., 12:00 p.m., 3:00 p.m. and 6:00 p.m., divided in equal amounts. After the last feeding of the day, all tanks were cleaned and they had 50% of water renovated, to remove any diet residue that could contaminate fish feces. After that, 250 mL bottles were engaged at the aquaria bottoms to collect feces by decanting. The bottles carrying feces were immersed in a container with ice, to minimize possible effects of degradation of feces by bacterial action. Feces were collected every four hours (at 20, 0, 4 and 8 hours).
After each sampling, feces were transferred to 50-mL tubes, centrifuged at 2,296 g for 2 minutes, frozen at -70°C and then dried by lyophilization for 72 hours to avoid amino acids degradation.
Analyses of feeds, diets and levels of fecal dry matter and crude protein, and chromium concentration of diets and feces were performed at the Laboratório de Nutrição Animal in Departamento de Zootecnia (LNA/DZO) at the Universidade Federal de Viçosa - UFV, according to procedures described by Silva (2003).
Analysis of amino acids of diets, feed and feces were performed at the Ajinomoto Biolatina Ind. and Com. Laboratory, using HPLC - High Performance Liquid Chromatography. Tryptophan and proline were not quantified.
Apparent and true digestibility of protein and amino acids were determined by calculating the indigestibility factor by using the formulas described by Rostagno & Featherston (1977), as follows:
1 - Indigestibility factor (IF):
2 - Apparent crude protein digestibility coefficient (ApCPDC):
The values of amino acids endogenous excretion obtained from animals fed diets without protein were used to determine the true digestibility coefficients.
3 - Crude protein true digestibility coefficient (CPtDC):
CPtDC (%) = Diet CP - (CP feces x IF1– Cpe x IF2) × 100
Diet CP
where CPe = endogenous crude protein excreted in the feces; IF1 = indigestible factor for the tested diet; IF2 = indigestible factor for the protein free diet (PFD).
4 - Amino acids apparent digestibility coefficient (AAapDC):
5 - Amino acid true digestibility coefficient (AAtDC):
where E2 = protein free diet feces.
Results and Discussion
The water and aeration system allowed the control of temperature and aeration during the experimental period. Values of 28.0 ± 0.68ºC for water temperature, 6.5 ± 0.19 for pH and 6.1 ± 0.32 ppm for dissolved oxygen were maintained, which are within the range considered suitable for breeding of this species (El-Sayed, 2006).
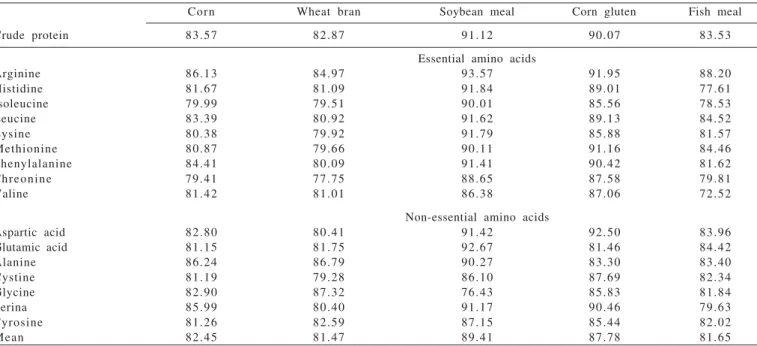
The apparent digestibility of corn crude protein (83.57%) was similar to that found for wheat bran (82.87%) (Table 3). Pezzato et al. (2002) also found similarities between the digestibility of corn and wheat bran protein fractions,
despite the divergence of the absolute values found, 91.66 and 91.13% respectively.
However, these values differ from those reported by Furuya et al. (2001), which were 87.12 and 78.21%, respectively, and these differences can be partly attributed to the crude fiber contents of experimental diets used for determining the digestibility of protein fraction, especially in diets containing soybean meal wheat. Several studies have shown that variations in dietary levels of crude fiber for fish may alter the digestibility, the rate of gastrointestinal transit and digestive tract morphology (Buhler & Halver 1961; Leary & Lovell, 1975; Lanna et al. 2004 ; Dupree & Sneed, 1966, Shiau et al., 1988). Lanna et al. (2004) observed that levels up to 5.00% of crude fiber did not influence the digestibility of dry matter and crude protein in juvenile Nile tilapia.
In this study, all diets contained 3.90% crude fiber, level considered tolerable and without significant influence on protein digestibility and transit speed of the bolus in Nile tilapia (Hilton et al. 1983 ; Pereira-Filho, 1989; Dioundick & Stom 1990; NRC, 1993; Lanna et al., 2004, Meurer et al., 2003). Apparent digestibility coefficients of amino acids in corn and wheat bran were 82.45% and 81.47%, respectively (Table 3) and, among the essential amino acids, arginine had the highest apparent digestibility coefficient, corresponding to 86.13% for corn and 84.97% for wheat bran.
The lower apparent digestibility coefficient among the essential amino acids was found for threonine of corn and wheat bran as well, whose values were 79.41 and 77.75%, respectively. The threonine low digestibility of these feeds is consistent with results from other studies (Wilson et al. 1981;
Corn Wheat bran Soybean meal Corn gluten Fish meal
Crude protein 83.57 82.87 91.12 90.07 83.53
Essential amino acids
Arginine 86.13 84.97 93.57 91.95 88.20
Histidine 81.67 81.09 91.84 89.01 77.61
Isoleucine 79.99 79.51 90.01 85.56 78.53
Leucine 83.39 80.92 91.62 89.13 84.52
Lysine 80.38 79.92 91.79 85.88 81.57
Methionine 80.87 79.66 90.11 91.16 84.46
Phenylalanine 84.41 80.09 91.41 90.42 81.62
Threonine 79.41 77.75 88.65 87.58 79.81
Valine 81.42 81.01 86.38 87.06 72.52
Non-essential amino acids
Aspartic acid 82.80 80.41 91.42 92.50 83.96
Glutamic acid 81.15 81.75 92.67 81.46 84.42
Alanine 86.24 86.79 90.27 83.30 83.40
Cystine 81.19 79.28 86.10 87.69 82.34
Glycine 82.90 87.32 76.43 85.83 81.84
Serina 85.99 80.40 91.17 90.46 79.63
Tyrosine 81.26 82.59 87.15 85.44 82.02
Mean 82.45 81.47 89.41 87.78 81.65
Gonçalves et al., 2009) and it is probably due to its high concentration in mucin of the intestinal mucosa (Fuller, 1994). Among the high protein feed, the soybean meal crude protein apparent digestibility (91.12%) was similar to corn gluten meal (90.07%) and fishmeal, whose value was lower (83.53%; Table 3). The value obtained in this study for the soybean meal was superior to that found by Köprücü & Özdemir (2005), which was 87.40% and lower than that reported by Gill et al. (2009), which was 94.13%. On the other hand, literature also reported several results close to the obtained in this study, such as 92.72%, obtained by Furuya et al. (2001); 91.56% obtained by Pezzato et al. (2002); and 89.28% obtained by Boscolo et al. (2002). For corn gluten, crude protein apparent digestibility was similar to that one obtained by Gonçalves et al. (2009), which was 89.32%, and also by Köprücü & Özdemir (2005), which was 89.00%, but it was lower than that reported by Pezzato et al. (2002), 95.96%, and by Meurer et al. (2003), 97.61%.
The differences between the apparent digestibility coefficients of this research and of other studies used for comparison can be attributed to several factors, such as the inclusion level of test ingredient, possible anti-nutritional factors or amino acid imbalance (Mukhopadhyay & Ray, 1997), the methodology used to collect feces (Sullivan & Reigh 1995), the fish line (Degani et al., 1997), the formulation and processing of feeds and ingredients (McGoogan & Reigh 1996), variety (Leterme et al., 1991) and even the soil where the beans are grown (Owsley et al., 1987).
The results found in the literature for the crude protein apparent digestibility of fish meal vary between 78.55% and 90.66% (Pezzato et al., 2002, Meurer et al., 2003). However, they are similar to those reported by Gonçalves et al. (2009) and Furuya et al. (2001), which was 82.59 and 84.95%, respectively. According to Aksnes et al. (1997), fish meal available in the market show great variation in quality, which can be attributed to the equipment type and processing conditions. In 27 samples of fish meal, Romero et al. (1994) observed variation from 84.5 to 97.0% for protein digestibility in rainbow trout. Brazilian fish meal often have low digestibility, being formulated with slaughterhouse waste, and may have high percentages of ash and protein of low quality, from bones protein matrix, skin, scales and viscera (Boscolo et al., 2004).
The mean amino acids apparent digestibility coefficient of soybean meal, corn gluten and fish meal were 89.41, 87.78 and 81.65%, respectively (Table 3).
Arginine was the essential amino acid with the highest apparent digestibility coefficient of all the high protein feed tested and had values of 93.57, 91.95 and 88.20% for soybean meal, corn gluten and fish meal, respectively. Among the essential amino acids, both in experiments with Nile tilapia
and other fish species, arginine has always the highest or the second highest apparent digestibility for soybean meal (Wilson et al., 1981; Yamamoto et al. 1998; Furuya et al. 2001; Köprücü & Özdemir, 2005; Abimorad et al., 2008), corn gluten (Yamamoto et al., 1998; Abimorad et al., 2008) and fish meal (Wilson et al., 1981, Yamamoto et al., 1998; Furuya et al., 2001; Abimorad et al., 2008).
The lowest apparent digestibility coefficients were observed for the aliphatic amino acids: valine for soybean meal (86.38%) and fish meal (72.52%) and isoleucine for the corn gluten meal (85.56%). These aliphatic amino acid also had lower apparent digestibility in various works with soybean meal (Furuya et al., 2001, Gonçalves et al., 2009), corn gluten (Yamamoto et al., 1998, Gonçalves et al. 2009; Abimorad et al., 2008) and fish meal (Yamamoto et al. 1998; Abimorad et al., 2008). One hypothesis that could explain the low digestibility is that these amino acids are usually located within the protein, due to its hydrophobic nature, hindering the hydrolysis of peptide bonds (Nissen, 1992). Although the results obtained in this study and in the literature present some similarities in the highest and the lowest essential amino acids apparent digestibility, the values have great variation even for the same feed. For example, the lysine apparent digestibility for soybean meal found in the literature ranges from 83.40 to 97.01% for the Nile tilapia (Furuya et al. 2001; Köprücü & Özdemir, 2005, Gonçalves et al., 2009), and the value found in this study was 80.38%.
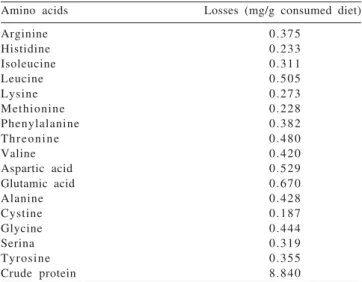
Besides the studied fish species differences, one of the factors that could explain, at least in part, the variation in the results of digestibility is the collection interval in the decantation technique. Abimorad & Carneiro (2004) observed that as collections interval increased, there was an increase in digestibility of protein in the evaluated feed, indicating a possible occurrence of small nutrient losses by leaching. In this study, to minimize losses through leaching, samples were taken at intervals of four hours, unlike most studies found in the literature, with interval of 12 hours for collection. Protein and amino acids endogenous losses values obtained in this study (Table 4) resemble those described by Yamamoto et al. (1998) for common carp (Cyprinus carpio). However, these authors observed
quantitative difference about three times larger in absolute values for all amino acids endogenous losses to red seabream (Pagrus major) in comparison with common carp (Cyprinus carpio). The red seabream (Pagrus major) is a carnivorous
species, unlike the common carp, a species of omnivorous feeding habits, such as Nile tilapia.
The species of carnivorous habits have relatively short gut compared to the omnivorous ones, which facilitates rapid emptying of the digestive tract shortly after the feed is ingested (Scorvo Ayrosa & Son, 1996). This would probably result in greater endogenous protein and amino acids loss compared to omnivores (Hendriks et al., 2002), due to higher endogenous excreted daily flow (Moter & Stein, 2004).
The values for endogenous losses obtained in this study were relatively low for methionine and cystine, which can be explained partly by the low content of sulfur amino acids, both in the mucin layer and pancreatic secretions, as compared to other amino acids (Pozza et al., 2003).
Information on feed protein fraction digestibility for Nile tilapia have been expressed as apparent values (Furuya et al., 2001; Köprücü & Özdemir, 2005) and works that offer true digestibility values were obtained with other fish species, as found by Wilson et al. (1981), for channel catfish (Ictalurus punctatus) and Yamamoto et al. (1998) for common
carp (Cyprinus carpio), rainbow trout (Oncorhynchus mykiss) and red seabream (Pagrus major). As reported by
Pozza et al. (2004), when considering the contribution of endogenous amino acids and values of true digestibility, the quantity of amino acids used by animals is more accurate, resulting in greater precision in formulation of rations for Nile tilapia.
The corn and wheat bran crude protein true digestibility were 90.02% and 89.62%, respectively (Table 5). For these feeds, CP true digestibility coefficients were not found in the literature for comparison. For amino acids true digestibility, Wilson et al. (1981) found corn and wheat bran values of 79.10 and 91.10% for the catfish-channel, respectively, which differ from the values obtained in this study, 89.60 and 89.14%, respectively.
For high protein feeds, the crude protein true digestibility coefficients of soybean meal (93.58%) and corn gluten meal (92.50%) were higher than those found by Yamamoto et al. (1998), corresponding to 92.20 and 78.10%, respectively, for common carp. The value obtained for fish meal (86.01%) was lower than that found by these authors, 90.60%. The mean amino acids true digestibility coefficients were 91.88% for soybean meal, 90.34% for corn gluten meal and 84.27% for fish meal, higher than those obtained by Wilson et al. (1981),
Amino acids Losses (mg/g consumed diet)
Arginine 0.375
Histidine 0.233
Isoleucine 0.311
Leucine 0.505
Lysine 0.273
Methionine 0.228
Phenylalanine 0.382
Threonine 0.480
Valine 0.420
Aspartic acid 0.529
Glutamic acid 0.670
Alanine 0.428
Cystine 0.187
Glycine 0.444
Serina 0.319
Tyrosine 0.355
Crude protein 8.840
Table 4 - Endogenous protein and amino acid losses caused by sedimentation technique by using protein-free diet
Corn Wheat bran Soybean meal Corn gluten Fish meal
Crude pretein 90.02 89.62 93.58 92.50 86.01
Essential amino acids
Arginine 92.61 92.28 95.47 95.06 90.43
Histidine 89.28 89.59 94.54 92.10 80.44
Isoleucine 87.67 88.10 92.25 87.88 81.04
Leucine 87.47 87.93 93.80 90.70 86.95
Lysine 91.01 87.07 93.68 90.63 83.42
Methionine 91.14 93.13 93.85 93.83 87.24
Phenylalanine 90.79 88.40 93.72 92.44 84.27
Threonine 88.23 86.62 91.31 89.46 82.54
Valine 88.71 88.57 89.00 89.67 75.13
Non-essential amino acids
Aspartic acid 89.57 86.33 93.24 94.97 86.22
Glutamic acid 83.70 84.37 94.32 82.98 86.46
Alanine 91.00 91.39 93.07 87.26 85.63
Cystine 88.35 87.60 89.45 90.62 87.58
Glycine 93.08 94.09 79.31 87.68 83.82
Serina 91.31 86.33 93.23 92.44 81.96
Tyrosine 89.61 94.46 89.79 87.64 85.24
Mean 89.60 89.14 91.88 90.34 84.27
which was 84.20% for soybean meal and 72.50% for fish meal, but lower than those obtained by Yamamoto et al. (1998), which was 92.80% for soybean meal and 91.30% for fish meal, except corn gluten meal, which was 80.80%.
Conclusions
Among the energy feed, corn and wheat bran are similar considering the crude protein and amino acids apparent and true digestibility coefficients. Soybean meal and corn gluten are the most digestible high protein feed, when considering the apparent digestibility or true digestibility of crude protein and amino acids, followed by the fishmeal. The use of true digestibility values of the ingredients tested, bearing in mind the differences found for the apparent values, will allow more appropriate and accurate diet formulation for Nile tilapia, which can improve animal performance.
Acknowledgments
To Ajinomoto Biolatina Indústria e Comércio Ltd., for performing aminograms.
References
ABIMORAD, E.G.; CARNEIRO, D.J. Métodos de coleta de fezes e determinação dos coeficientes de digestibilidade da fração protéica e da energia de alimentos para o pacu, Piaractus m e s o p o t a m i c u s (Holmberg, 1887). Revista Brasileira de Zootecnia, v.33, n.5, p.1101-1109, 2004.
ABIMORAD, E.G.; SQUASSONI, G.H.; CARNEIRO, D.J. Apparent digestility of protein, energy, and amino acids in some selected feed ingredients for pacu Piaractus mesopotamicus. Aquaculture Nutrition, v.14, p.374-380, 2008.
AKSNES, A.; IZQUIERDO, M.S.; ROBAINA, L. et al. Influence of fish meal quality and feed pellet on growth, feed efficiency and muscle composition in gilthead seabream (Sparus aurata).
Aquaculture, v.153, p.251-261, 1997.
ALLAN, G.L.; ROWLAND, S.J.; PARKINSON, S. et al. Nutrient digestibility for juvenile silver perch Bidyanus bidyanus: development of methods. Aquaculture, v.170, p.131-145, 1999.
AUSTRENG, E. Digestibility determination in fish using chromic oxide marking and analysis of content from different segments of gastro-intestinal tract. A q u a c u l t u re, v.13, p.265-272, 1 9 7 8 .
BENDIKESEN, E.A.; ARNESEN, A.M.; JOBING, M. Effects of dietary fatty acid profile and fat content on smolting and seawater performance in Atlantic salmom (Salmo salar L.).
Aquaculture, v.225, p.149-163, 2003.
BOMFIM, M.A.D.; LANNA, E.A.T.; DONZELE, J.L. et al. Redução de proteína bruta com suplementação de aminoácidos, com base no conceito de proteína ideal, em rações para alevinos de tilápia-do-nilo. Revista Brasileira de Zootecnia, v.37, p.1713-1720, 2008.
BOSCOLO, W.R.; HAYASHI, C.; MEURER, F. Digestibilidade aparente da energia e nutrientes de alimentos convencionais e
alternativos para a tilápia do Nilo (Oreochromis niloticus, L.).
Revista Brasileira de Zootecnia, v.31, n.2, p.539-545, 2002. BOSCOLO, W.R.; HAYASHI, C.; MEURER, F. et al. Digestibilidade aparente da energia e proteína das farinhas de resíduos da filetagem da tilápia do Nilo (Oreochromis niloticus) e da corvina (Plagioscion squamosissimus) e farinha integral do camarão canela (Macrobrachium amazonicum) para a tilápia do Nilo.
Revista Brasileira de Zootecnia, v.33, n.1, p.8-13, 2004. BUHLER, D.R.; HALVER, J.E. Nutrition of salmoid fishes. IX.
Carboidrate requeriments of Chinook salmon. Journal of Nutrition, v.74, p.305-318, 1961.
DEGANI, G.; VIOLA, S.; YEHUDA, Y. Apparent digestibility coefficient of protein sources for carp (Cyprinus carpio L).
Aquaculture Research, v.28, n.1, p.23-28, 1997.
DIOUNDICK, O.B.; STOM, D. Effects of dietary alfa cellulose on the juvenile tilapia, Oreochromis mossambicus (Peters).
Aquaculture, v.91, n.3/4, p.311-315, 1990.
DUPREE, H.K.; SNEED, K.E. Response of channel catfish fingerlings todifferent levels of major nutrients in purified diets. Washington, D.C.: Bureau of Sport Fisheres and Wildlife U. S. Dept. Int., 1966. 21p. (Technical Paper, 9). EL-SAYED, A.-F.M. Tilapia culture. Wallingford: CABI Publishing,
2006. p.139-159.
FULLER, M.F. Amino acids requirements for mantenance, body protein accretion and reproduction in pigs. In: D´MELLO, J.P.F (Ed.). Amino acids in farm animal nutrition. Edinburgh: The Scottish Agricultural College, 1994. p.155-184.
FURUYA, W.M.; HAYASHI, C.; FURUYA, V.R.B. et al. Exigência de proteína para alevino revertido de tilápia do Nilo (Oreochromis niloticus). Revista Brasileira de Zootecnia, v.26, n.6, p.1912-1917, 2000 (supl. 1).
FURUYA, W.N.; PEZZATO, L.E.; PEZZATO, A.C. et al. Coeficientes de digestibilidade e valores de aminoácidos digestíveis de alguns ingredientes para tilápia do Nilo (Oreochromis niloticus). Revista Brasileira de Zootecnia,
v.30, n.4, p.1143-1149, 2001.
FURUYA, W.M.; BOTARO, D.; MACEDO, R.M.G. et al. Aplicação do conceito de proteína ideal para redução dos níveis de proteína em dietas para tilápia-do-Nilo (O r e o c h r o m i s n i l o t i c u s). R e v i s t a B r a s i l e i r a d e Z o o t e c n i a, v.34, n.5, p.1433-1441, 2005.
GONÇALVES, G.S.; PEZZATO, L.E.; BARROS, M.M. et al. Energia e nutrientes digestíveis de alimentos para a tilápia do Nilo. Boletim do Instituto de Pesca, v.35, n.2, p.201-213, 2 0 0 9 .
HENDRIKS, W.H.; SRITHARAN, K.; HODGKINSON, S.M. Comparison of the endogenous ileal and faecal amino acid excretion in the dog (Canis familiaris) and the rat (Rattus rattus) determined under protein-free feeding and peptide
alimentation. Journal of Animal Physiology and Animal Nutrition, v.86, p.333-341, 2002.
HENKEN, A.M.; KLEIGELD, D.W.; TILSSEN, P.A.T. The effect of feeding level on apparent digestibility of dietary dry matter, crude protein and gross energy in the African catfish, Clarias gariepinus. Aquaculture, v.51, p.1-12, 1985.
HILTON, J.W.; ATKINSON, J.L.; SLINGER, S.J. Effect of increased dietary fiber on the growth of raimbow trout (Salmo gairdinerri).
Canadian Journal of Fisheries and Aquatic Sciences, v.40, p.81-85, 1983.
KÖPRÜCÜ, K.; ÖZDEMIR, Y. Apparent di-gestibility of selected feed ingredients for Nile tilapia (Oreochromis niloticus).
Aquaculture, v.250, p.308-316, 2005.
KUBITZA, F. Tilápia: tecnologia e planejamento na produção comercial. Jundiaí: F. Kubitza, 2000. 285p.
LANNA, E.A.T.; PEZZATO, L.E.; CECON, P.R. et al. Digestibilidade aparente e trânsito gastrintestinal em tilápia do Nilo (Oreochromis niloticus), em função da fibra bruta da dieta.
LEARY, D.F.; LOVELL, R.T. Value of fiber in production-type diets for cannel catfish. Tr a n s a c t i o n s o f t h e A m e r i c a n Fisheries Society, v.2, p.328-332, 1975.
LETERME, P.; TAHON, F.; THEWIS, A. Nutritive value of triticale cultivars in pigs as function of their chemical composition.
Animal Feed Science and Technology, v.35, n.1, p.49-53, 1 9 9 1 .
MCGOOGAN, B.B.; REIGH, R.C. Apparent digestibility of selected ingredients in red drum (Sciaenops ocellatus) diets. Aquaculture, v.141, p.233-244, 1996.
MCLEAN, E.; ROENSHOLDT, B.; STEN, C. et al. Gastrointestinal delivery of peptide and protein drugs to aquacultured teleosts.
Aquaculture, v.177, p.231-247, 1999.
MEURER, F.; HAYASHI, C.; BOSCOLO, W.R. Fibra bruta para alevinos de tilápia do Nilo (O r e o c h r o m i s n i l o t i c u s, L).
R e v i s t a B r a s i l e i r a d e Z o o t e c n i a, v.32, n.2, p.256-261,
2 0 0 3 .
MEURER, F.; HAYASHI, C.; BOSCOLO, W.R. Digestibilidade aparente de alguns alimentos protéicos pela Tilápia do Nilo (Oreochromis niloticus). Revista Brasileira de Zootecnia, v.32, n.6, p.1801-1809, 2003 (supl. 2).
MOTER, V.; STEIN, H.H. Effect of feed intake on endogenous losses and amino acid and energy digestibility by growing pigs. Journal of Animal Science, v.82, p.3518-3525, 2004. M U K H O PA D H YAY, N . ; R AY, A . K . T h e a p p a r e n t t o t a l a n d nutrient digestibility of sal seed (Shorea robusta) meal in rohu, Labeo rohita (H a m i l t o n), fingerlings. A q u a c u l t u re R e s e a rc h, v.28, p.683-689, 1997.
NATIONAL RESEARCH COUNCIL - NRC. Nutrient requirements of fish. Washington, D.C.: National Academy of Sciences, 1993. 102p.
N E I J I , H . ; N A I M I , N . ; L A L L I E R , R . e t a l . R e l a t i o n s h i p s between feeding, hypoxia, digestibility and experiment furunculosis in rainbow trout. Paris: INRA, 1993. p.186-197. (Les Colloques, 61).
N I S S E N , S . M o d e r n m e t h o d s i n p r o t e i n n u t r i t i o n a n d metabolism. New York: Academic Press, 1992. 345p. OWSLEY, W.F.; HAYDON, K.D.; LEE, R.D. Effect of variety
and planting location on the value of triticale for swine.
J o u r n a l o f A n i m a l S c i e n c e, v.65, n.1, p.37, 1987. PEREIRA-FILHO, M. Efeito de diferentes níveis de proteína
e d e f i b r a n o d e s e m p e n h o , d i g e s t i b i l i d a d e d a f r a ç ã o protéica e características da carcaça de carpa (Cyprinus carpio L. 1758). 1989. 96f. Tese (Doutorado em Aqüicultura) -Universidade Estadual de São Paulo, Jaboticabal.
P E Z Z ATO , L . E . ; M I R A N D A , E . D . ; B A R R O S , M . M . e t a l . Digestibilidade aparente de ingredientes pela tilápia do Nilo (Oreochromis niloticus). Revista Brasileira de Zootecnia, v.31, n.4, p.1595-1604, 2002.
POZZA, P.C.; GOMES, P.C.; ROSTAGNO, H.S. et al. Avaliação da perda endógena de aminoácido; em função de diferentes níveis de fibra para suíno. Revista Brasileira de Zootecnia, v.32, n.6, p.1354-1361, 2003.
POZZA, P.C.; GOMES, P.C.; DONZELE, J. L. et al. Digestibilidade ileal aparente e verdadeira de aminoácidos de farinhas de carne e ossos para suínos. Revista Brasileira de Zootecnia, v.33, n.5, p.1181-1191, 2004.
ROMERO, J.J.; CASTRO, E.; DÍAZ, A.M. et al. Evaluation of methods to certify the “premium” quality of Chilean fish meals.
Aquaculture, v.124, n.1-4, p.351-358, 1994.
ROSTAGNO, H.S.; FEATHERSTON, W.R. Estudos de métodos para determinação de disponibilidade de aminoácidos. Revista Brasileira de Zootecnia, v.6, n.1, p.64-75, 1977.
SAKOMURA, N.K.; ROSTAGNO, H.S. Métodos de pesquisa em nutrição de monogástricos. Jaboticabal: FUNEP, 2007. 283p. SCORVO FILHO, J.D; AYROSA, L.M.S. São Paulo: a situação da
piscicultura no estado. Panorama da Aqüicultura, v.6, p.18-19, 1996.
SHIAU, S.Y.; YU, H.L.; HWA, S. et al. The influence of carboxymethycellulose on growth, digestion, gastric emptying time and body composition of tilapia. Aquaculture, v.70, p.345-354, 1988.
SILVA, D.J.; QUEIROZ, A.C. Análise de alimentos (métodos químicos e biológicos).3.ed. Viçosa, MG: Universidade Federal de Viçosa, 2002. 235p.
SOUFFRANT, W.B. Endogenous nitrogen losses during digestion in pigs. In: DIGESTIVE PHYSIOLOGY IN PIGS, 5., 1991, Wageningen.
Proceedings… Wageningen: Pudoc, 1991. p.147-166.
SUGIURA, S.H.; GABAUDAN, J.; DONG, F.M. et al. Dietary microbial phytase supplementation and utilization of phosphorus, trace minerals and protein by rainbow trout
Oncorhynchus mykiss (Walbaum) fed soybean meal-based diets.
Aquaculture Research, v.32, p.583-592, 2001.
SULLIVAN, J.A.; REIGH, R.C. Apparent digestibility of selected feedstuffs in diets for hybrid striped bass (Morene saxatilis x
Morene chrysops). Aquaculture, v.138, p.313-322, 1995. YAMAMOTO, T.; AKIMOTO, A.; KISHI, S. et al. Apparent and
true availabilities of amino acids from several protein sources for fingerling rainbow trout, common carp, and red sea bream.
Fisheries Science, v.64, n.3, p.448-458, 1998.