diverging and converging bifurcation
Vladimir Leble, Rui Lima, Ricardo Dias, Carla Fernandes, Takuji Ishikawa et al.
Citation: Biomicrofluidics 5, 044120 (2011); doi: 10.1063/1.3672689
View online: http://dx.doi.org/10.1063/1.3672689
View Table of Contents: http://bmf.aip.org/resource/1/BIOMGB/v5/i4
Published by the American Institute of Physics.
Related Articles
Growth propagation of yeast in linear arrays of microfluidic chambers over many generations Biomicrofluidics 5, 044118 (2011)
Making human enamel and dentin surfaces superwetting for enhanced adhesion Appl. Phys. Lett. 99, 193703 (2011)
Synchronization of period-doubling oscillations in vascular coupled nephrons Chaos 21, 033128 (2011)
The effects of inhomogeneous boundary dilution on the coating flow of an anti-HIV microbicide vehicle Phys. Fluids 23, 093101 (2011)
A microdevice for the creation of patent, three-dimensional endothelial cell-based microcirculatory networks Biomicrofluidics 5, 034115 (2011)
Additional information on Biomicrofluidics
Journal Homepage: http://bmf.aip.org/
Journal Information: http://bmf.aip.org/about/about_the_journal
Top downloads: http://bmf.aip.org/features/most_downloaded
In microcirculation, red blood cells (RBCs) flowing through bifurcations may deform considerably due to combination of different phenomena that happen at the micro-scale level, such as: attraction effect, high shear, and extensional stress, all of which may influence the rheological properties and flow behavior of blood. Thus, it is important to investigate in detail the behavior of blood flow occurring at both bifurcations and confluences. In the present paper, by using a micro-PTV system, we investigated the variations of velocity profiles of two working fluids flowing through diverging and converging bifurcations, human red blood cells suspended in dextran 40 with about 14% of hematocrit level (14 Hct) and pure water seeded with fluorescent trace particles. All the measurements were performed in the center plane of rectangular microchannels using a constant flow rate of about 3.010 12 m3/s. Moreover, the experimental data was compared with numerical results obtained for Newtonian incompressible fluid. The behavior of RBCs was asymmetric at the divergent and convergent side of the geometry, whereas the velocities of tracer particles suspended in pure water were symmetric and well described by numerical simulation. The formation of a red cell-depleted zone immediately downstream of the apex of the converging bifurcation was observed and its effect on velocity profiles of RBCs flow has been investigated. Conversely, a cell-depleted region was not formed around the apex of the diverging bifurcation and as a result the adhesion of RBCs to the wall surface was enhanced in this region.VC 2011 American Institute of Physics. [doi:10.1063/1.3672689]
I. INTRODUCTION
Human blood is a multiphase biofluid composed primarily of the deformable red blood cells (RBCs) suspended in plasma. Because of the complex structure of RBCs and their response to both shear and extensional flow, blood exhibits unique flow characteristics on the micro-scale level. Hence, over the yearsin vitro blood studies in glass microchannels have been extensively performed in order to obtain a comprehensive characterization of blood rheology and its flow dynamics.1–5 Most of the past studies have revealed various physiologically significant phenom-ena such as the Fahraeus and the Fahraeus-Lindqvist effect. The majority of these studies were performed in straight glass microchannels.1,3,6–8 Some examples are the pioneer studies per-formed by Fahraeus and Fahraeus-Lindqvist9 where they first reported that for narrow tubes (diameter<300 lm) the apparent viscosity of blood declines with decreasing diameter. More
recently, due to the developments in microscopy, computers, and image analysis techniques, sev-eral researchers have used new measuring methods to obtain deeper quantitative understanding of
a)Electronic mail: wlodek29@gmail.com.
the blood flow dynamics in bothin vitro6–8,10–16 andin vivoexperiments.17–20However, the ma-jority of these studies relied predominantly on the data collected in simple geometries. Few he-modynamic studies, such as the work of Nakano et al.,21 Barber et al.,22 Yang et al.,23 and Doyeux et al.,24 were performed in bifurcations composed of capillary-sized vessels. Far less work has been published on the blood flow through bifurcations with dimensions comparable to arteriole-sized vessels. The present study used state-of-the-art microvisualization and image analy-sis techniques to obtain quantitative understanding of the flow behavior of RBCs in both diverg-ing and convergdiverg-ing bifurcations with dimensions geometrically similar to arterioles.
Important studies in biomicrofluidics devoted to blood rheology and its flow dynamics in microchannels, which have played a key role in several recent developments of lab-on-chip devi-ces for blood sampling, analysis, and cell culturing.2,16,25–27 Due to its particulate nature blood exhibits unique flow dynamics at a micro-scale level. Hence, there is an increasing interest by both the microfluidic and biomedical communities to develop blood diagnostic devices as an al-ternative tool to the traditional diagnostic strategies. The flow properties of blood suspensions in a capillary wetting system have been investigated by Zhou and Chang,28,29in order to develop an efficient microneedle that allows the loading of microliters of blood samples. Other researchers, such as Shevkoplyas et al.,30,31 Yang et al.,23 and Faivre et al.2 took advantage of the natural flow properties of blood in microcirculation, such as plasma skimming, leukocyte margination, the bifurcation law, and cell-free layer enhancement by an abrupt constriction, to design micro-fluidic devices to separate plasma and leukocytes from the whole blood. Although the develop-ment of blood-on-a-chip devices has contributed to a better understanding of the mechanical behavior of blood cells in microcirculation, to our knowledge quantitative measurements of ve-locity profiles of RBCs flowing in an arteriole-sized bifurcations have never been performed.
A microvascular network consists of short irregular vessel segments which are linked by numerous diverging and converging bifurcations. Although the phenomena of blood flow in mi-crovascular networks have been studied for many years, it still remains incompletely under-stood.1For instance, the blood flow behavior in bifurcations presents difficulties in analysis, as it comprises the motion of extremely deformable cells in geometrically complex regions. Red blood cells flowing through divergent and convergent bifurcations may deform considerably due to the high shear and extensional stress around the inner wall of the bifurcation and conflu-ence, which may influence the rheological properties and flow behavior of blood. Thus, it is im-portant to investigate in detail the behavior of blood flow occurring at both bifurcations and confluences.
The complexity of controlling and obtaining detailed measurements of the blood flow behavior throughin vivomicrovascular systems21 has led toin vitrostudies being performed by using polydimethylsiloxane (PDMS) microchannels obtained by means of a soft-lithography technique.30–33 Very recently, we have studied the asymmetry of blood flow in a microchannel with a symmetric bifurcation and confluence.32 Although the results from this study have pro-vided evidence about the difference of the flow field between both geometries, this work did not discuss the velocity profiles in detail. In the present paper, by using a confocal micro-PTV (Particle Tracking Velocimetry) system we examined the variations in the velocity profile of both pure water and in vitroblood through a diverging and converging bifurcations. Moreover, the experimental data were compared with the results of numerical simulation. The results obtained in this work show that the existence of a pronounced cell-free layer in the vicinity of the confluence apex, and the consequent cross streamline migration allows the RBCs to flow with higher velocities. This new finding may play an important role in further understanding of the blood flow behavior and its impact on mass transport processes in microcirculation.
II. MATERIALS AND METHODS
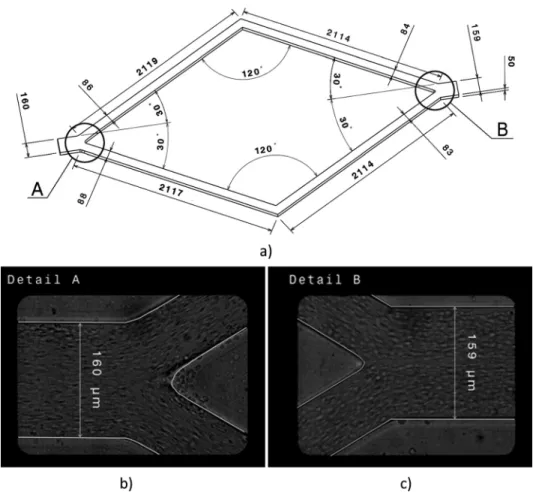
A. Microchannel geometry
simulation. The channel between inlet and first bifurcation is not depicted, though it was chosen to be almost 4 cm long to ensure a fully developed flow.
B. Experimental set-up and working fluids
The confocal PTV system used in the present study consists of an inverted micro-scope (IX71, Olympus, Japan) combined with a confocal scanning unit (CSU22, Yokogawa, Ja-pan) and a diode-pumped solid state (DPSS) laser (Laser Quantum Ltd., England) with an exci-tation wavelength of 532 nm and a high-speed camera (Phantom v7.1). By using a soft-lithography technique, we were able to manufacture a PDMS microchannel consisting of a bifurcation and confluence (see Figure 1(a)). The PDMS microchannel was placed on the stage of the microscope where the flow rate of two working fluids was kept constant by means of a syringe pump (KD Scientific, Inc.). The two working fluids used in this study were pure water seeded with 1 lm in diameter fluorescent particles and dextran 40 (Dx40) containing about 14% (14 Hct) of human red blood cells (see TableIfor more details). The blood was collected from a healthy adult volunteer, where ethylenediaminetetraacetic acid (EDTA) was added to prevent coagulation. The RBCs were separated from the bulk blood by centrifugation and aspi-ration and then washed twice with physiological saline (PS). The washed RBCs were labeled with a fluorescent cell tracker (CM-Dil, C-7000, and Molecular Probes) and then diluted with Dx40 to make up the required RBCs concentration by volume. All blood samples were stored hermetically at 4C until the experiment was performed at controlled temperature of about
37C. Detailed information about the experimental set-up, microchannel fabrication and RBC
labeling used in the present study has already been described previously.10,11,14,33 All
procedures were carried out in compliance with the guidelines of the Clinical Investigation Ethics Committee at Tohoku University.
C. Image analysis
All the confocal images were recorded around the middle of the microchannels, using a piezo driver system and RT3Dsoftware from the Yokogawa Corporation. The series of x-y
con-focal images were captured with a resolution of 640480 pixels, at a rate of 100 frames/s with an exposure time of 9.4 ms. The recorded images were transferred to the computer and then evaluated in the image processing programIMAGEJ(NIH) (Ref.34) by using the manual tracking
MtrackJ plugin35 and automatic ParticleTracker 2D plugin36 to detect and track particles in pure water and RBCs in Dx40, respectively.
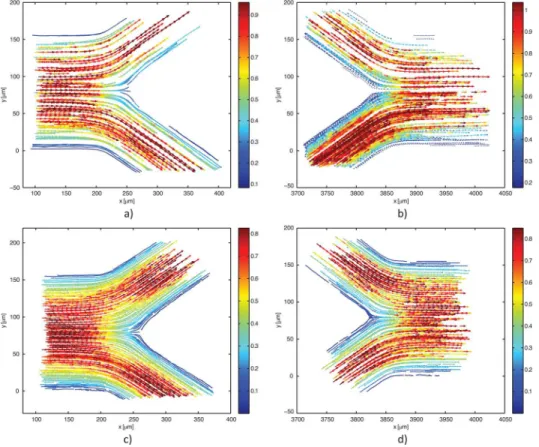
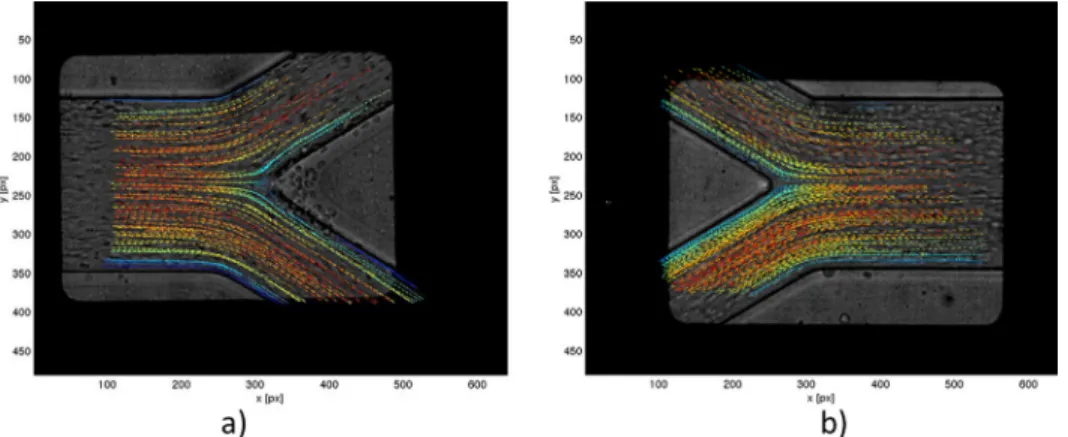
In all, 21 videos of labeled RBCs flow were analyzed, where each video consists of approximately 200 frames. Due to the difference in video quality, different settings for cell tracking were used in ParticleTracker plugin for each video. After evaluation, all trajectories were checked manually to increase accuracy and remove incorrect detections and linking. Only obviously spurious detections were removed, so no bias error was introduced by the user. The whole velocity field acquired for RBCs is shown in Figures2(a)and2(b).
The density of fluorescent particles in pure water was higher comparing to labeled RBCs; hence, manual MtrackJ plugin was used instead of automatic ParticleTracker. Because of close surrounding of neighboring particles, different settings had to be used for each particle to track. The snap feature was always the same: a bright centroid. However, snap range varied between 77 and 1313 pixel. The complete velocity field obtained for pure water using the above-described technique is presented in Figures2(c)and2(d).
Afterwards, MATLAB script was implemented in order to obtain the velocity fields shown in
Figure2. Both PTV fields and numerical results were put together into a global system of coor-dinates using a reference point, which is the tip of an apex of the bifurcation or the confluence, depending on the area of study. Another MATLAB script was written to rotate fields
simultane-ously and produce velocity profiles in 22 selected planes, described in Sec.IV.
III. NUMERICAL SIMULATIONS
The numerical calculations for the laminar isothermal flow of water were performed using the finite-element computational fluid dynamics (CFD) program POLYFLOWV
R
. The simulations
TABLE I. Experimental parameters for the working fluids used in this study.
Experimental parameter Pure water in vitroblood
Heightwidthlength of the microchannel before bifurcation
16061lm5061lm40mm 16061lm5061lm40mm
Flow rate 3.010 12m3/s 3.310 12m3/s
Mean velocity in the inlet channel 0.38 mm/s 0.41 mm/s
Particle/RBC diameter at rest 1lm 8lm
Particle/RBC concentration 0.1% 14%
Dextran 40 concentration — 9%
Viscosity of the suspending fluid 7.110 4Pas 4.510 3Pas
Temperature 37C 37C
Magnification (M) 32 32
Numerical aperture (NA) 0.75 0.75
kexexcitation wavelength 532 nm 532 nm
Refractive index of PDMS (n) 1.4 1.4
Optical slice thickness (OST)a 6.94lm 6.94lm
Capture image rate 100 frames/s 100 frames/s
a
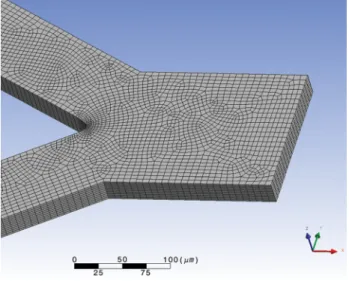
were carried out in a 3D geometry representing the microchannel described in Sec. II A (see Figure 1), and the mesh used in the simulations was mainly constituted by quadrilateral ele-ments (see Figure3).
The equations solved were the conservation of mass and momentum equations for laminar incompressible flow of water. In order to evaluate the convergence of this process, a test based on the relative error in the velocity field was performed. For the velocity field, the modification on each node between two consecutive iterations is compared to the value of the velocity at the current iteration. In the present work, the convergence value was set to 10 4, since this value is appropriate for the studied problem.37–40
The boundary conditions were established in order to reproduce the experimental condi-tions—a constant flow rate was imposed in the inlet of the microchannel –3.010 12 m3/s— and no-slip at the walls of the channel was assumed.
The numerical model designed for the present study—computational domain, mesh, and boundary conditions—was validated by the comparison of the numerical and analytical velocity profiles for a fully developed flow in a straight rectangular channel for a Newtonian fluid.41 The fully developed flow was obtained on a length of 50 lm from the entrance and in this region numerical and analytical solutions were compared as shown in Figure 4. Average differ-ence between both solutions is 0.83%.
IV. RESULTS AND DISCUSSION
The velocity profiles were analyzed in the regions shown in Figure 5, whereas Figure6is displaying the velocity field of RBCs superimposed on the real geometry of the bifurcations. Figures 7–12 show comparison between numerical simulations for water and PTV measure-ments for pure water and RBCs.
An important note has to be made about Figures8and11 (planes 6-8 and 17-19 in Figure
5, accordingly), i.e., the right side of the graphs represents regions closer to the apex of the bifurcation, while the left side represents regions closer to the external wall of the whole geom-etry. The opposite happens for Figures 9and 12 (planes 9–11 and 20–22 in Figure5, accord-ingly), where the left side of the graphs represents regions closer to the apex and the right side regions closer to the external wall. To help with analysis of the graphs, names of the regions were added to the figures on appropriate side and apply to all graphs in the same figure. In addition, a sketch of the geometry with selected planes is shown in the right, upper corner of the figures.
Measurements were done with slightly different flow rates: Q3.310 12m3/s for RBCs and Q3.010 12 m3/s for trace particles; and different Reynolds numbers (Re): Re0.007 for RBCs and Re0.04 for trace particles in water. The Reynolds number was calculated as 4qQ/(lP), where q and l are, respectively, the density and the viscosity of the suspending fluid, Q is the volumetric flow rate, and P is the wetted perimeter.
FIG. 4. Comparison between simulation of Newtonian fluid and analytical solution for fully developed flow in a straight, rectangular channel.
The comparison between the velocity profiles for RBCs and trace particles was performed using a normalized velocity (U/Umean), where Umean is calculated as flow rate/cross-section
area. It is known41 that for steady, laminar flow of Newtonian, incompressible fluid through a rectangular channel, normalized velocity does not depend on viscosity, density, or pressure drop. Therefore, changing flow rate, either to achieve the same flow rates or Reynolds numbers will not have an influence on the presented results.
A. Diverging bifurcation
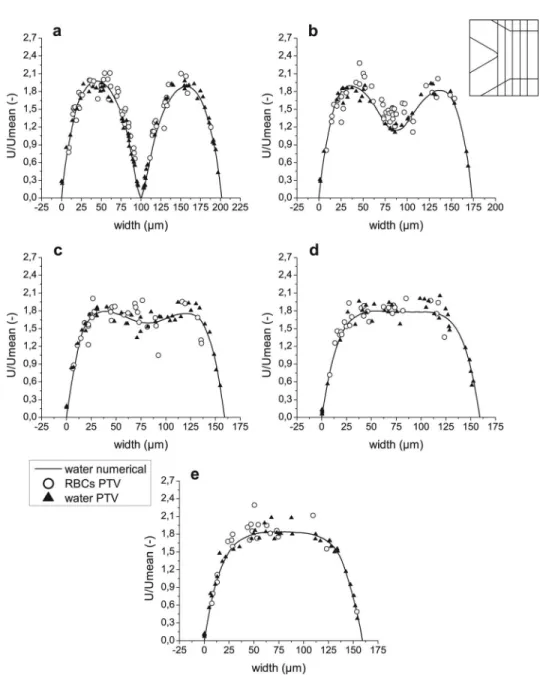
As displayed in Figure 7, one stream approaching the bifurcation divides and produces two peaks in the velocity profile. Afterwards, two flows propagate separately in daughter vessels of the bifurcation, and a fully developed flow is progressively obtained. This trend is well shown by both experimental measurements and numerical results (see Figures7–9). It is possible to observe that the experimental results for water are in a good agreement with numerical simulation. Those measurements which are closer to the walls are more accurate, as fluorescent particles were mov-ing slowly and durmov-ing the exposure time they preserved rounded shape captured on the images, and therefore facilitated the localization of the particles’ centroid. In the central region of the channels, during the same exposure time, particles moved for a larger distance, which resulted in the elliptical shape captured on the videos. That, combined with irregular illumination, is the main reason for higher uncertainties and discrepancies between simulation and measurements away from the walls. However, general scattering around the numerical curves is clearly observed.
The lack of measurements on the left side of graphs (Figs.7dand7(e)) and (Figs.8(b)and
8(c)) is caused by different camera positions during the experimental measurements of RBCs
FIG. 5. Real geometry and part of geometry used in simulations. Lines represent the planes where velocity profiles were collected and analyzed.
and fluorescent particles. Therefore, the lower daughter vessel is shorter on the images captured for trace particles in pure water. The explanation becomes clearer by comparison of Figures
2(a)and2(c).
The same trend of accuracy applies for PTV measurements of RBCs, though uncertainty of RBCs velocities is higher because of the nonuniformity of laser illumination and movements in z direction (out of focus plane) due to interactions with neighboring cells. This cause RBCs to lose brightness, partially lose brightness or in the worst case partially disappear and thus decrease accuracy. Hence, velocities obtained for RBCs are more scattered. However, general agreement with numerical simulation and PTV measurements of fluorescent particles is visible. The RBCs appear to flow slower in the central region of the main channel just before the apex, but after this, in daughter vessels, agreement is more evident. Measurements for upper daughter vessel are too scarce to determine tendency, however, since flow should propagate symmetri-cally in both daughter vessels, we may conclude an agreement for both of them based on the lower one.
FIG. 8. Velocity profiles for both computational and experimental results after bifurcation in regions 6–8 ((a)–(c), respectively).
Increase of local hematocrit (Hct) around the tip of the apex of the bifurcation enhances the adhesion of the RBCs to the wall surface. Lower RBCs velocities and RBCs that follow stream lines that end up on the apex of the bifurcation also play an important role in this phenomenon. Attached RBCs can be seen in Figures 5(a), 6(a), and 13(a). During experimental procedure all attached RBCs were rejected, therefore in the center of plane 5 (Figure 7(e)) no moving RBCs may be observed. Yet, fluorescent particles in pure water can easily access this region. Further-more, no attachments of fluorescent particles were observed during the experiments.
B. Converging bifurcation (confluence)
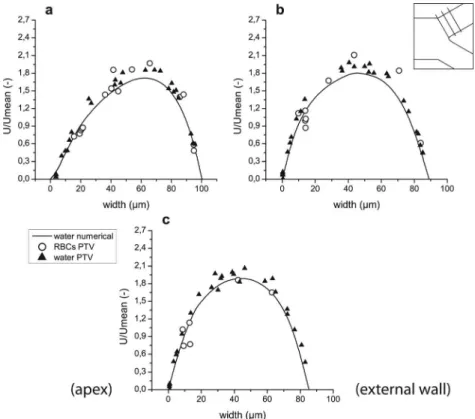
Conversely to bifurcation, Figure 10 shows how two streams enter the confluence and merge together producing two peaks in the velocity profile. Next, along the straight rectangular channel, fully developed flow is progressively obtained. Both measurements and simulation
FIG. 12. Velocity profiles for both computational and experimental results before confluence in regions 20–22 ((a)–(c), respectively).
results confirm this tendency. An agreement between experimental results for trace particles in pure water and numerical simulations may also be observed.
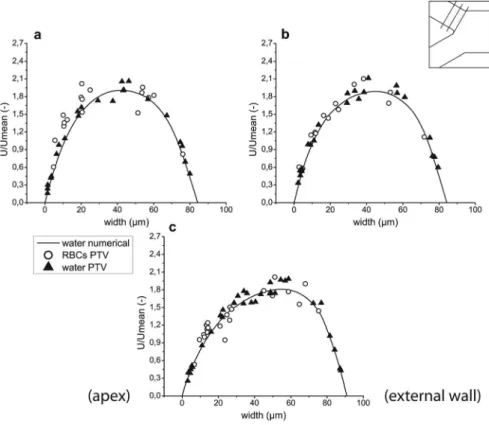
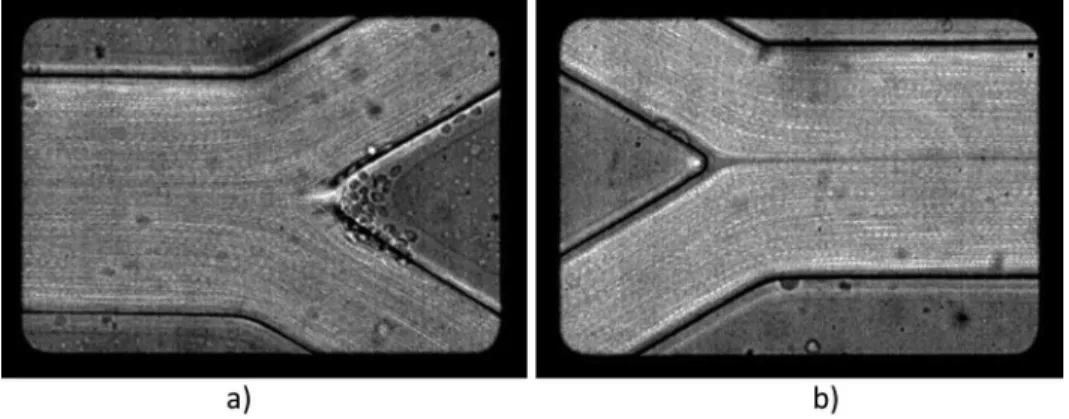
The trend of accuracy is the same as described in Subsection IV A and results obtained from PTV measurements of fluorescent particles are distributed around numerical curves. De-spite some scattering of the collected data for RBCs, it can be clearly seen that in the central region, close to the apex, the velocities of RBCs are higher than those obtained for pure water, see Figures10(b)and10(c). The cell-free layer created around the tip of the apex of the conflu-ence may be seen in Figure 6(b) but is much better visible in Figure 13(b). The existence of this cell-free region explains the lack of RBCs in the center of plane 12, see Figures5(b) and
10(a). However, fluorescent particles in pure water can easily access this area.
In Figures11 and12, one can see that velocities of the RBCs are in agreement with those of the fluorescent particles. Though Figures 11(b) and12(a) show slightly higher velocities of RBCs near the apex of the confluence, data scattering does not allow the conclusion of this tendency. These results show that existence of a cell-free layer is not sufficient to induce higher velocities of RBCs. Therefore, phenomena underlying this effect in the region downstream of the apex are more complex. Further discussion is provided in SubsectionIV C.
C. Comparison
One video for each diverging bifurcation and confluence was treated by “Z Project” function, which is implemented inIMAGEJsoftware. Consecutive frames were added to each other using
max-imum intensity and displayed in Figure 13. The existence of a cell-free layer around the apex of
FIG. 13. Images of the diverging bifurcation and confluence obtained after “Z Project” using maximum intensity function.
particles in the vicinity of the tip of the converging bifurcation as shown in Figure 15. The behavior of particles differ from that of RBCs, which, in the daughter branches, start from the same lateral position as fluorescent particles but have tendency to go closer to the apex. This different behavior may be explained by the diffusion of RBCs to the cell depleted region located after the tip of the apex. As a result, the RBCs undergo a cross streamline migration along the apex of the confluence. Hence, RBCs flowing close to the confluence center line are originated from streamlines contiguous to the interface of the cell depleted layer.
In the case of trace particles, there is no depleted region but rather an homogeneous distri-bution of particles and as a result they do not exhibit cross streamline migration. Thus, particles that flow close to the center line of the confluence are originated from streamlines adjacent to the apex wall.
The different initial position of both objects in the shear flow indicates different initial velocities. Consequently, the RBCs that undergo cross streamline migration and eventually end up on the same streamline as trace particles, exhibit higher velocities upstream of the apex than those particles. Therefore, velocities of RBCs just downstream of the apex close to the conflu-ence center line are also higher than fluorescent particles (see Figures10(b) and10(c)).
In order to obtain a deeper understanding of our finding, we are planning in the near future to use a working fluid containing both fluorescent particles and labeled RBCs and also to
perform numerical simulations with a multi-scale model. Different Hct levels and flow rates would influence the width of the cell-depleted regions, especially the width and length after converging tip. Additionally, the geometry of the microchannel, such as the length and width of the daughter branches, will also have a strong impact on the development of the depleted regions and consequently change the shape of the cell-free layer (CFL) after the confluence. Therefore, using different Hcts, flow rates and geometrical constraints would help to clarify the observed phenomenon. This research work is under way in our laboratory, and it will be pub-lished in due time.
V. CONCLUSIONS
In the present paper, we reported experiments on the flow of red blood cells in geometri-cally symmetrical divergent and convergent bifurcations. Comparing the results obtained in both bifurcations we have found that RBCs velocities are asymmetrical. The formation of a pro-nounced cell-depleted zone immediately downstream of the apex of the convergent bifurcation (which is absent in the divergent side) causes this asymmetry.
The geometry of the diverging bifurcation and the confluence was found from visualization images with visible walls. Afterwards, a 3D model was produced, and simulations of pure water were performed with a finite-element CFD program POLYFLOW. Simulations’ outcome was used
to validate measurements of fluorescent particles and as a reference to compare the RBCs velocities obtained by PTV method. The results acquired for pure water and numerical results were found to be in a good agreement with each other. However, velocities of RBCs were found to be different when they approach the tip of the apex of the converging bifurcation or enter the main channel just downstream of the confluence apex. RBCs tend to move slower in the region before the tip of the divergent bifurcation and faster after the tip of the confluence, in comparison to fluorescent particles in water and to each other.
The development of a cell depleted zone around the apex of convergent bifurcation influen-ces the final streamline that RBCs would follow and play an important role on higher velocities obtained from our experimental measurements.
On the other hand, lower velocities close to the apex of the divergent bifurcation, as well as enhanced adhesion of RBCs to the wall surface, may be partially explained by local increase of Hct in this region.
In the future works, we are planning to further investigate the behavior of RBCs in bifurca-tions and define physical parameters that influence these phenomena. This will help to clarify the effect of the cell-free layer on RBCs velocities and trajectories. We also believe that the new findings provided by the present study will help the development of more realistic multi-phase numerical models of blood flow through microchannels of size 50-500lm.
ACKNOWLEDGMENTS
The authors acknowledge the financial support provided by: 2007 GlobalCOE Program, Japan; PTDC/SAU-BEB/108728/2008, PTDC/SAU-BEB/105650/2008, and PTDC/EME-MFE/099109/ 2008 from the FCT (Science and Technology Foundation) and COMPETE, Portugal.
1
A. Popel and P. Johnson,Annu. Rev. Fluid Mech.37, 43 (2005). 2
M. Faivre, M. Abkarian, K. Bickraj, and H. Stone, Biorheology43, 147 (2006). 3
A. Guido and P. Johnson,C. R. Phys.10, 751 (2009). 4
P. C. Sousa, F. T. Pinho, M. S. N. Oliveira, and M. Alves,Biomicrofluidics5, 014108 (2011). 5
R. Lima, T. Ishikawa, Y. Imai, and T. Yamaguchi, inSingle and Two-Phase Flows on Chemical and Biomedical Engi-neering, edited by R. Dias, A. Martins, T. Mata, and R. Lima (Bentham Science) (in press).
6
H. Goldsmith and V. Turitto, J. Thromb. Haemost.55, 415 (1986). 7
N. Maeda,Jpn. J. Physiol.46, 1 (1996). 8
S. Chien, S. Usami, R. Skalak, inHandbook of Physiology—The Cardiovascular System IV, edited by E. M. Renkin and C. C. Michel (American Physiological Society, Bethesda, 1984), p. 217.
9
R. Fahraeus and T. Lindqvist, Am. J. Physiol.96, 562 (1931). 10
R. Lima, S. Wada, K. Tsubota, and T. Yamaguchi,Meas. Sci. Technol.17, 797 (2006). 11
(2009).
26T. Nakano, T. Itoyama, K. Yoshida, Y. Sawada, S. Ikeda, T. Fukuda, T. Matsuda, M. Negoro, and F. Arai,
Biomicroflui-dics4, 046505 (2010).
27L. T. Chau, B. E. Rolfe, and J. J. Cooper-White,Biomicrofluidics5, 034115 (2011). 28
R. Zhou and H-C. Chang,J. Colloid Interface Sci.287, 647 (2005).
29R. Zhou, J. Gordon, A. F. Palmer, and H-C. Chang,Biotechnol. Bioeng.93, 5 (2006). 30
S. S. Shevkoplyas, T. Yoshida, L. L. Munn, and M. W. Bitensky,Anal. Chem.77, 933 (2005). 31S. S. Shevkoplyas, T. Yoshida, S. C. Gifford, and M. W. Bitensky,Lab Chip6, 914 (2006). 32
T. Ishikawa, H. Fujiwara, N. Matsuki, T. Yoshimoto, Y. Imai, H. Ueno, and T. Yamaguchi,Biomed. Microdevices13, 159 (2011).
33
R. Lima, C. S. Fernandes, R. P. Dias, T. Ishikawa, Y. Imai: T. Yamaguchi, inComputational Vision and Medical Image Processing:Recent Trends, edited by J. M. R. S. Tavares and R. M. N. Jorge (Springer Science+Business Media B.V., Netherlands, 2011), p. 297.
34M. D. Abramoff, P. J. Magalha˜es, and S. J. Ram, Biophotonics Int.11, 36 (2004). 35
E. Meijering, I. Smal, and G. Danuser,IEEE Signal Process. Mag.3, 46 (2006). 36I. F. Sbalzarini and P. Koumoutsakos,J. Struct. Biol.151, 182 (2005). 37
R. P. Dias, C. S. Fernandes, M. Mota, J. Teixeira, and A. Yelshin,Carbohydr. Polym.74, 852 (2008).
38C. S. Fernandes, R. P. Dias, J. M. No´brega, I. M. Afonso, L. F. Melo, and J. M. Maia,J. Food Eng.69, 281 (2005). 39
C. S. Fernandes, R. P. Dias, J. M. No´brega, and J. M. Maia,Chem. Eng. Process.46, 825 (2007). 40C. S. Fernandes, R. P. Dias, J. M. No´brega, and J. M. Maia,J. Food Eng.89, 441 (2008). 41